organic chemistry: 11: Spectroscopy
1/33
There's no tags or description
Looks like no tags are added yet.
Name | Mastery | Learn | Test | Matching | Spaced | Call with Kai |
|---|
No analytics yet
Send a link to your students to track their progress
34 Terms
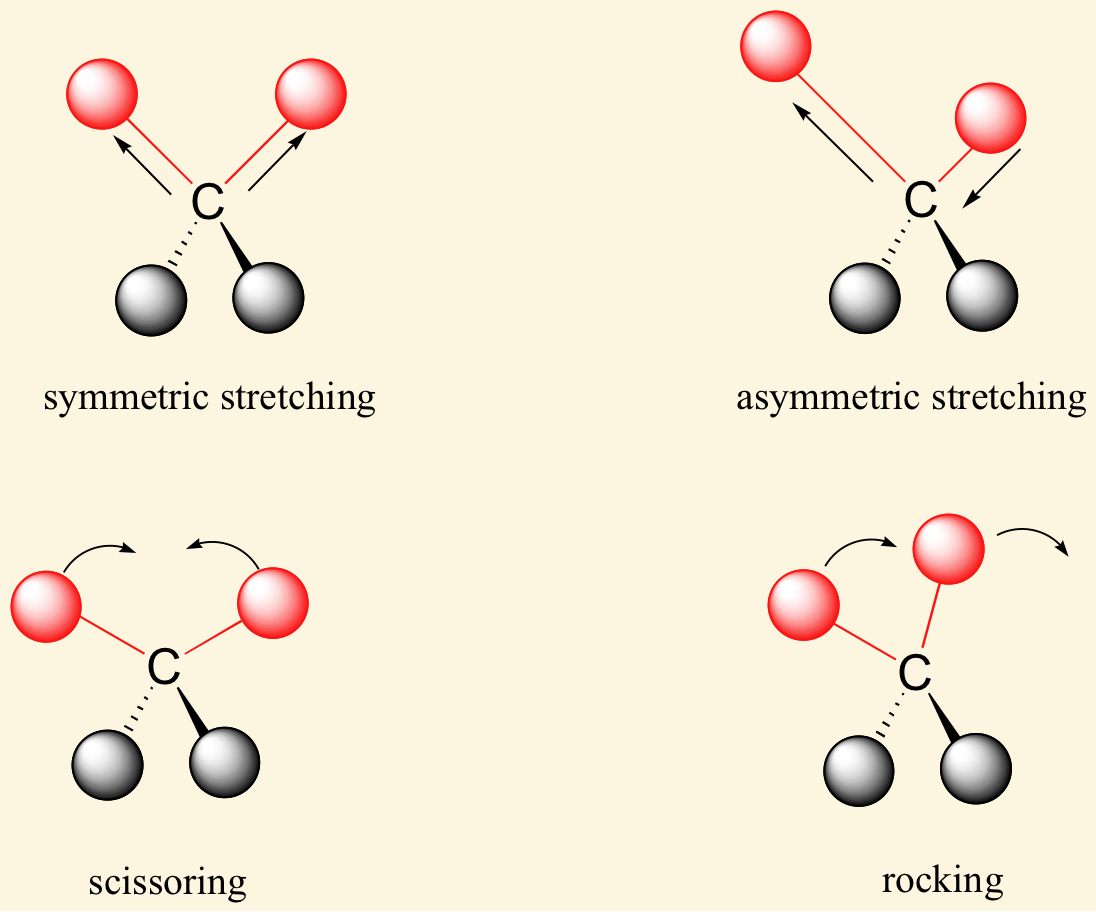
[... spectroscopy] measures absorption of infrared light, which causes molecular vibration such as stretching, bending, twisting, and folding
infrared spectroscopy
based on this it is possible to determine the functional groups that make up the molecule
plotted as % transmittance vs. wavenumber (1/wavelength sign)
![<p><span>The IR spectroscopy frequency for N-H bonds is </span><span style="color: mediumseagreen"><strong>[...]</strong></span><span> cm</span><sup>-1</sup></p>](https://knowt-user-attachments.s3.amazonaws.com/e11de41e-217a-4837-aab7-d30ddd6442b9.png)
The IR spectroscopy frequency for N-H bonds is [...] cm-1
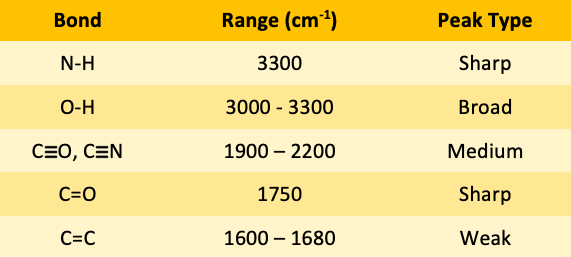
N0H bond is 3300

![<p><span>The IR spectroscopy frequency range for O-H bonds is </span><span style="color: mediumseagreen"><strong>[...]</strong></span><span> - </span><span style="color: mediumseagreen"><strong>[...]</strong></span><span> cm</span><sup>-1</sup><span> </span></p>](https://knowt-user-attachments.s3.amazonaws.com/f7f2c93d-6dc2-41bb-8ab5-b537d3efedde.png)
The IR spectroscopy frequency range for O-H bonds is [...] - [...] cm-1
O-H bond is 3000-3300

![<p><span>The IR spectroscopy frequency range for CO and CN triple bonds is </span><span style="color: mediumseagreen"><strong>[...]</strong></span><span> - </span><span style="color: mediumseagreen"><strong>[...]</strong></span><span> cm</span><sup>-1</sup></p>](https://knowt-user-attachments.s3.amazonaws.com/68ff1714-5c72-40f8-a316-35a73e29f9a6.png)
The IR spectroscopy frequency range for CO and CN triple bonds is [...] - [...] cm-1
CO and CN triple bond is 19000-2200
![<p><span>The IR spectroscopy frequency for C=O bonds is </span><span style="color: mediumseagreen"><strong>[...]</strong></span><span> cm</span><sup>-1</sup></p>](https://knowt-user-attachments.s3.amazonaws.com/9cc9b173-152c-433f-ab4a-26afb11ec716.png)
The IR spectroscopy frequency for C=O bonds is [...] cm-1
C=O 1750

![<p><span>The IR spectroscopy frequency range for C=C bonds is </span><span style="color: mediumseagreen"><strong>[...]</strong></span><span> - </span><span style="color: mediumseagreen"><strong>[...]</strong></span><span> cm</span><sup>-1</sup><span> </span></p>](https://knowt-user-attachments.s3.amazonaws.com/3c7d9940-eaa1-4a59-a6a1-db628af54f33.png)
The IR spectroscopy frequency range for C=C bonds is [...] - [...] cm-1
C=C 1600-1680

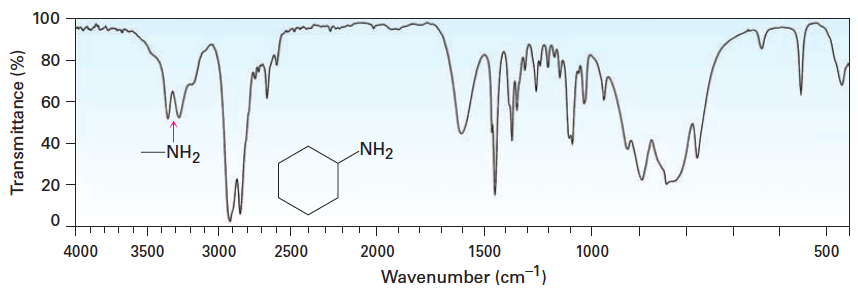
![<p><span>The type of bond indicated in this IR spectroscopy chart is </span><span style="color: mediumseagreen"><strong>[...]</strong></span></p>](https://knowt-user-attachments.s3.amazonaws.com/0d56b16c-1ae6-4414-a9da-62d184715c68.png)
The type of bond indicated in this IR spectroscopy chart is [...]
N-H

![<p><span>The types of bonds indicated in this IR spectroscopy chart are </span><span style="color: mediumseagreen"><strong>[...]</strong></span><span> and </span><span style="color: mediumseagreen"><strong>[...]</strong></span></p>](https://knowt-user-attachments.s3.amazonaws.com/f89b1931-d144-461f-a5df-956b2ccfe9db.png)
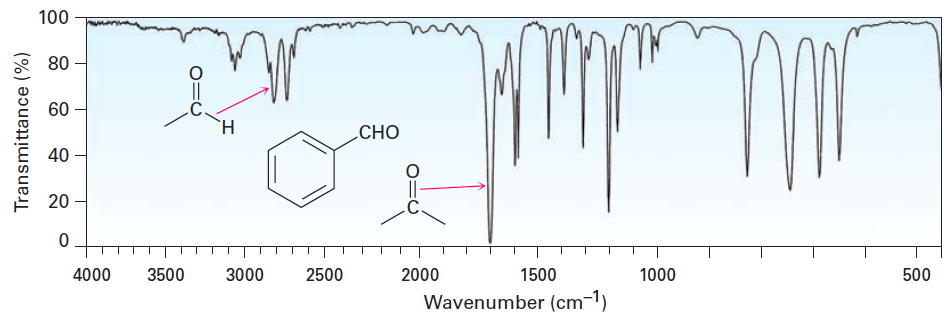
The types of bonds indicated in this IR spectroscopy chart are [...] and [...]
C-H and C=O

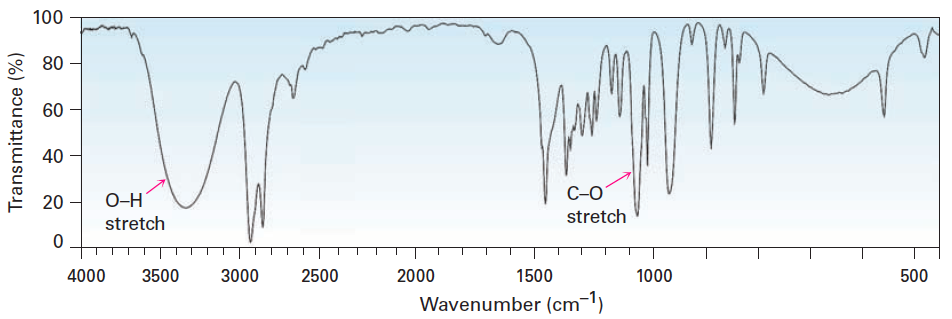
![<p>t<span>he types of bonds indicated in this IR spectroscopy chart are </span><span style="color: mediumseagreen"><strong>[...]</strong></span><span> and </span><span style="color: mediumseagreen"><strong>[...]</strong></span></p>](https://knowt-user-attachments.s3.amazonaws.com/c3f2b8cd-b9f6-4400-bdea-d7fb5e2a76e2.png)
the types of bonds indicated in this IR spectroscopy chart are [...] and [...]
O-H and C-O
[... spectroscopy] measures the absorption of UV light, which causes movement of electrons between molecular orbitals
ultraviolet spectroscopy
uv spectra are plotted as percent transmittance or absorbance vs wavelength.
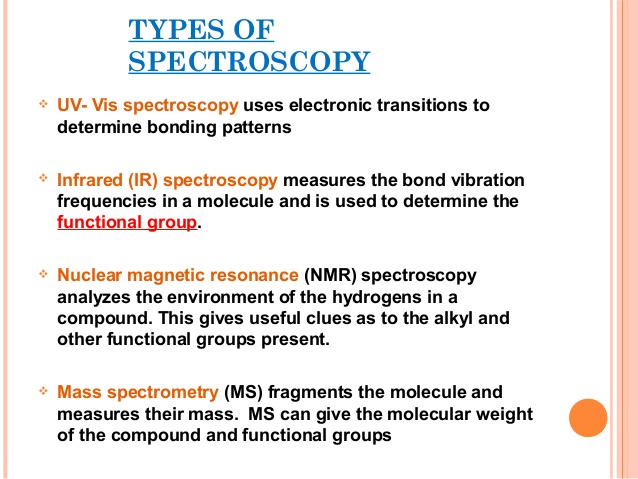
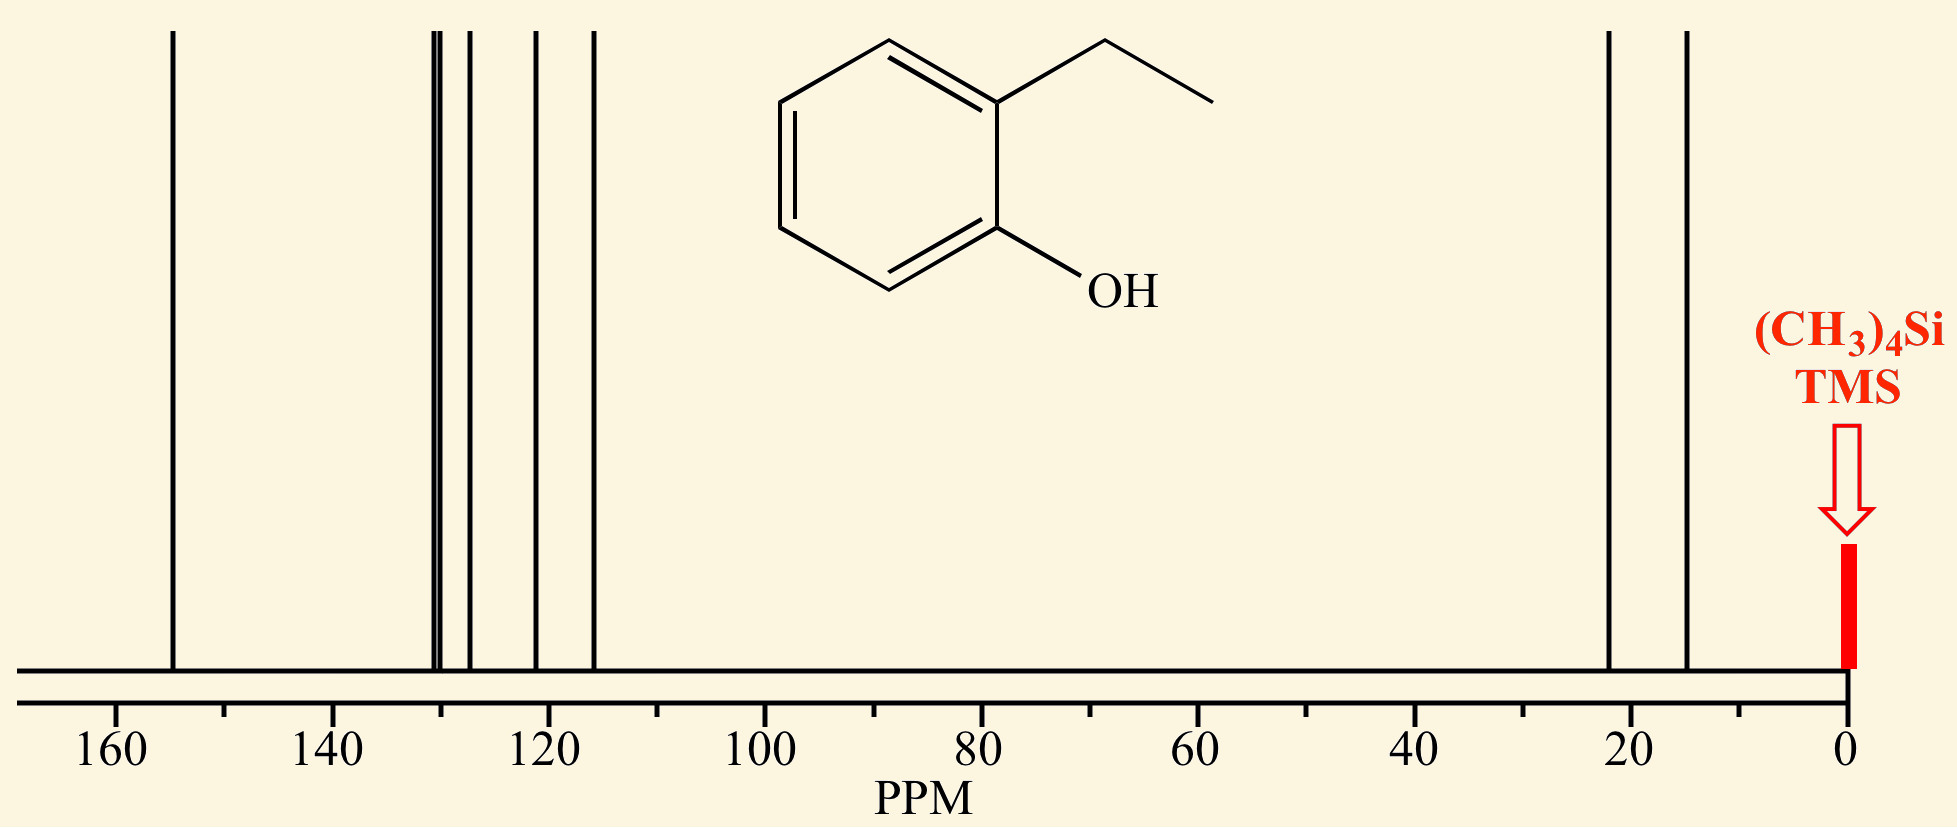
[... spectroscopy] measures alignment of nuclear spin with an applied magnetic field
nuclear magnetic resonance spectroscopy
-NMR spectroscopy is useful for determining the structure (connectivity) of a compound, including functional groups
plotted as frequency vs. absorption energy
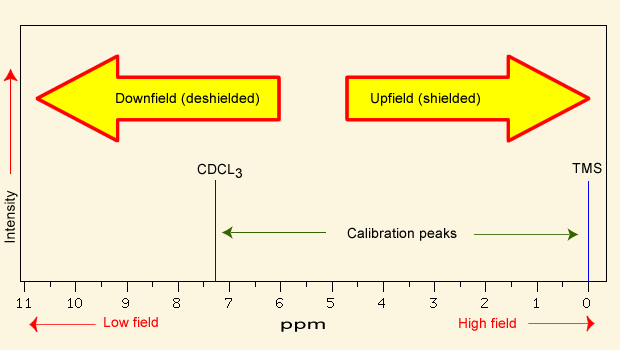
NMR spectra are calibrated using [...], which has a chemical shift of 0 ppm
calibrated
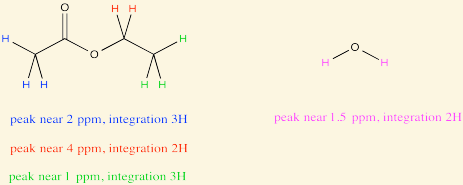
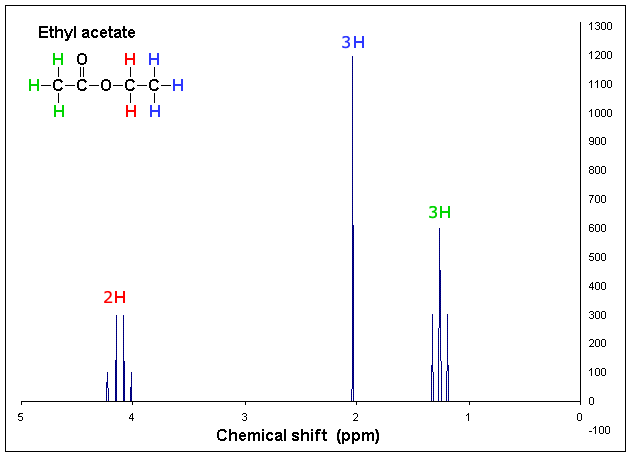
The [...] is the area under each peak (signal) on the NMR spectrum. It corresponds to the number of protons in that signal
integration
[...] in NMR spectroscopy is when a nucleus' chemical shift is increased due to the removal of electron density, magnetic induction, or other effects
deshielding
deshielding is the opposite of shielding
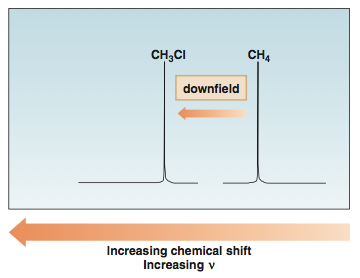
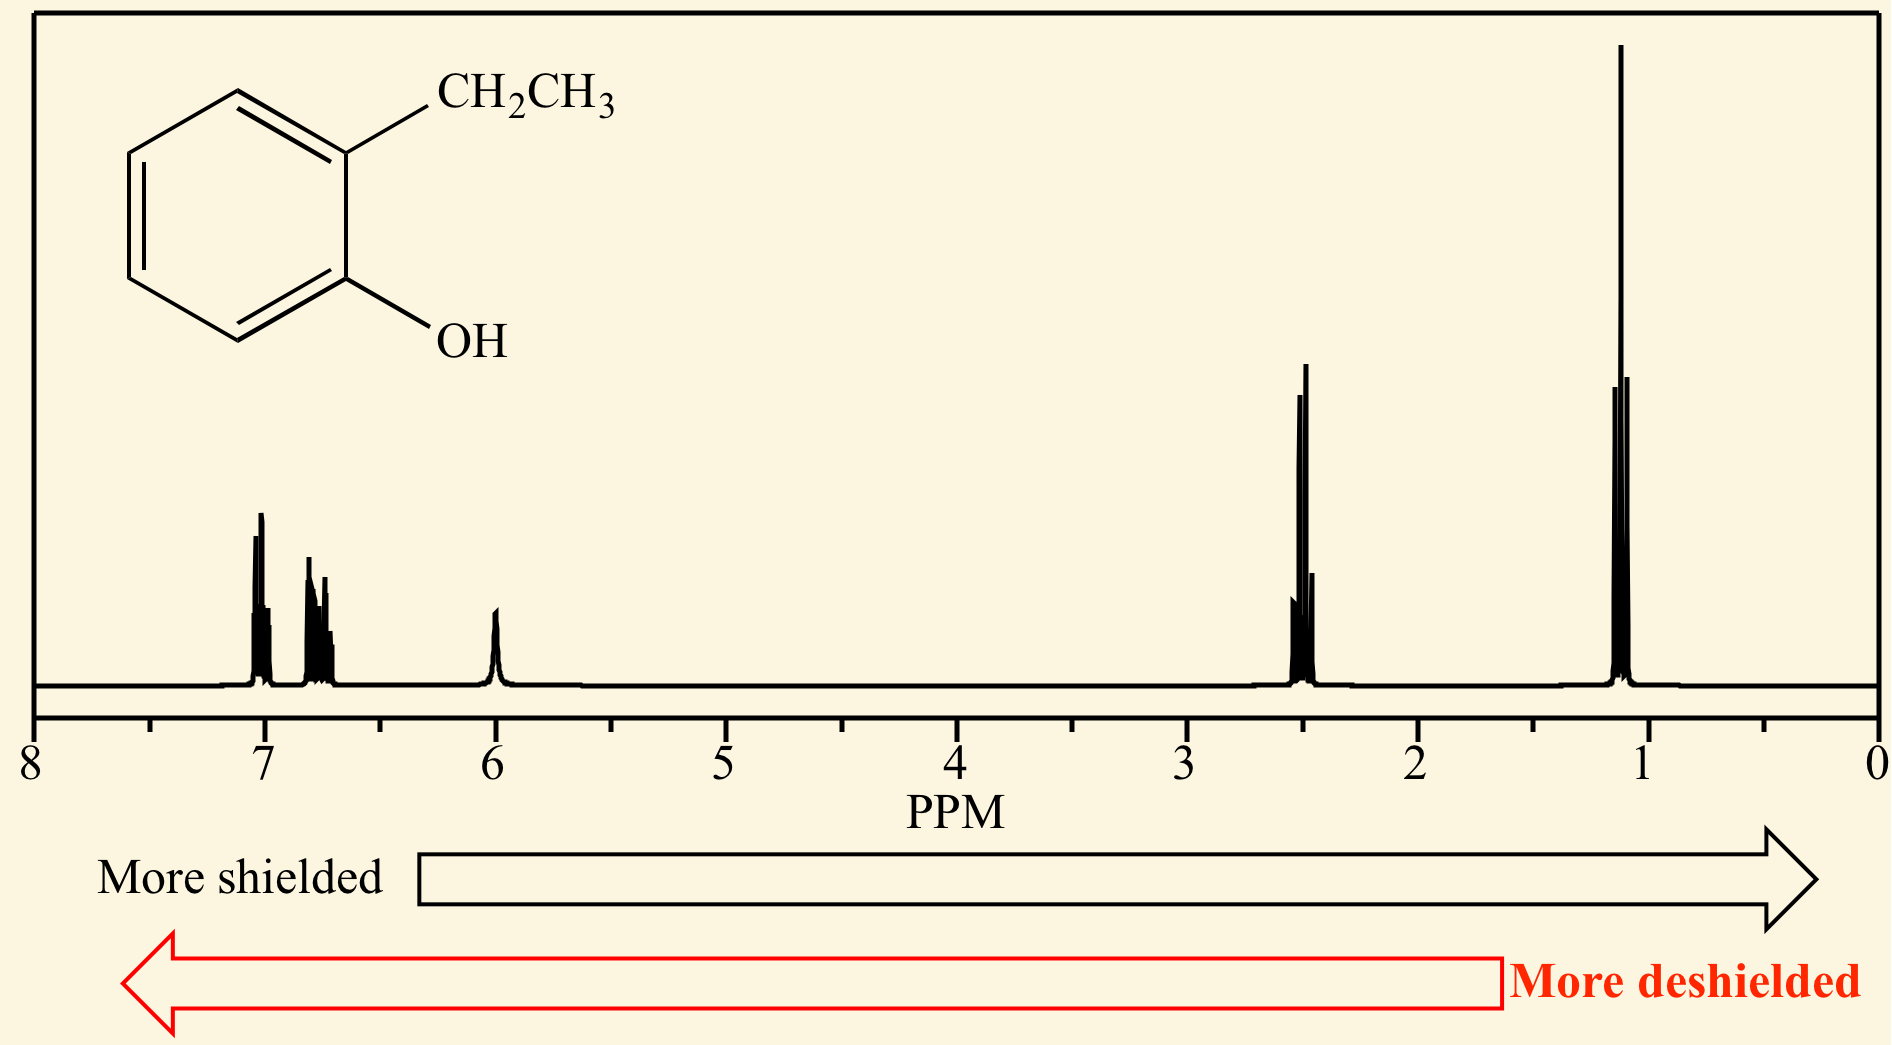
In NMR spectroscopy, the [...] is the position on the δ scale (in ppm) where the peak occurs
chemical shift

In NMR spectroscopy, a peak that is deshielded appears [downfield or upfield]
downfield (left)

In NMR spectroscopy, a peak that is shielded appears [downfield or upfield]
upfield (right)
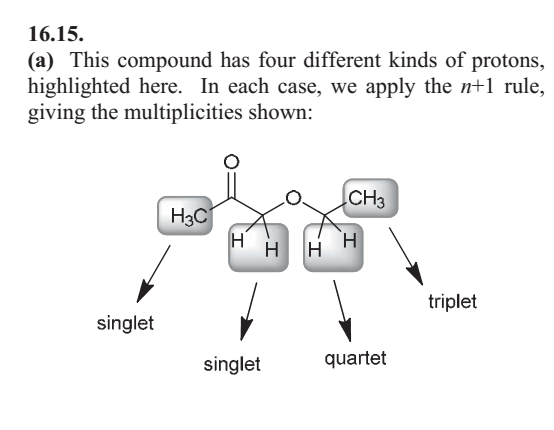
When hydrogens are on adjacent atoms, they interfere with each other’s magnetic environment, causing [...] also known as [...]
spin-spin coupling also known as splitting
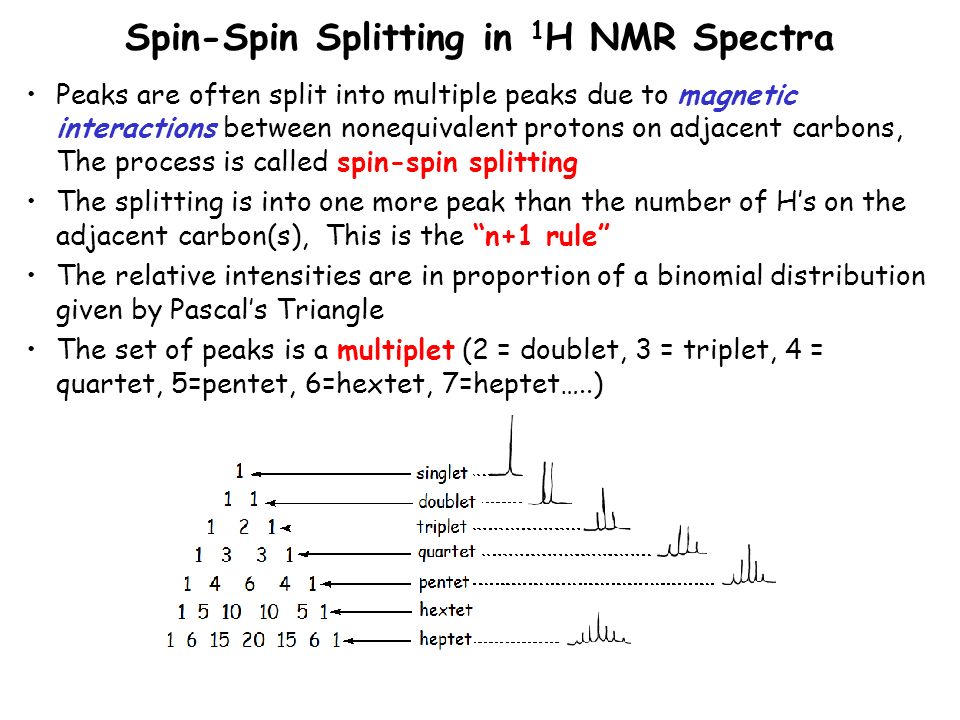
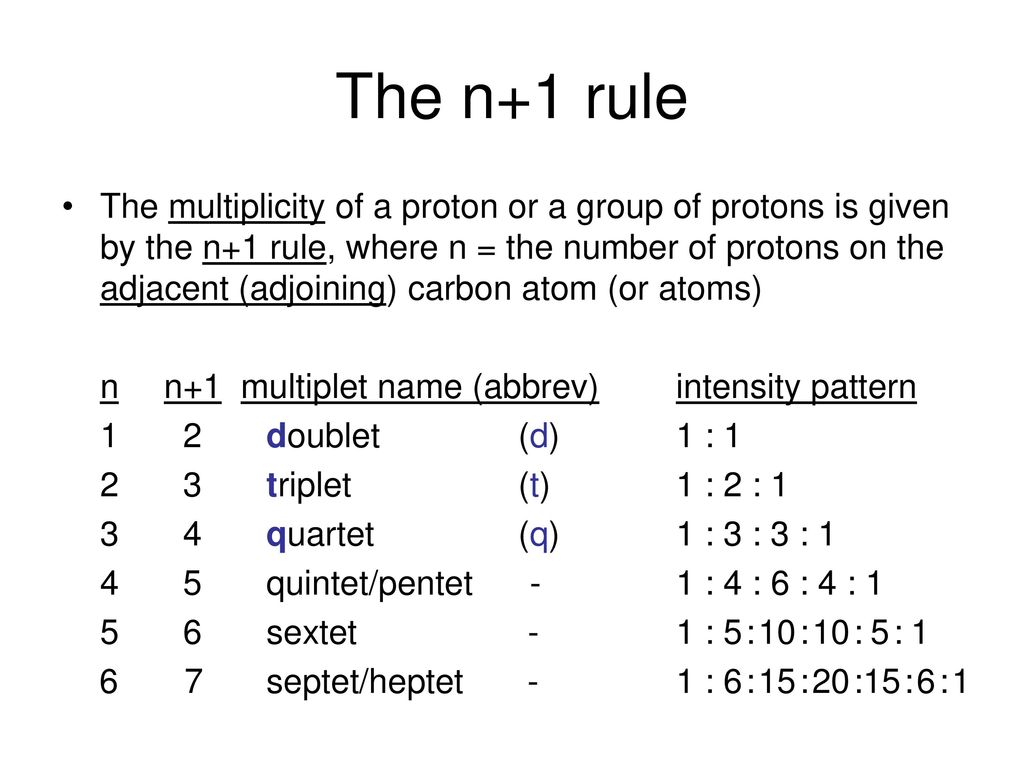
In NMR spectroscopy, the multiplicity of a proton or group of protons is given by the n+1 rule, where n = [...]
n=the number of protons on the adjacent (adjoining) carbon carbon atom (atoms)
![<p><span>The hydrogens of a/an </span><span style="color: mediumseagreen"><strong>[...]</strong></span><span> group have an NMR range of </span><strong>0.7 - 1.9</strong><span> ppm</span></p>](https://knowt-user-attachments.s3.amazonaws.com/501b15d9-e72d-4173-b6ba-997d8efac3ce.png)
The hydrogens of a/an [...] group have an NMR range of 0.7 - 1.9 ppm
alkyl

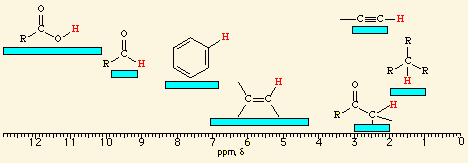
![<p><span>A/an </span><span style="color: mediumseagreen"><strong>[...]</strong></span><span> hydrogen has an NMR range of </span><strong>2.5 - 3.0</strong><span> ppm</span></p>](https://knowt-user-attachments.s3.amazonaws.com/afc310ef-2657-4611-b5d5-bc2c3e9a5133.png)
A/an [...] hydrogen has an NMR range of 2.5 - 3.0 ppm
alkynyl

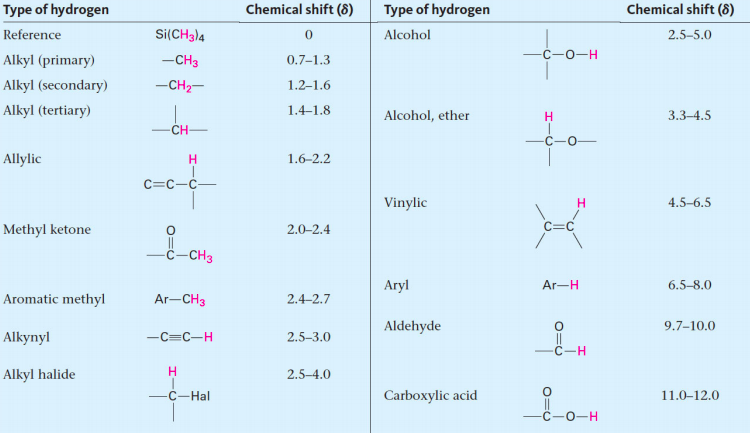
![<p><br><span>The hydrogens of a/an </span><span style="color: mediumseagreen"><strong>[...]</strong></span><span> have an NMR range of </span><strong><u>2.0 - 2.4</u></strong><span> ppm</span></p>](https://knowt-user-attachments.s3.amazonaws.com/6d12c93a-454e-4b5f-be02-8462d912bea2.png)
The hydrogens of a/an [...] have an NMR range of 2.0 - 2.4 ppm

methyl ketone

![<p><span style="color: mediumseagreen"><strong>[...]</strong></span><span> hydrogens have an NMR range of </span><strong>4.5 - 6.5</strong><span> ppm</span></p>](https://knowt-user-attachments.s3.amazonaws.com/b6431a00-3fa5-4c8f-bf44-06f8bd2a1c69.png)
[...] hydrogens have an NMR range of 4.5 - 6.5 ppm
vinylic

![<p><span>The hydrogens of a/an </span><span style="color: mediumseagreen"><strong>[...]</strong></span><span> group have an NMR range of </span><strong>6.5 - 8.0</strong><span> ppm</span></p>](https://knowt-user-attachments.s3.amazonaws.com/00800e24-6e0a-4d03-bada-efae31938be8.png)
The hydrogens of a/an [...] group have an NMR range of 6.5 - 8.0 ppm
aryl

![<p><br><span>The hydrogens of a/an </span><span style="color: mediumseagreen"><strong>[...]</strong></span><span> group have an NMR range of </span><strong><u>9.7 - 10.0</u></strong><span> ppm</span></p>](https://knowt-user-attachments.s3.amazonaws.com/a4069800-261a-4e38-ad94-8513c3b90494.png)
The hydrogens of a/an [...] group have an NMR range of 9.7 - 10.0 ppm
aldehyde

![<p><span>The hydrogens of a/an </span><span style="color: mediumseagreen"><strong>[...]</strong></span><span> group have an NMR range of approximately </span><strong>11.0 - 12.0 </strong><span>ppm</span></p>](https://knowt-user-attachments.s3.amazonaws.com/785c539c-dd88-4d18-87ca-2451e1da405d.png)
The hydrogens of a/an [...] group have an NMR range of approximately 11.0 - 12.0 ppm
carboxylic acid

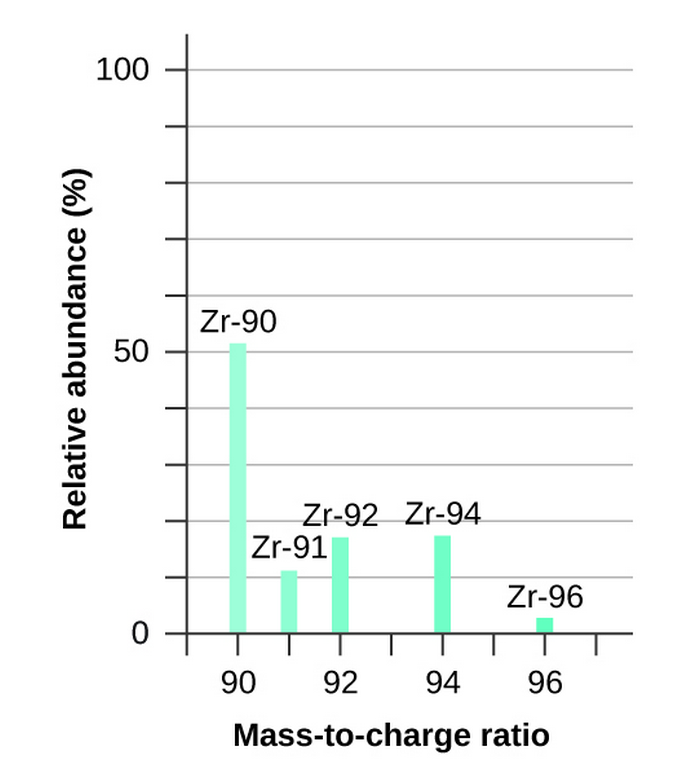
A mass spectrometer ionizes atoms and molecules with a high-energy electron beam and then deflects the ions through a magnetic field based on the [...] of the ion
mass to charge ratio (m/z)
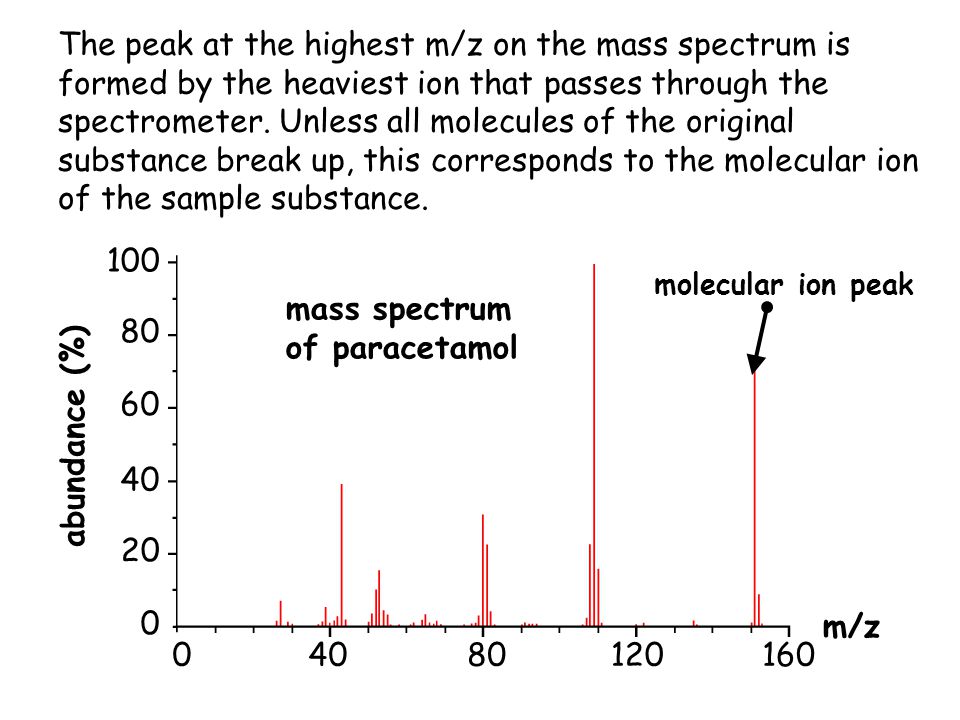
the mass spectrum of a sample shows relative abundance of each ion on the y-axis and m/z along the x-axis
The largest peak in the mass spectrum, corresponding to the most abundant ion, is called the [...]
base peak
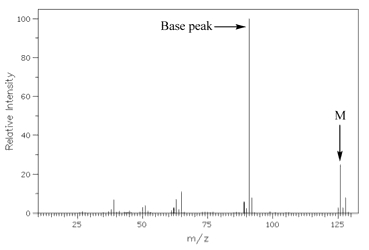
In the mass spectrum, the heaviest ion (the one with the greatest m/z value) is likely to be the [...]
molecular ion
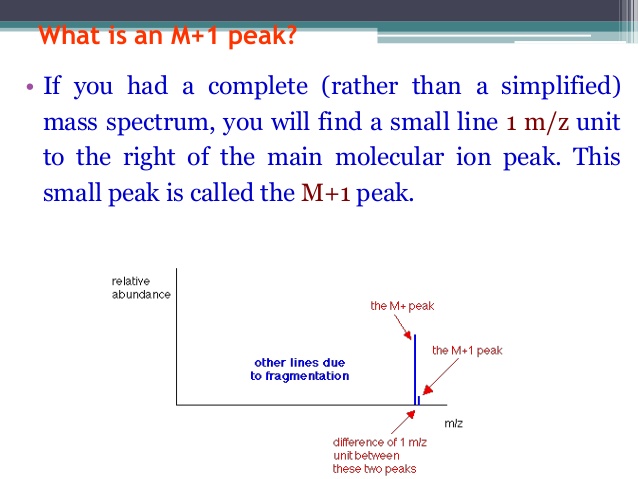
In a mass spectrum, the [...] peak is a small peak 1 m/z unit to the right of the main molecular ion peak
m+1
the M+1 peak shows the relative abundance of 13C
13C is found in relative abundance of 1.1%
so, the M+1 has an m/z value of 4.4 that means there are 4 carbons single 4.4/1.1 = 4
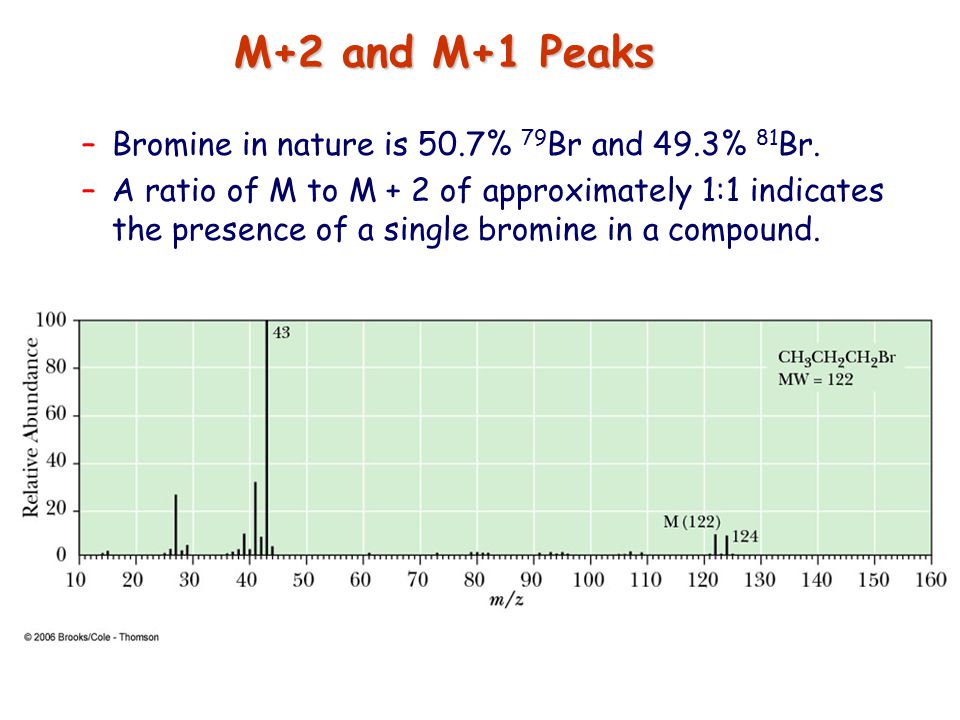
In a mass spectrum, the M+2 peak shows the relative abundance of either [...] or [...]
81 Br and 37 Cl
Br: has a 1:1 ration relative to the M peak
Cl has a 3:1 ration relative to the M peak
In a mass spectrum:
Br has a [...] ratio relative to the M peak
Cl has a [...] ratio relative to the M peak
1:1
3:1

![<p><strong>Based on the size of the M+2 peak</strong><span>, you know this is a mass spectrum of a molecule that contains </span><span style="color: mediumseagreen"><strong>[element]</strong></span></p>](https://knowt-user-attachments.s3.amazonaws.com/7803b174-aaa3-4a16-b21e-2e9edb50c768.png)
Based on the size of the M+2 peak, you know this is a mass spectrum of a molecule that contains [element]
bromine
Br has a 1:1 ratio relative to the M peak

![<p><strong>Based on the size of the M+2 peak</strong><span>, you know this is a mass spectrum of a molecule that contains </span><span style="color: mediumseagreen"><strong>[element]</strong></span></p>](https://knowt-user-attachments.s3.amazonaws.com/06e55d50-c154-4194-9134-aba964783ab3.png)
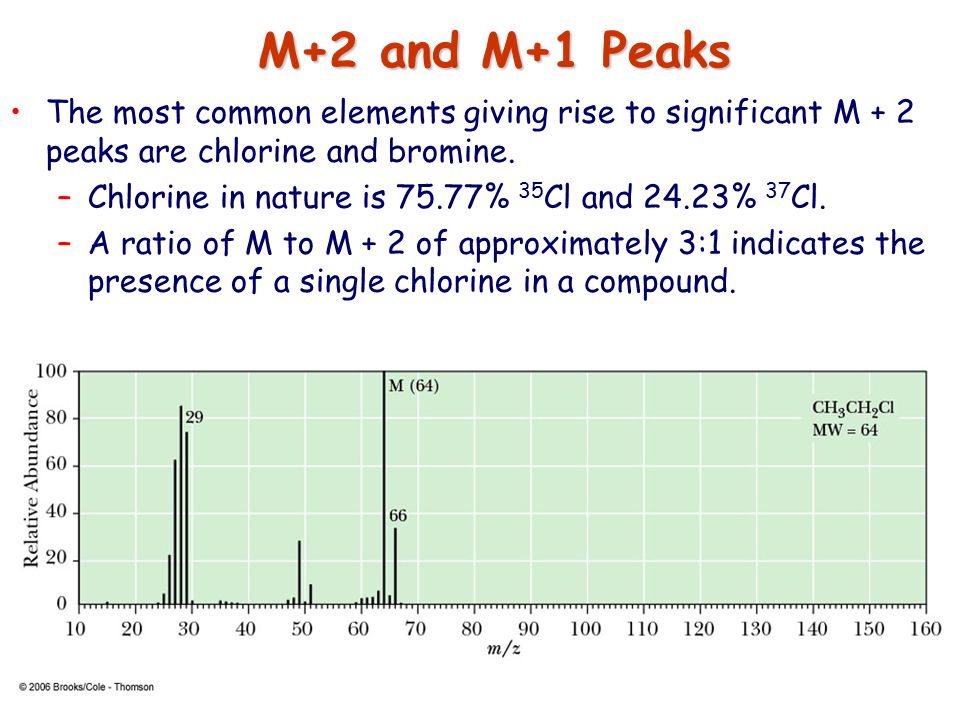
Based on the size of the M+2 peak, you know this is a mass spectrum of a molecule that contains [element]
chlorine
cl has a 3:1 ratio relative to the m peak