Data science for Business + Fairness
1/109
There's no tags or description
Looks like no tags are added yet.
Name | Mastery | Learn | Test | Matching | Spaced | Call with Kai |
|---|
No study sessions yet.
110 Terms
data science
a set of fundamental principles that guide the extraction of knowledge from data
what are the pros of artificial neural networks
reduces the need for feature engineering
can fit any function '(non-linear or otherwise)
extreme flexibility
state fo the art performance acriss many domains
cons of artificial neural networks
‘black bocx’, bas interpretability
optimization is stochastic, solutions possibly unstable
negative side of using cummulative response / gains cure and lift curve
they are not robust to changes in class proportions
→ ROC curves are (but harder to interpret)
what do activation functions do in neural networks
they allow neural networks to model complex non-linear patterns
what type of activation functions exist, and when do we use them
ReLU : used most of the time
sigmoid activation function : for binary classification tasks
softmax activation function : for multinomial classification tasks
why is gradient descent used
to optimize the neural network weitghts
main takeaway from backrpopagation
the oder that we chose to compute partial derivatives : from the back of the NN to the fornt
partial derivatives reappear due to sequential dependency of layers and chain rule → storing results allows for fatser computations
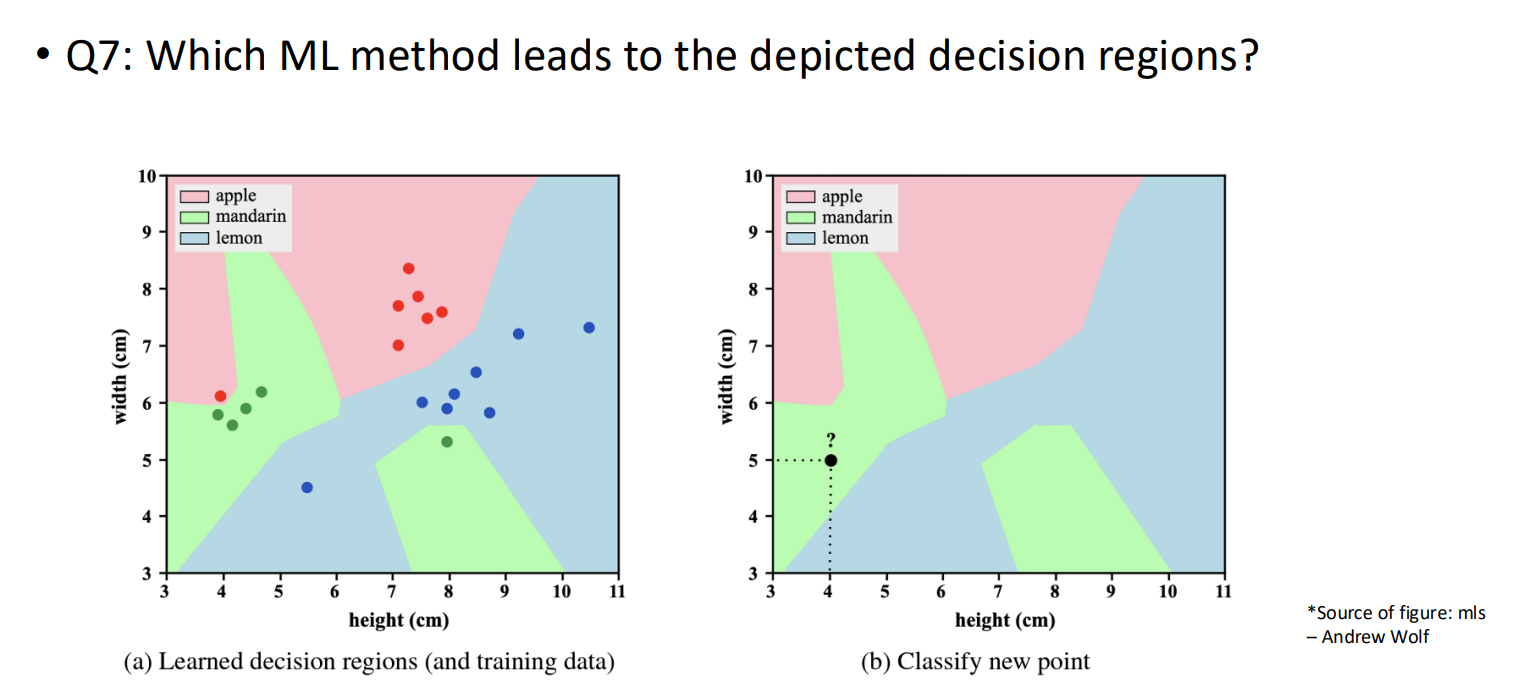
picture : which machine learning method leads to the depicted decision regions
KNN (k=1)
The decision regions shown in the images are a classic example of a Voronoi Tessellation. Here is how we can tell:
Individual Influence: In the left plot, you can see that every single data point (training example) sits inside its own "cell" or "neighborhood" of a specific color. For example, the outlier red dot at (4, 6) creates a small red island in the middle of a green region.
Exact Boundary Fitting: The boundaries are composed of perpendicular bisectors between neighboring points of different classes. This happens when the algorithm classifies a new point based solely on the single closest training point.
Sensitivity to Noise: The "islands" of color (like the green dot surrounded by blue at height 8, width 5.2) indicate that the model is perfectly fitting the training data, which is a hallmark of $k=1$. If $k$ were higher (e.g., $k=5$), the boundaries would be much smoother and less influenced by single outliers.
why is logistic regression considered a linear classification method
because for a given cut-off, the decision boundaru / surface is linear
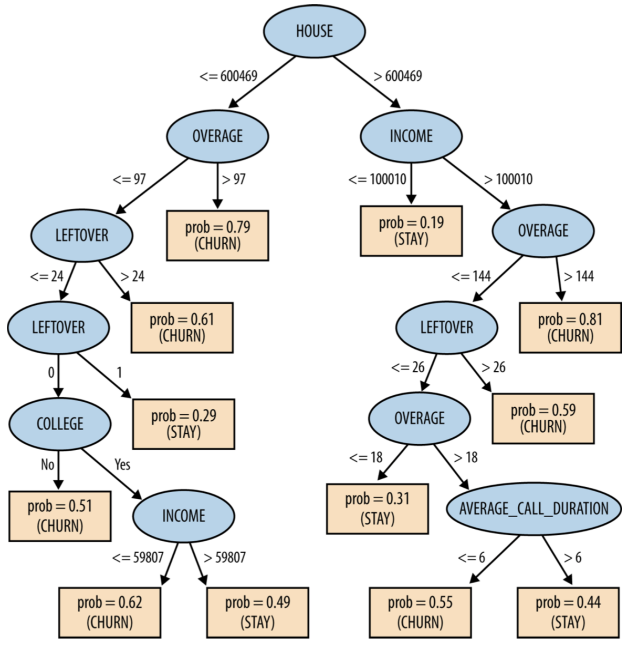
Decision tree assignment decision: Majority voting vs Probability • Discuss using visualization
Majority voting and probabilistic voting are two fundamentally different approaches to collective decision-making. Majority voting results in a single, definitive winner, while probabilistic voting uses a random process to select an outcome with a probability based on voter preferences or power.
why do we use information gain and not directly imprvemen of accuracu in evaluating candidate splits in decsiosn trees ?
While accuracy only cares about the final "win/loss" at a node, Information Gain measures the reduction in uncertainty, which is a much more sensitive guide for building an effective tree.
what is a gradient
a vector that describes the derivate or rate of change of a function
componts of the vector are the partial derivatives of the loss function with respect to the network parameters
points in the direction of greatest increase of a function
is zero at a local maximum of local minimum
data mining
is the extraction of knowledge form data, via technologies that incorporate these principles
churn
customers switching from one company to another
→ attracting new customers is much more expensive than retaining existing ones
what ensemble method can we use to reduce bias
boosting and stacking
what is a cross entropy metric (log_loss in scikitlearn)
Cross-entropy is a metric used to measure the difference between two probability distributions: the true labels (what actually happened) and the predicted probabilities (what your model thinks will happen).
what ensembble methods can we use to reduce variance
bagging methods, forest of random trees
polynomial regression
when you add powers of each feature as new features, then train a lineair model on this extended set of features
biased model
errors due to wrong assumptions inherent to the learning algorithm
(low model complexity)
variance in the model
errors due to sensitivity to fluctuations in the training dataset
→ high model complexity
bagging : bootstrap aggregation
use the same training algorithm for every predictor but train them on different random subsets of the training set
sample random subsets from the training set with replacement (put samples back in the set afer a subset was used)
lower variance compared to a single predictor trained on the original set
what happens to the slope of your ridge regression when you increase alpha
Ridge regression, the parameter alpha acts as a "penalty" on the size of your coefficients (the slopes). As you increase alpha, the slopes of your regression line are forced to shrink toward zero.2
When $\alpha$ is 0: It acts exactly like standard Linear Regression.
As $\alpha$ increases: The model is "punished" for having large $\beta$ (slope) values. To keep the total cost low, the model must choose smaller values for the slopes.
As $\alpha \to \infty$: The slopes get closer and closer to 0, eventually resulting in a horizontal line (though they never mathematically hit absolute zero in Ridge regression).
DDD : data driven decision making
the practice of basing decisions on the analysis of data, rather than purely on intuition
how does a bagging ensemble of trees work
1. Bootstrapping (Data Sampling)
The algorithm creates multiple different versions of your original dataset. It does this using sampling with replacement.
If you have 100 rows of data, the algorithm might pick 100 rows at random to create "Bag 1."
Because it’s "with replacement," some rows will be picked twice, and others won't be picked at all.
This process is repeated for as many trees as you want in your ensemble (e.g., 100 bags for 100 trees).
2. Parallel Training (Building the Trees)
Each "Bag" of data is used to train its own individual decision tree.
These trees are typically grown deep and are not pruned.
Because each tree saw a slightly different version of the data, they will all develop different "opinions" or "biases."
Crucially, these trees are trained in parallel—they don't talk to or influence each other.
3. Aggregating (The Final Vote)
When you want to make a new prediction, you pass the input through every single tree in the ensemble.
For Classification: Each tree "votes" for a category. The class with the most votes wins.
For Regression: Each tree predicts a number. The final answer is the average of all those numbers.
random forest
adds extra randomness compared to bagging
subsamples are drawn with replacement
and the splits are chosen from a random subset of the total number of features
→ idea : lots of very diverse high variance and low bias trees combine to generate a low bias low variance forest
data processing technologies
do not involve extracting knowledge or data-driven decision making
big data
means datasets that are too large for traditional processing systems, and therefore require new processing technologies
classification and class probability estimation
attempt to predict, for each individual in a population, which of a set of classes this individual belongs to
→ class probability estimation : a score representing the probability that that individual belongs to each class
whan do we mean when we say that random forests make it easy to identify a features importance
by looking at how much the tree nodes that use that feature reduce impurity on average (across all trees in the forest)
regression
attemps to estimate or predict, for each individual, the numerical value of some variable for that individual
what is boosting
any ensemble method that can combine several weak learners into a strong learner (reduce bias)
train predictors sequentially
iterative procedure where observations currently misclassified are made more important → remove errors sur to model’s bad assumptions
similarity matching
attemps to find associations between entities based on transactions involving them
AdaBoost
a first base classifier (such as a decision tree) is trained and used to make predictions on the training set. The relative weight of misclassified training instances is then increased. A second classifier is trained using the updates weights and again it makes predictions on the training set, weights are updated
profiling
attempst to characterize the typical behavior of an individual, group or population
stacking
combine predictions of different models
use a regression model to learn the optimal weight of each model’s predictioon
ideally reduces variance and bias
link-prediction
attempts to predict connextions between data items, usually by suggesting that a link should exist, and possibly also estimating the strength of the link
data reduction
attempts to take a large set of data and replace it with a smaller set of data that contains much of the important information in the larger set
causal modeling
attempts to help us understand what events or actions influence others
unsupervised learning
when there is no target
supervised data mining problem
when there is a specific target defined
→ classification and regression
CRISP DM : business understanding
it is vital to understand the problem to be solved
CRISP DM : Data understanding
it is important to understand the strength and limitations of the data bc rarely is there an exact match with the problem
CRISP DM : data preparation
analytic technologies often require data to be in a form different from how the data are provided naturally, and some conversion will be necessary
ex : converting data to tabular format, removing or inferring missing values, and converting data to different types/ normilising numerical values
CRISP DM : modeling
finding some sort of model or pattern capturing regularities in the data
CRISP DM : evaluation
assess the data mining results tigorously and gain confidence that they are valid and reliable before moving on
CRISP DM : deployment
the results are put into real use in order to realize some return on investment
on what does data mining focusses
on automated search for knowledge, patterns, or regularities from data
query (not data mining)
is a specific request for a subset of data or for statistics about data
data warehouses (not data mining)
collects and coalesce data from across an entreprise, often from multiple transaction-processing systems, each with its own database
machine learning
is a subset of artificial intelligence, and is concerned with models for improving the knowledge or performance of an intelligent agent over time, in response to the agent’s experience in the world
what is information
a quantity that reduces uncertainty about something
what is a model
a simplified representation of reality created to serve a puprose,
it is simplified based on some assumptions about what is and is not important for the specific purpose
model induction
the creation of models from data
what do we mean when we say that we wnat to have groups as pure as possible
we want groups that are homogeneous with respect to their target variable
what is entropy
is a measure of disorder that can be applied to a set
disorder = how mixed (impure) the segment is with respect to the properties of interest
information gain IG
is used to measure how much an attribute improves (decreases) entroppy over the whole segmentation it creates. Information gain measures the change in entropy due to any amount of new information being added
what type of learning are decision trees
supervised segmentation, because each leaf contains a value for the target variable
what is the goal at each step with classification trees
is to select an attribute to partition the current group ointo subgroups that are as pure as possible with respect to the target variable
what is the goal of data mining
to tune the parameters so that the model fits the data as well as possible
→ parameter modeling
decision boundaries
boundarues that partition the instance space into similar regions
loss
a general term for error penalty
a loss function determines how much penalty should be assigned to an instance based on the error in the model’s predictive value
differences between classification trees and linear classifiers
DT used decision boundaries that are perpendicular to the instance-space axes, whereas the linear classifier can use decision boundaries of any direction or orientation
DT segments the instance space recursively, using a divde and conquer approach. A linear classifier places a single decision surface through the entire space. It is limited to a division into two segments
what type of tasks can we use neural networks
for classification and regresison
overfitting the data
is the tendency of data mining procedures to tailor models to the training data, at the expense of generalization to previously unseen data points
generalization
is the property of a model or modeling process, whereby the model applies data that were not used to build the model
fitting graph
show the accuracy of a model as a function of complexity
generalization performance
by comparing the predicted values with the hidden true values
base rate
the percentage of the majority class
why is overfitting bad
as the model gets more complex, it is allowed to pick up harmful spurious correlations. these correlatios are idiosyncracies of the specific training set used and do not represent characteristics of the population in general
holdout data
data not used in building the model, but for which we do know the actual value of the target variable
cross-validation
is a more sophisticated holdout training and testing procedure. We would like not only a simple estimate of the generalization performance, but also some statistics on the estimated performance, such as the mean, and the variance, so that we can understand how the performance is expected to vary across datasets
→ cross validation computed its estimates over all the data by performing multiple siplits and systematically swapping out samples for testing
how does cross-validation work
begins by splitting a labeled dataset into k partition - folds
it iterates training and testing k times, in a particular way
in each iteraction of the cross-validation, a different fold is chosen as the test data
1. Split: Divide the 100 rows into 5 equal "folds" (20 rows each).
2. Iterate: Run 5 separate training loops. In each loop, use a different fold as the validation set and the remaining 4 folds (80 rows) as the training set.
3. Score: Calculate the performance (e.g., accuracy) for each of the 5 loops.
4. Average: Take the mean of those 5 scores to get a robust estimate of how the model performs on unseen data.
True or False: After performing K-fold Cross-Validation, we end up with K different models to use in production.
False. * During the CV process, we do technically train K temporary models to evaluate the chosen hyperparameters.
The Final Step: Once we are satisfied with the results, we throw away those 5 models and train one final model on the entire dataset using the best parameters found during CV.
Key Insight: CV is for assessment, not for creating the final production model.
cross validation Why go through the trouble of training 5 times instead of just doing one simple Train/Test split?
1. Stability: It ensures every data point gets a chance to be in the "validation set," making the performance score less dependent on a "lucky" or "unlucky" split.
2. Data Efficiency: It is especially useful for smaller datasets where a single split might leave too little data for training.
learning curve
the generalization performance againt the amount of training data
generally : the more training data becomes available, the better the generalization performance (up to a certain point)
what techniques do DT use to avoid overfitting
1) stop growing the tree before it gets to complex
2) gros the tree until it is too large, then prune it back, reducing its size
nested holdout testing
the validation set is separate from the final test set, on which we are never going to make any modeling decisions
If you use the same validation set to tune multiple hyperparameters (e.g., first max_depth, then min_samples_leaf), what is the primary risk?
Overfitting to the validation set. * By repeatedly "peeking" at the validation set to make decisions, the hyperparameters start to capture the specific noise and quirks of those specific validation samples rather than general patterns.
The validation score will become optimistic (too high), and the model will perform worse on truly unseen data
How do you safely tune multiple hyperparameters without "exhausting" your validation data?
Use Grid Search or Random Search with K-Fold Cross-Validation.
Instead of tuning one parameter and then another, you test a "grid" of combinations (e.g., Depth 3 + Leaf 5, Depth 5 + Leaf 2) simultaneously.
By using K-Fold, the "validation set" changes in every iteration, making it much harder for the model to overfit to a specific subset of data
To ensure your tuning process hasn't overfitted, what is the final step in the workflow?
The Hold-out Test Set.
You must keep a completely separate "Test Set" that is never used during any part of the tuning or training process.
You only touch this set once at the very end to confirm that your tuned model actually works.
what is regularization
trying to optimize not just the fit to the data, but a combination of fit to the data and simplicity of the model
what do we become when we incorporate L2 norm penalty into standard least squares linear regression
we get ridge regression
what do we become when we incorporate L1 norm (sum of the absolute valuesà penalty into standard least squares linear regression
we get lasso
grid search
the general approach to optimizing the parameter values of a data mining procedure
what are the most-similar instances called
nearest neighbors
what is the result of having a high k (smoothness)
the higher k the more the estimates are smoothed out amongs neigbors
how many k (in kNN) results in having more erratic boundaries
with 1-NN classifier
is more sensitive to outliers, bc it retrieves only single instances,
→ tends to overfit a LOT
what happens when we use 1-NN (what type of model will you have)
we get an extremely complex model, which places complicated boundaries such that every training example will be in a region labeled by its own class
what might be a problem with K-NN
lack of an explicit, interpretable model
importance of feature selection → is very sensitive to unnuseful variables
clustering
the idea of finding natural groupings in the data
supervised modeling
involves discovering patterns to predict the value of a specific variable, based on data where we know the values of the target variable
unsupervised modeling
does not focus on a target variable
instead it looks for other sorts of regularities in a set of data
positive example
= one worthy of attention or alarm
a negative example is uninteresting / benign
accuracy
the proportion of correct decisions
what does a confusion matrix
separates out the decisions made by the classifier, making explicit how one class is being confused for another
why can the class distribution be unbalanced / skewed
because the unusial / interesting class is rare among the general population
what is the base rate of a class
how well a classifier would perform by simply choosing the majority class for every instance
what problems exist regarding the use of accuracy as a metric
it makes no distinction between false positive and false negative errors → it makes the assumption that both errors are equally important
and unbalanced class distribution