Part 1: Real Business Cycle Theory
1/155
There's no tags or description
Looks like no tags are added yet.
Name | Mastery | Learn | Test | Matching | Spaced |
|---|
No study sessions yet.
156 Terms
What is the Short Run
Some Prices like Wages, Rent or commodity prices do not fully adjust
The economy is influenced by demand side shocks like changes in spending
What happens to prices in the short run
The do not respond immediatley to changes in supply and demand. his stickiness is due to things like wage contracts, lease agreements, minimum wage laws, and long-term commodity pricing contracts
What is the consequence of sticky prices
Demand tends to fall. This may be because a loss of consumer confidence increases uncertainty and decreases spending. There also may be a decrease in Income and so when people have lower incomes, they buy less good and services which reduces demand. Also high interest rates- which means borrowing becomes more expensive so consumers and businesses reduce spending and investment
What happens in the long run
Prices are flexible and fully adjust to changes in supply and demand, leading to a return to potential output levels.
What is a buisness cycle
A business cycle is a pattern of economic expansion (growth) and contraction (decline).
What is an expansion
Output (real GDP) increases, employment rises, incomes grow.
What is Output
Output refers to real GDP—total value of goods and services produced, adjusted for inflation.
When was the Great Recession
2007-2009
How did the Great Recession start
In the US, triggered by the the collapse of a housing bubble and financial system failures
How much did real GDP fall by during the recession
4.2 percent between Q4 2007 & Q2 2009
How much did unemployment increase by during the great recession
It rose from 4.8 percent to 9.3 percent
Which other areas did the recession spread to
other major economies such as United Kingdom and the Eurozone

What does the “trend line” represent in a GDP graph?
It represents the long-run average growth of the economy — showing the economy’s potential output over time, assuming stable conditions without ups and downs. It indicates the general upward direction of GDP, reflecting long-term economic growth.
What is the focus of Growth Theory in macroeconomics?
Growth Theory focuses on explaining why economies grow over the long run. It examines the causes behind the upward slope of the trend line, or in other words, what drives sustained increases in GDP over decades.
What types of questions does Growth Theory try to answer?
Why do some countries grow faster than others over decades?
What are the key factors that determine long-term prosperity?
How can we make the trend line grow faster and higher over time?
What are the main drivers of long-term economic growth in Growth Theory?
Technological progress
Capital accumulation (investment in equipment, buildings, infrastructure)
Human capital (education, skills, training)
Institutions (rule of law, property rights, political stability)
What is the goal of Growth Theory?
To understand and improve the economy’s long-term potential — how to increase the slope and position of the trend line so that output and living standards rise steadily.

What does the black wavy line on the graph represent?
It represents actual GDP over time, which fluctuates above and below the trend line. These ups and downs are known as the business cycle.
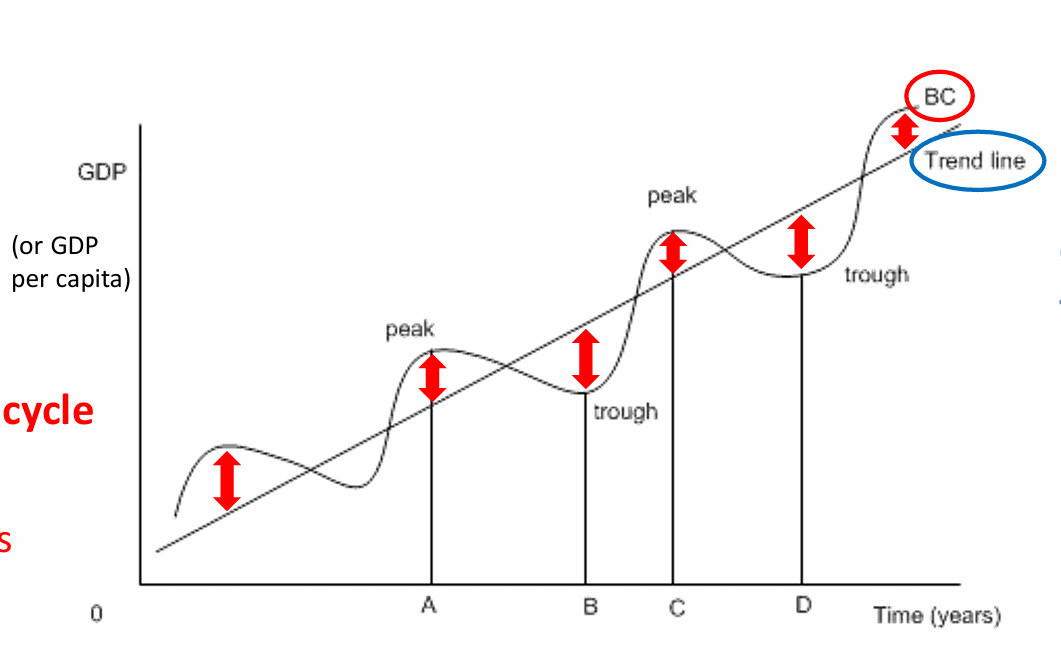
What do the red arrows in the graph highlight?
The red arrows show the deviations from the trend line, indicating periods when GDP is either above (boom/expansion) or below (recession/contraction) the long-run potential.
What is the focus of Business Cycle Theory in macroeconomics?
Business Cycle Theory focuses on short-run economic fluctuations — the reasons why GDP deviates from its long-run trend and how these deviations affect the economy
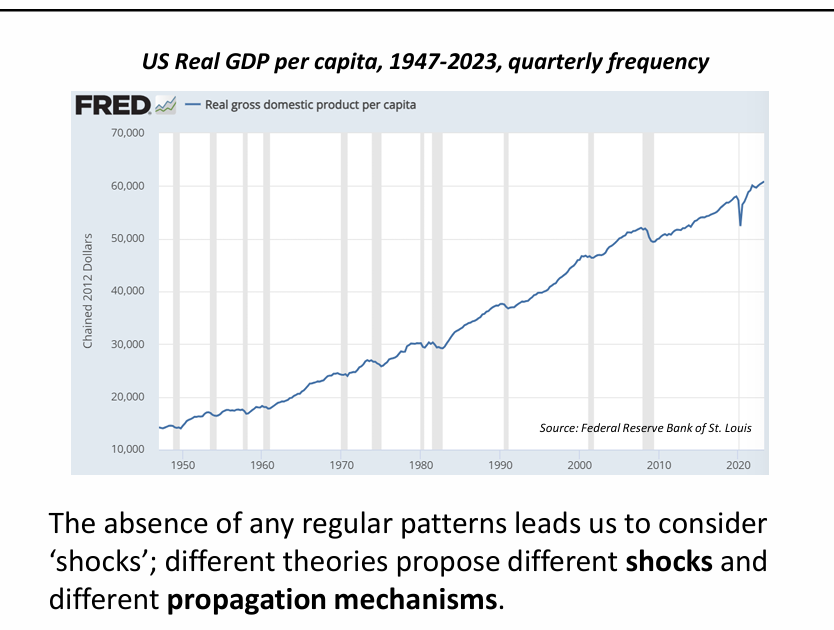
What is the overall direction of the Real GDP per capita line in the graph?
The line shows a long-run upward trend, indicating that the US economy has grown steadily over time.
What does this long-term growth in GDP per capita reflect?
It reflects:
Increased productivity
Technological innovation
Capital investment
Broad economic development
Which economic theory explains the long-term upward trend
Growth Theory — it studies the structural and persistent factors behind long-run economic progress.

Does the GDP per capita line rise smoothly over time?
No, the line includes dips and slowdowns — it is not perfectly smooth.

What do the gray shaded bars on the graph indicate?
The gray bars represent official recession periods — times when the economy contracted.
Do economic recessions follow a predictable, regular pattern?
No, they do not follow a regular pattern. There’s no fixed timing, and they vary in severity and duration.
What causes the irregular and unpredictable nature of economic downturns?
It suggests that downturns are driven by unexpected events, also known as economic shocks — not by a simple, repeating cycle.
What is a shock in macroeconomic models?
A shock is an unexpected event or change that originates outside the economic model. Its occurrence is assumed and not explained by the model itself
What role do shocks play in business cycle models?
Shocks act as the initial triggers that cause economic fluctuations or business cycles. Models study how the economy reacts after the shock, not why the shock occurred.
What are examples of shocks?
Technology shocks
→ New innovations or sudden disruptions that change productivity.Policy shocks
→ Unexpected changes in:Fiscal policy (government spending or taxes)
Monetary policy (interest rates or money supply)
Political shocks
→ Political events like elections or referendums (e.g., Brexit) that change the economic environment.Expectation shocks (animal spirits)
→ Shifts in what people believe about the future — e.g., expectations about future growth or recession — which may not be fully rational.Natural disasters / Weather shocks
→ Events like earthquakes, hurricanes, or pandemics that destroy capital or reduce labor availability.
In Real Business Cycle (RBC) models, do we explain where shocks come from?
No — RBC models assume shocks just happen. The focus is on modeling their effects, not their causes.
What is a propagation mechanism?
A propagation mechanism describes how a shock’s effects spread, amplify, or last in the economy over time. It explains the indirect, knock-on impacts that occur after the initial shock.
Why are propagation mechanisms important?
Because they determine:
How large the shock’s total impact will be
How long the effects will last
Even after the original shock is gone, propagation mechanisms can sustain economic fluctuations.
What are examples of propagation mechanisms?
Consumption and Investment Decisions
A positive productivity shock increases expected future profits.
Firms invest more today → raises current demand and future output → amplifies the shock.
Labor Decisions
Higher productivity leads to higher wages.
People might choose to:
Work more (substitution effect: work is more rewarding)
Work less (income effect: they can afford more leisure)
These changes affect overall labor supply and output.
Financial Market and Firm Decisions
Financial conditions or business strategies can influence credit, borrowing, lending, or expansion plans.
These actions help spread or extend the shock's effects.
What’s the relationship between shocks and propagation mechanisms?
Shocks are the initial spark (e.g., sudden productivity increase).
Propagation mechanisms determine how that spark spreads through the economy, creating ripple effects that shape business cycle fluctuations.
🧠 Think of it like:
Shock = cause
Propagation = chain reaction.
What is the formula for GDP?
Y=C+I+G+(X−M)
Where:
Y = Total output (GDP)
C = Consumption
I = Investment
G = Government purchases
X−M = Net exports (Exports minus Imports)
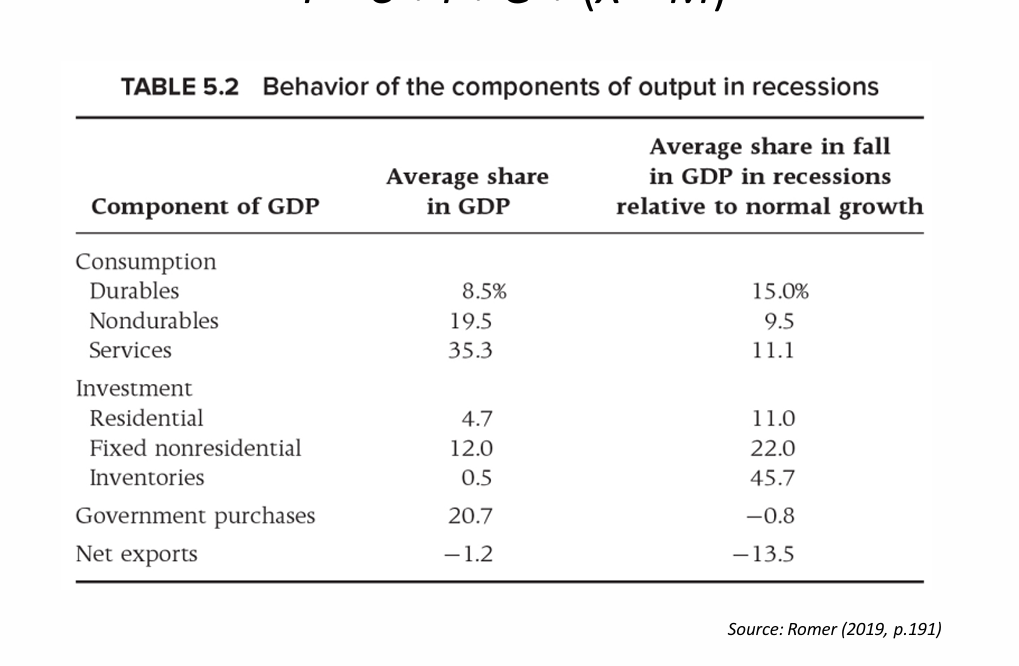
What does the table “Behavior of the components of output in recessions” show?
It compares
Average Share in GDP
This column shows the average percentage that each component contributes to total GDP during normal times (or over a longer period). It gives us a sense of the relative size of each spending category in the economy
Average Share in Fall in GDP in Recessions Relative to Normal Growth
This is the more insightful column for understanding recessions. It tells us how much each component contributes to the decline in GDP during a recession, relative to what its growth would have been if the economy had continued its normal trend.
Important Interpretation: If GDP falls by $100 units during a recession, this column tells you how many of those $100 units of decline came from each component.
How much of GDP is made up by durable goods, and how do they behave in recessions?
Average share: 8.5% of GDP
Share of GDP fall in recessions: 15.0%
→ Durables fall more than proportionately because they’re expensive and easy to delay (e.g., cars, electronics).
What’s the overall takeaway for consumption?
Durables are hit hardest during recessions, even though they’re a smaller part of the economy.
How do investment components behave in recessions?
All investment components are highly volatile.
Inventories, while only 0.5% of GDP, cause 45.7% of the decline during recessions.
→ Businesses stop restocking, which sharply cuts output.
How does government spending behave in recessions?
Share of GDP: 20.7%
Contribution to GDP fall: –0.8%
→ It doesn’t fall in recessions — often it increases, slightly offsetting the downturn.
What’s the takeaway for government spending?
It is countercyclical — helps stabilize the economy during downturns.
What is the average share and recession effect of net exports?
Share of GDP: –1.2% (U.S. usually runs a trade deficit)
Contribution to GDP fall: –13.5%
→ Net exports actually improve during recessions.
Why do net exports improve in recessions?
Because imports fall more than exports, due to weakened domestic demand. This reduces the trade deficit and softens the GDP decline.
Do all GDP components fall equally in a recession?
No. Some components fall much more than others.
Which components contribute most to the decline in GDP during recessions?
Investment (especially inventories)
Durable consumption goods
Which components help cushion or stabilize the economy?
Government spending
Net exports
What does “pro-cyclical” mean in economics?
A pro-cyclical variable is one that moves in the same direction as GDP — it increases during economic expansions and decreases during recessions.
What are some examples of pro-cyclical variables?
Consumption
→ People spend more when income rises during a boom.Investment
→ Firms invest more (e.g., in machines or buildings) when they expect higher returns in a growing economy.Hours Worked
→ People work more hours during expansions due to increased demand and job availability.Employment
→ As GDP grows, more jobs are created, and unemployment falls.Real Wages
→ Wages adjusted for inflation tend to increase during expansions, although this link is weaker and less consistent.Productivity (Y/L)
→ Output per worker typically rises in expansions as firms use labor and capital more efficiently, adopt new technologies, and produce at higher capacity.
Why is the correlation between real wages and GDP considered weak?
Because real wages don’t always rise proportionally with output. Factors like sticky wages, inflation, and labor market conditions can make the connection inconsistent.
How are real wages represented in macroeconomic models?
Real wages are often denoted by w (lowercase “w”) in macro models.
Are real wages pro-cyclical?
They are only weakly pro-cyclical — meaning they may follow the cycle some of the time, but the relationship is inconsistent and weaker than for variables like employment or investment.
Why is the correlation between real wages and GDP weak?
Sticky Wages
→ Wages are slow to change, especially downward, due to contracts, social norms, expectations, and labor laws.Inflation Effects
→ In recessions, prices may fall faster than nominal wages, causing real wages to rise, even as the economy shrinks.Productivity Variation
→ If productivity doesn’t increase in line with labor demand, then wages might not move even when output does.
What does “counter-cyclical” mean in economics?
A counter-cyclical variable is one that moves in the opposite direction of GDP — it increases when GDP decreases and decreases when GDP increases.
What is the classic example of a counter-cyclical variable?
unemployment
It rises during recessions (when GDP falls)
It falls during expansions (when GDP grows)
Why is unemployment considered counter-cyclical?
Because when the economy slows and output drops, firms reduce hiring or lay off workers, leading to higher unemployment.
What does “acyclical” mean in economics?
An acyclical variable is one that shows no clear or consistent relationship with GDP — it doesn't reliably rise or fall during expansions or recessions.
Why are some variables considered acyclical?
Because they don’t follow a predictable pattern with the business cycle. Their movement may depend on other long-term factors or adjust too slowly to reflect short-run changes in GDP
What are examples of acyclical variables?
Real wages
Sometimes rise in expansions, sometimes don’t
Weak correlation with GDP, so classified as acyclical in some contexts
Capital stock
Refers to physical assets like machinery, buildings, etc.
Changes slowly over time (due to long-term investment), so it doesn’t fluctuate much with short-run GDP changes
What does productivity (Y/L) refer to in macroeconomics?
Productivity refers to labor productivity, measured as:
Productivity=Y/L
Where:
Y= Total output (GDP)
L = Labor input (e.g. total hours worked or number of workers)
It shows the output produced per unit of labor — i.e., output per worker or per hour worked.
What does a higher Y/L ratio mean?
It means that each worker is producing more output, indicating higher efficiency and better economic performance.
Why does productivity (Y/L) tend to rise during economic expansions?
Because output (GDP) grows faster than labor input (L). This happens for several reasons:
Why is productivity growth important?
It allows the economy to produce more with the same resources
It drives higher living standards
It supports real wage growth — as workers produce more, firms can afford to pay them more
Does productivity always rise during expansions?
Not always — it depends on:
The sector (e.g., services vs manufacturing)
The quality of capital investment
The pace of technological progress
But on average, productivity is pro-cyclical — it tends to rise when GDP rises.
What is RBC Theory?
Real Business Cycle (RBC) theory is a type of macroeconomic model that explains fluctuations in GDP (business cycles) as the result of real (not monetary) shocks, especially technology shocks. It was developed as part of the effort to build macroeconomics on microeconomic foundations
What kind of economic environment does the RBC model assume?
It assumes a Walrasian economy — a highly idealized setting with perfect competition, flexible prices, and no market imperfections or frictions.
What is a Walrasian equilibrium?
It’s a state where all markets clear through flexible price adjustments, and households and firms optimize (maximize utility or profits) given those prices.
What does "competitive markets" mean in the RBC model?
There are many buyers and sellers, and no individual has market power. Everyone is a price taker.
What is meant by “flexible prices” in RBC?
Prices and wages adjust instantly to ensure that supply equals demand in every market. There are no sticky prices, unlike in Keynesian models.
What are the key assumptions made about imperfections in the RBC model?
No externalities: Individual actions don’t impose unpriced costs/benefits on others.
No asymmetric information: Everyone has full, equal knowledge.
No missing markets: All goods and risks can be traded.
No frictions: No institutional or behavioral barriers exist that prevent efficient outcomes.
Why are these strong assumptions used in the RBC model?
To create a benchmark model that shows how business cycles can emerge even in a perfectly functioning economy. This isolates the role of real shocks (like productivity changes) as drivers of cycles.
What types of shocks are included in the RBC model?
Primarily technology shocks (real productivity changes), and to a lesser extent, shocks to government spending.
How does the RBC model allow for fluctuations in employment and hours worked?
These are endogenous — households choose to work more when productivity (and hence wages) rise, and less when productivity falls. This is a rational response, not involuntary unemployment.
How does a positive technology shock affect the economy in the RBC model?
Productivity increases, making work more attractive
Households supply more labor
Firms produce more
Output and employment expand
Why is the RBC model called a “Real” business cycle model?
Because it explains business cycles using real (non-monetary) variables — such as productivity, labor, and capital — rather than focusing on money, inflation, or interest rates.
Does the RBC model include monetary factors like interest rates or inflation?
No. It excludes money entirely, assuming it is neutral (i.e., changes in money supply don’t affect real economic variables).
What is the key driver of fluctuations in RBC theory?
Technology shocks — unexpected changes in the economy’s ability to produce goods and services.
Can government spending shocks influence the business cycle in RBC?
Yes, but they are considered less important than technology shocks. Sudden changes in government spending can act as real shocks, but with a smaller role.
What does DSGE stand for?
Dynamic Stochastic General Equilibrium
What does each part of DSGE mean?
Dynamic: Models behavior over time
Stochastic: Includes random shocks (like productivity shocks)
General Equilibrium: All markets interact and clear simultaneously
Micro-founded: Based on rational behavior of individuals and firms
Why are micro-foundations important in RBC theory?
They ensure that macroeconomic outcomes are grounded in individual decision-making, making the model internally consistent and more rigorous than older, ad hoc models.
Who were the key developers of RBC theory?
Finn E. Kydland and Edward C. Prescott, who won the 2004 Nobel Prize for their contributions.
What did Kydland and Prescott demonstrate?
That technology shocks alone could generate realistic business cycles in a general equilibrium framework, without relying on frictions or monetary policy.
What is Plosser (1989) known for in this context
Plosser's review concludes that Real Business Cycle (RBC) analysis, built on the neoclassical model of capital accumulation, can explain business cycle fluctuations as responses to external disturbances, particularly real technology shocks. He notes that while technology shocks are central, the framework is broad enough to include other real shocks, and that these models have significantly impacted macroeconomics by showing that equilibrium models can account for many business cycle characteristics, establishing a more rigorous foundation for their study despite being an incomplete theory.
What is a "closed economy" in the RBC model?
A closed economy is one that does not trade with other countries. That means no imports or exports, and all goods and services are produced and consumed domestically.
Who are the agents in a baseline RBC model?
The model includes a large number of identical households and firms, meaning everyone behaves the same way and makes decisions based on the same preferences and constraints.
What does it mean that agents are "price-takers"?
It means individual agents cannot influence prices. Instead, they accept market prices as given. This is typical of competitive markets where no single participant has enough power to change the price.
What is the Cobb-Douglas production function used for in macroeconomics?
It is a mathematical equation that describes how total output (GDP) is produced using capital, labor, and technology as inputs.
What is the formula for the Cobb-Douglas production function?
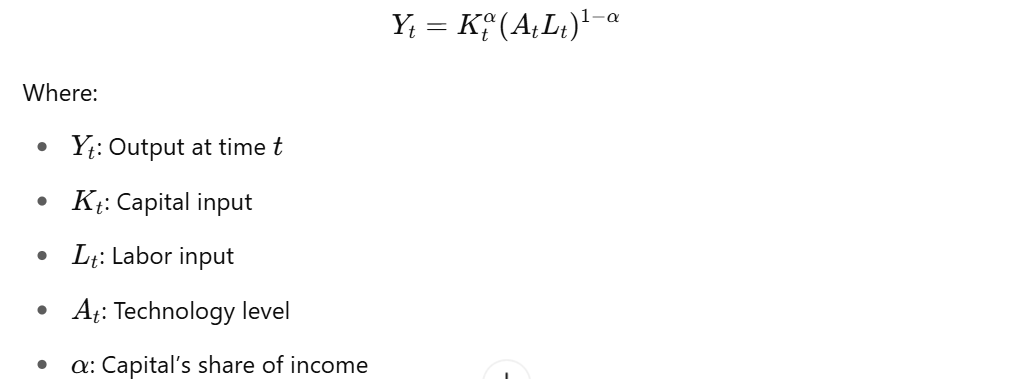
What does each symbol in the Cobb-Douglas production function represent?
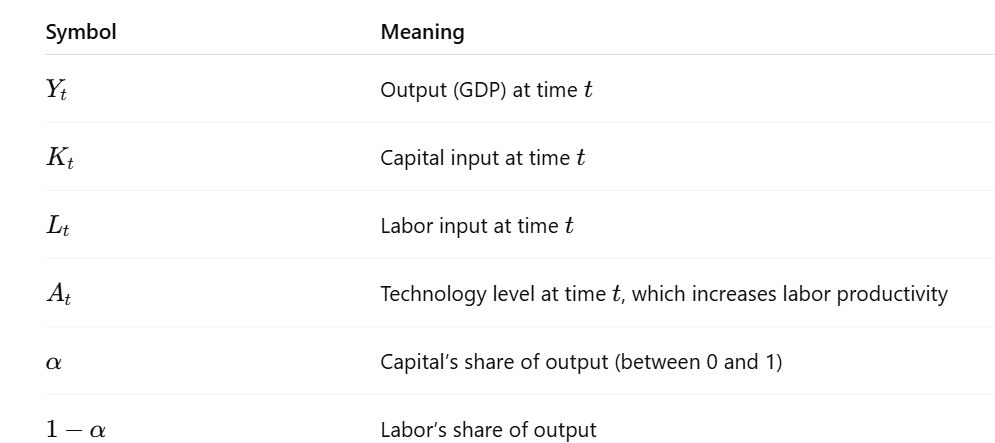
Why are At and Lt grouped together in the Cobb-Douglas function
Because this form assumes labor-augmenting (Harrod-neutral) technology, meaning technology boosts the productivity of labor, not capital directly.
So AtLt represents effective labor — the number of workers adjusted by how productive they are.
What are "diminishing returns" in the context of this function?
It means that if you increase just one input (capital or labor) and keep the other fixed, each additional unit adds less and less to output.
For example:
More machines with same workers → smaller output gain per machine.
More workers with same machines → smaller output gain per worker.
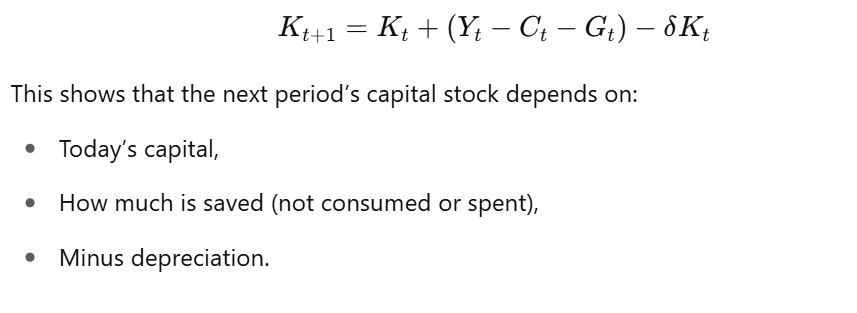
What is the capital accumulation equation in macroeconomics?


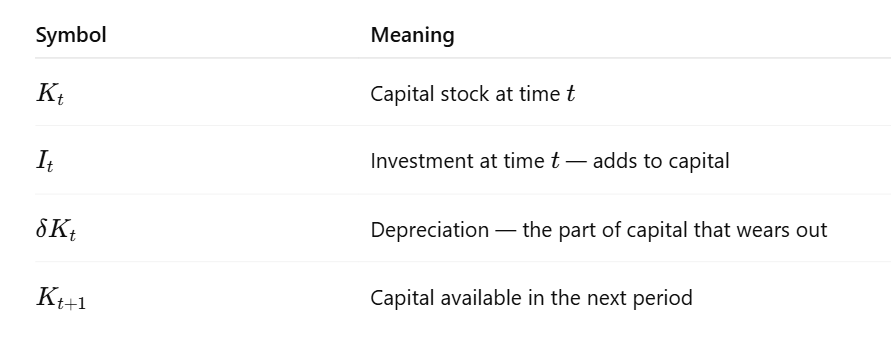
How can we rewrite the capital accumulation equation using output?
What happens in perfectly competitive input markets?
Firms hire labor and rent capital until each is paid exactly their marginal product — that is, the value of what an additional unit of that input contributes to output.
How is the real wage determined in a competitive labor market?
The real wage equals the Marginal Product of Labor (MPL) — the extra output produced by one more worker.
The MPL is the extra output a firm gains by hiring one more worker, holding all other inputs constant
How is the real rental rate of capital determined?
It equals the Marginal Product of Capital (MPK) minus depreciation — because capital wears out over time.
The MPK is the extra output a firm gains by using one more unit of capital (e.g., one more machine), holding other inputs constant.
Why are workers and capital owners paid their marginal product?
Because in competitive markets, firms maximize profit by hiring inputs up to the point where their cost (wage or rental rate) equals their additional contribution to output.
How does a firm decide how many workers to hire?
A firm keeps hiring workers until the real wage equals the MPL.
If MPL > wage, the firm gains profit and should hire more.
If MPL < wage, the firm is losing money on the worker.