Unit Four Review
1/54
Earn XP
Description and Tags
Name | Mastery | Learn | Test | Matching | Spaced | Call with Kai |
|---|
No analytics yet
Send a link to your students to track their progress
55 Terms
When is the sample method independent?
When an individual selected for one sample does not dictate which individual is to be in a second.
When is a sampling method dependent?
When an individual selected to be in one sample is used to determine the individual in the second sample.
What are dependent samples often referred to as?
Matched-pairs samples
What is paired data?
Two sets of observation that are uniquely paired so that an observation in one set matches an observation in the other based on a specific criterion or characteristic.
What is a natural measure of the effect of an observed object/action?
Difference between two groups' outcomes
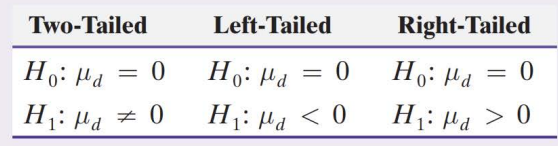
What is the first step to testing hypotheses about the mean difference of matched pairs Data?
Determine the null and alternative hypotheses. The hypotheses can be structured in one of three ways, where µd is the population mean difference of the matched-pairs data. (Always null equal Zero)
What is the second step of testing hypotheses about the mean difference of matched-pairs data?
Select a level of significance, å, depending on the seriousness of making a type I error.
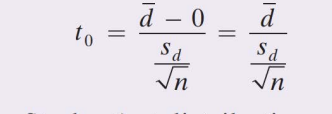
What is the third step of Testing Hypotheses about the mean difference of Matched-pairs data by Hand?
Calculate the test statistic using the sample data., where the values of d-bar, sd are the mean and standard deviation of the differenced data.
What is the fourth step of testing hypotheses about the mean difference of matched-pairs?
If P-value < å, reject the null hypothesis
What is the fifth step of testing Hyptheses about the mena difference of Matched Pairs
Summarize the results and draw a conclusion.
What is the confidence interval for matched pairs data?
.
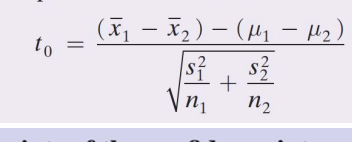
What is the formula to determine the t-distribution of two independent population means?
.

how do we use R-studio to find a t.test() function for the mean difference?
t.test(xdata, ydata, mu = ____, alternative = “_____”, conf.level = ____, paired = 1)
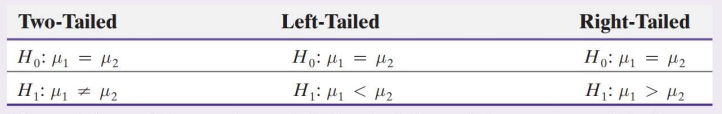
What is the first step in testing hypotheses about the difference of two independent population means?
Determine the null and alternative hypotheses, where the null hypothesis is that the means equal one another
What is the second step of testing hypotheses about the difference of two independent population means?
Select a level of significance, å, depending on the significance of making a type I error
How do we determine degrees of freedom in two Independent population means?
Using the smaller of n1-1 & n2-1
What is the third step of testing the Hypothesis about the difference of two Independent population?
Compute test statistic
What is the Fourth step of testing the Hypothesis about the difference of two Independent population?
If p-value < å, reject the null hypothesis
What is the Fifth step of testing the Hypothesis about the difference of two Independent population?
State the Conclusion
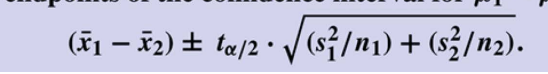
How do you compute the endpoints of the confidence interval for µ1 - µ2?
Use the formula: (point estimate) ± (critical value) × (standard error).
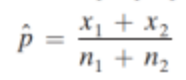
how is the mean of sampling distribution of the difference between two proportions (independent samples) found?
The mean of the sampling distribution is calculated as the difference between the two population proportions, denoted as p1 - p2.
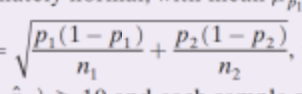
How is the standard deviation of a sampling distribution of the difference between two proportions (independent Samples) found?
The standard deviation of the sampling distribution is found using the formula:
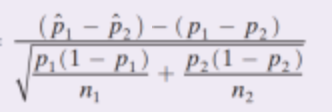
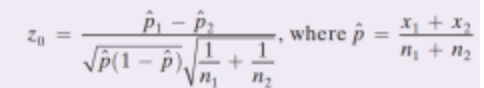
What is the z score of a sampling distribution of the difference between two proportions (independent samples) found
.
What is the first step of finding the confidence level for p1 - p2?
Find zå/2
What is the second step of finding the confidence level for p1 - p2?
the endpoint of the confidence intervalf for p1 -p2 are:
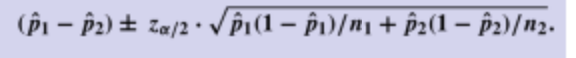
What is the third step of finding the confidence level for p1 - p2?
interpret confidence interval
what is the standard deviation of the hypothesis test for proportion of two independent samples?
.
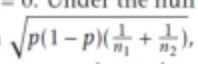
How is the standard error computed since p is unknown in a relation of two proportion of independent samples?
using a weighted average point estimate known as the pooled estimate of p.
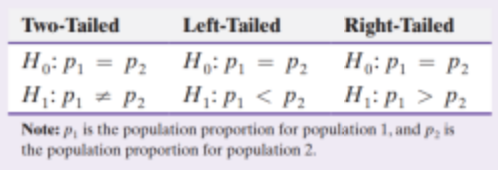
What is the first step of the hypothesis test of the sampling distribution. of two independent proportion samples?
Determine the null and alternative hypotheses. The hypothesis can be structured in one of three ways:
What is the second step of the hypothesis test of the sampling distribution. of two independent proportion samples?
Select a level of significance, å, depending on the seriousness of making a Type I error
What is the third step of the hypothesis test of the sampling distribution. of two independent proportion samples?
Compute the test statistic
What is the fourth step of the hypothesis test of the sampling distribution. of two independent proportion samples?
If P value < å, reject the null hypothesis
What is the fifth step of the hypothesis test of the sampling distribution. of two independent proportion samples?
state the conclusion
what is the code in RSTUdio for the sampling distribution for two proportions (independent samples)
prop.test(c(x1,x2),c(n1,n2), alternative = “two.sided”, “less”, “greater”, conf.level = , correct = FALSE)
What does r represent in statistics?
The correlation coefficient which measures the strength of a linear relationship between two variables. If r is close to 1 or -1, it indicates a strong relationship, while values near 0 suggest a weak relationship.
What does b0 and b1 equal in the following equation? y = b0 + b1x
y-intercept; slope
what is the least squares regression lines?
The line which minimizes the sum of the squared residuals for all the points in the plot. In other words, the least squares line is the line with coefficients b0 and b1 such that the quantity (e1)2 + (e2)2 + … + (en)2
What does ŷ represent?
The predicted value of the dependent variable (y) in a regression equation.
How do you find ei?
yi - ŷi where yi is the actual value of the dependent variable and ŷi is the predicted value.
If the observed line is above the estimation line in a regression model what does it mean?
It indicates that the actual value of the dependent variable is greater than the predicted value, suggesting a positive residual. This means that the model underestimated the observed.
What does it mean if the residuals show a pattern?
It suggests that the model is not capturing some aspect of the data, indicating potential issues with the model's fit or the presence of non-linearity.
What do smaller residuals imply?
imply that the predicted values are closer to the actual values, indicating a better fit of the regression model to the data.
What do larger residuals imply?
They suggest that the predicted values are further from the actual values, indicating a poorer fit of the regression model to the data.
How do residuals help to identify outliers?
Residuals can be analyzed to detect points that deviate significantly from the overall trend in the data, indicating potential outliers that do not fit the expected pattern.
What does it mean if the residuals widen or narrow systematically?
It indicates that the variance of the errors is changing, suggesting potential issues with the model, such as heteroscedasticity, which can affect the reliability of the regression results.
in the least squares regression line what does b1 represent?
the slope of the regression line, indicating the change in the dependent variable for each one-unit change in the independent variable. b1 = r•(sy•sx), where r is the correlation coefficient, sy is the standard deviation of the dependent variable, and sx is the standard deviation of the independent variable.
In the least squares regression line what does b0 represent?
the y-intercept of the regression line, representing the predicted value of the dependent variable when the independent variable is zero. ÿ - b1µ (where ÿ is sample mean of yand µ is sample mean of x)
If b1 is greater than 0?
There is positive linear association and vice versa
What is the code in RSTUDIO for least squares line?
Im(responsevariable~explanatoryvariable),, the plot() and abline() function allow you to see the scatterplot and regression line.
True or False:
When extrapolation is done to a regression model the linear relationship may not hold, meaning the boundaries of linearity are required.
True
When can the regression line be used>
When the value belongs inside of the observed minimum and maximum explanatory variable values, ensuring that predictions are made within the range of the data.
How do we determine the strength of our prediction if all the assumptions of the linear regression are satisfied?
The squared correlation coefficient (R²) indicates how well the regression line fits the data. Which is called the coefficient of determination
What does a value of R2 near 0 suggest?
It indicates that the regression line does not explain the variability of the data well, suggesting a weak relationship between the variables.
What does a value of R2 near 1 suggest?
It indicates that the regression line explains a large proportion of the variability in the data, suggesting a strong relationship between the variables.
How is R2 determined in RSTUDIO?
>cor(x,y)2