Ch 3 - Demand
Market: where buyers and sellers get together to trade
- Housing market (goods and services)
- Stocks (shares)
- Factor (factors of production)
- International markets (international currencies)
Demand: the quantity of a product which consumers are willing and able to buy
Quantity: numerical quantity of a product being demanded
Effective demand: by purchasing power, the purchaser has the money to pay for the product
Ineffective demand: do not have purchasing power
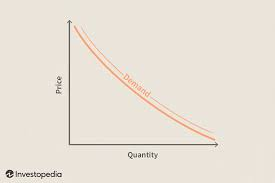
- Law of demand: states that as the price of product falls, the quantity demanded will increase

Based on the graph, we can see these trends:
- When the price goes up, there's a decrease in quantity demanded
- When price goes down, quantity demanded increases
Factors influencing demand (PINTE):
Income: the income of all consumers
a. Income + demand have a positive relationship:
- Increase in ability to pay equals increase in demand, If the ability to pay falls then less is demanded (direct relationship)
- Inferior goods have a negative relationship (customers buy less, inverse relationship)
Price:
- Substitutes: alternative goods can satisfy the same want and need
- A change in the price of one has an impact on the demand
- Complements: goods which have a joint demand as they enhance the satisfaction derived from another good
- A change in the price/availability of either will have an effect on the demand for complementary goods
- Substitutes: alternative goods can satisfy the same want and need
Fashion, taste, and attitude: demand is affected by personal behaviour /preference. As consumer behaviour and preference changes, so does the degree of demand of a good or service.
To increase demand:
- Income rises (normal goods)
- Price of substitution rises
- Price of complementary falls
- Encouraged buying
- Population likely to buy increases

To decrease demand:
Income drops
Substitution falls
Compliments rises
Buying discouraged

PINTE:
- Prices
- Income
- Number of buyers
- Taste/preference
- Expectations
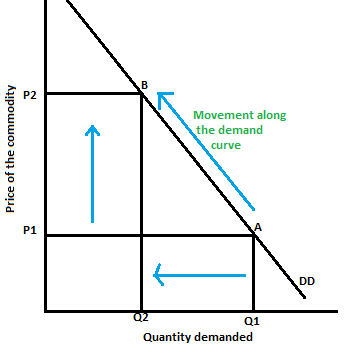
Movement along the Demand curve:
- Rise in price = drop in demand
- Drop in price = increase in demand

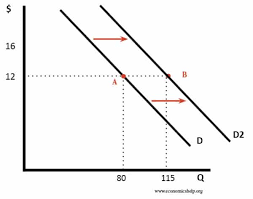
A demand shift can shift:
- Left (decrease demand)
- Right (increase demand)
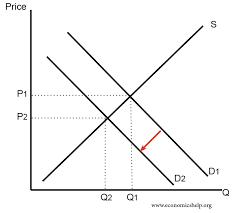
Based on the graph, we can tell that these changes occur in the economy:
- D2: how quantity demanded responds to a change in prices
- D1 and D2: shows how demand responds to a change in a non-price factor
Bounded rationality: theory that consumers have limited rational decision making driven by cognitive ability, time constraint, and imperfect information
- Profit: total revenue - total costs
- Status quo: overwhelming amount of choices
- Complementary goods: demand decreases, quality demand decreases
- Substitute goods: demand increases, quality demanded decreases
Basic rules of movement along the demand curve and what it means:
- decrease in price = expansion in demand = increase in quality demanded
- increase in price = contraction in demand = decrease in quantity demanded