Exam 1 EOC ?s
1/41
There's no tags or description
Looks like no tags are added yet.
Name | Mastery | Learn | Test | Matching | Spaced | Call with Kai |
|---|
No analytics yet
Send a link to your students to track their progress
42 Terms
T/F Nonparametric tests are appropriate when data are normally distributed and measured on interval/ratio scares.
false
What does the central limit theorem state?
The distribution of a sample mean approaches a normal distribution as sample size increases, regardless of the population’s distribution
Which of the following best describes the normal distribution?
A) A distribution with 2 picks
B) A distribution where the mean, median, and mode are the same
C) A distribution where the mean, median, and mode are different
B) A distribution where the mean, median, and mode are the same
Basic steps of scientific inquiry
Natural Phenomenon or an Observed problem → A question → Hypothesis → experimental plan → predicted result of experiment -→ experiment → comparison of predicted and actual results
A normal distribution is shaped as:
Bell Curve
The standard normal distribution has a mean of “0” and a standard deviation of “1”
N=30
What is a confidence interval?
A range of values that is likely to include a population parameter with a certain degree of confidence.
sigma represents the
standard deviation
specifies the amount of dispersion around the mean
examples of measures of central tendency
mean, median, and mode = exactly the same in a normal distribution
z-score vs t test statistic
A z-test is used to test a Null Hypothesis if the population variance is known or if the sample size is larger than 30, for an unknown population variance.
A t-test is used when the sample size is less than 30 and the population variance is unknown.
Which of the following tests is the nonparametric equivalent of a one-sample t-test?
A) chi-square test
B) sign test
C) kruskal-wallis test
D) wilcoxon rank sum test
sign test
T/F The wilcoxon signed rank test is used for paired or dependent samples.
true
T/F When the test statistic falls into the critical region (beyond the critical value), we reject the null hypothesis.
true
Which of the following best describes the differences between a paired and unpaired t-test?
A) a paired t-test compares 2 unrelated groups, while an independent t-test compares the same group at different times
B) there is no difference between paired & independent t-tests
C) a paired t-test compares 2 related samples, while an independent t-test compares 2 unrelated groups
D) both paired & independent t-tests require samples to be unrelated
a paired t-test compares 2 related samples, while an independent t-test compares 2 unrelated groups
T/F Parametric tests, such as t-tests and ANOVA, assume that data come from a normally distributed population.
true
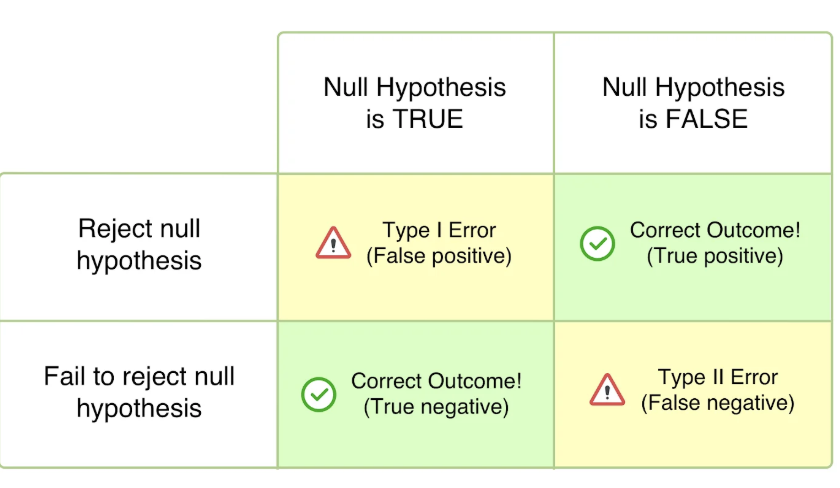
Question from Dr. May's "one really important slide"... If after a study, you conclude that there is no difference between 2 drugs but in reality there is a difference. What type of error have you made?
type II

Question from Dr. May's "one really important slide"... If after a study, you conclude that there is a difference between 2 drugs but in reality there is no difference. What type of error have you made?
Type I
A knowledge of biostatistics is needed for which of the following activities?
1. evaluating a new drug for formulary consideration
2. evaluating direct to consumer ads
Which of the following best distinguishes descriptive statistics from inferential statistics?
A) descriptive statistics involve sampling; inferential statistics use surveys
B) descriptive statistics summarizes data; inferential statistics draw conclusions from samples
C) descriptive statistics calculate margins of error; inferential statistics do not
D) descriptive statistics make predictions; inferential statistics summarize data
descriptive statistics summarizes data; inferential statistics draw conclusions from samples
T/F A variable refers to a characteristics of interest (such as age or BP), while the actual recorded values are called data.
true
Which of the following is a key difference between a survey & an experiment?
A) experiments rely only on interviews; surveys rely on lab results
B) experiments involve controlled conditions; surveys typically do not
C) surveys always produce more accurate results than experiments
D) surveys involve random assignment to treatment groups; experiments do not
experiments involve controlled conditions; surveys typically do not
According to the Central Limit Theorem, as sample size increases:
A) the sample becomes more skewed
B) the population mean increases
C) the population standard deviation decreases
D) the sampling distribution becomes more normal
the sampling distribution becomes more normal
3 multiple choice options
What is the shape of a normal distribution?
A) Symmetric and Bell-Shaped
B) Skewed to the left
C) Bimodal
D) Skewed to the right
symmetric & bell-shaped
Which of the following best describes a confidence interval (CI)?
A) a fixed range used for hypothesis testing
B) the interval where most of the sample values lie
C) a range that likely includes the population parameter with a specified confidence level
D) the range of values where a sample statistics is always found
Correlation and regression are two statistical techniques used to describe the relationship between 2 variables.
true
Which of the following best describes a positive correlation?
A) both variables remain constant
B) as one variable increases, the other decreases
C) there is no relationship between the variables
D) as one variable increases, the other increases
as one variable increases, the other increases
T/F A correlation coefficient (r) of 0 indicates no linear relationship between 2 variables.
true
Which of the following measurement scales has a true zero point?
A) interval
B) nominal
C) ratio
D) ordinal
ratio
T/F The median is the most appropriate measure of central tendency for data measured on ordinal scales.
true
Which measure of variability is calculated as the difference between the highest & lowest values in a data set?
A) standard deviation
B) range
C) coefficient of variation
D) variance
range
define a population
set of persons having a common observable characteristic
a sample:
a set of persons having a common observable characteristic
simple random sample
all members of the population have equal chance of selection
cluster sampling
divides the population area into groups or clusters, then randomly select the clusters that include ALL members from the selected clusters
stratified sampling
divides the population into non-overlapping subgroups, called strata, so that observations in each subgroup share similar characteristics, then sampling each sub group
systemic sampling
Selectsome starting point and then select every Kth element in the population
convenience sample
Relies on available information or persons to be included in the
sample, basically uses information that is easy to get
To say there is a difference between groups when in actuality, none exists (i.e., to reject the null hypothesis when in fact it is true)
Type I error
to say there is no difference between groups when in fact there is a difference (i.e., to accept the null hypothesis when it is false)
type II error
T/F Nonparametric tests, assume that there is normal distribution
False
T/F Parametric tests utilize interval/ratio data
True
purpose of anova
evaluate mean differences between 3 or more groups
Are all the group means equal, or is at least one different?
Advantage over t-test; can be used to compare 3 or more groups at the same time
assumptions of anova
Independence: Each observation is independent, or one participant belongs to only one group.
Normality: Data in each group are approximately normally distributed.
Homogeneity of variance: Groups have roughly equal variances.