wk 3 - measure of dispersion
1/7
There's no tags or description
Looks like no tags are added yet.
Name | Mastery | Learn | Test | Matching | Spaced | Call with Kai |
|---|
No analytics yet
Send a link to your students to track their progress
8 Terms
measures of dispersion
central tendency
range
the difference between the largest and the smallest observations
range = max - min
sample variance
quantifies the amount of variability or spread around the mean of the measurements
larger the sample variance = the more dispersed
sample variance defined as s²
→ assume that a sample of size n has been randomly drawn from a population, the sample mean is defined as:
xbar= mean
sample standard deviation (s)
calculated by taking the positive sqaure root
coefficient of variation
measure of relative variability - defined as the ratio of the standard deviation to the mean multiplied by 100%
unit free
examples question : sorted dataset
2,4,6,7,7
mean: 5.2
range: 5
variance:
Xbar = 5.2
SD:
COV:
inter-quartile range
quartiles divide ordered data into four equal part
boxplots - box and whisker plots
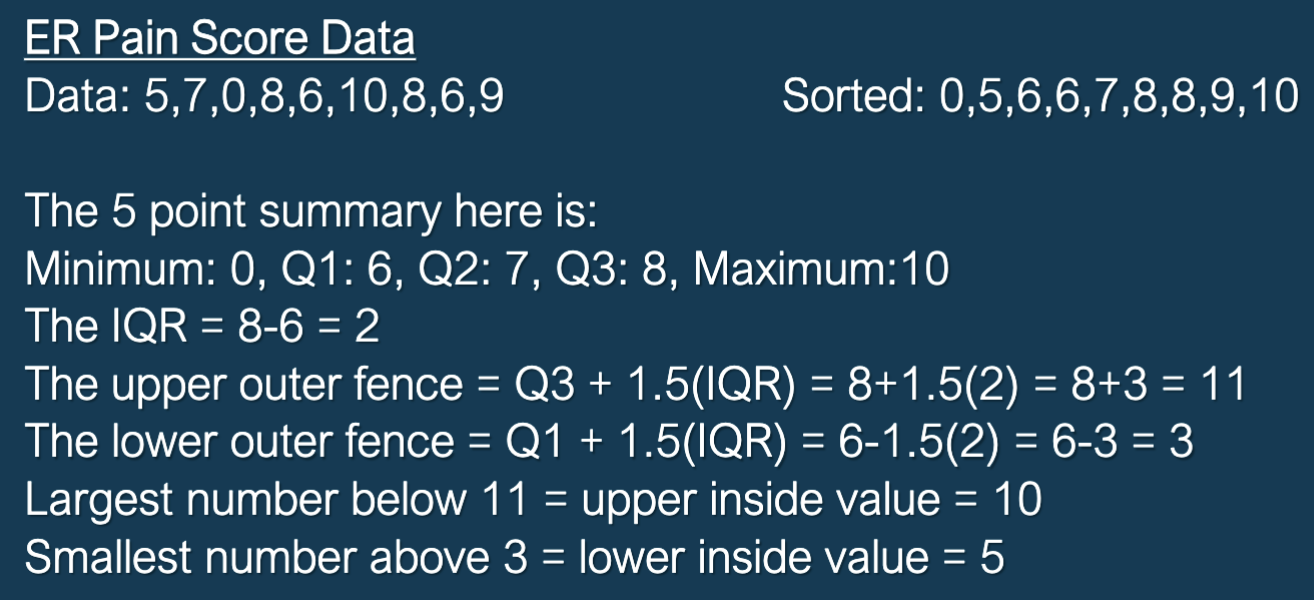
a useful way of visualizing IQR and outliers
To generate one, we must find:
the 5 point summary (min, Q1, Q2, Q3, max)
IQR
Upper inside values: the LARGEST value below the upper fence = upper inside value
→ to find upper outer fence Q3 +1.5(IQR)
Lower inside values: the smallest value ABOVE the lower fence = lower inside value
→ to find the lower outer fence” Q1 - 1.5 (IQR)
