LP2.13 - Functional Assays to Test your Hypothesis
1/15
There's no tags or description
Looks like no tags are added yet.
Name | Mastery | Learn | Test | Matching | Spaced | Call with Kai |
|---|
No analytics yet
Send a link to your students to track their progress
16 Terms
Provide an overview of the migration gap assay (purpose/description/analysis & common troubleshooting/data presentation)
Aim:
to detect whether KO U87MG cells have impaired migratory abilities relative to WT control via assessing their ability to move across a particular area in a defined time
Description:
- place silicon insert in tissue 2-well culture plate in TC hood
- seed cells in silicon wells
- once cells have adhered + reached confluence, add media + remove insert with sterile tweezers, creating a 500 microM gap - note U87MG intrinsically possess migratory/invasive phenotype + thus don't require stimulus to move
- image standardised section of gap(i.e same position + orientation - use reference points) at regular time intervals(0/3/6/24 hrs) - ensure 'gap' is centred in image; compare control WT vs KO samples
Analysis:
- convert images to black + white to increase contrast + add scale bar + save images in consistent format e.g JPEG
- open imageJ -> use freehand selection tool to draw outline around gap -> click analyse -> click measure -> provides area of gap measured in pixels; can then plot graph to show decrease in area over time in both WT + KO samples
Troubleshooting:
- before removing silicon insert, ensure cells have reached confluence as confluent cells have a restricted area for movement and will move only in the direction of the free area i.e gap/scratch:
- sub-confluent cells still have free space + will move more randomly in every direction + thus may not/partially close the gap over 24hr period
- over-confluent cells tend to grow on top of each other, forming spheric structures + may result in peeling off the entire cell monolayer when silicon insert is removed; additionally, cells can leak into gap if the silicon insert is not properly adherent to the well surface with migration occurring before t=0
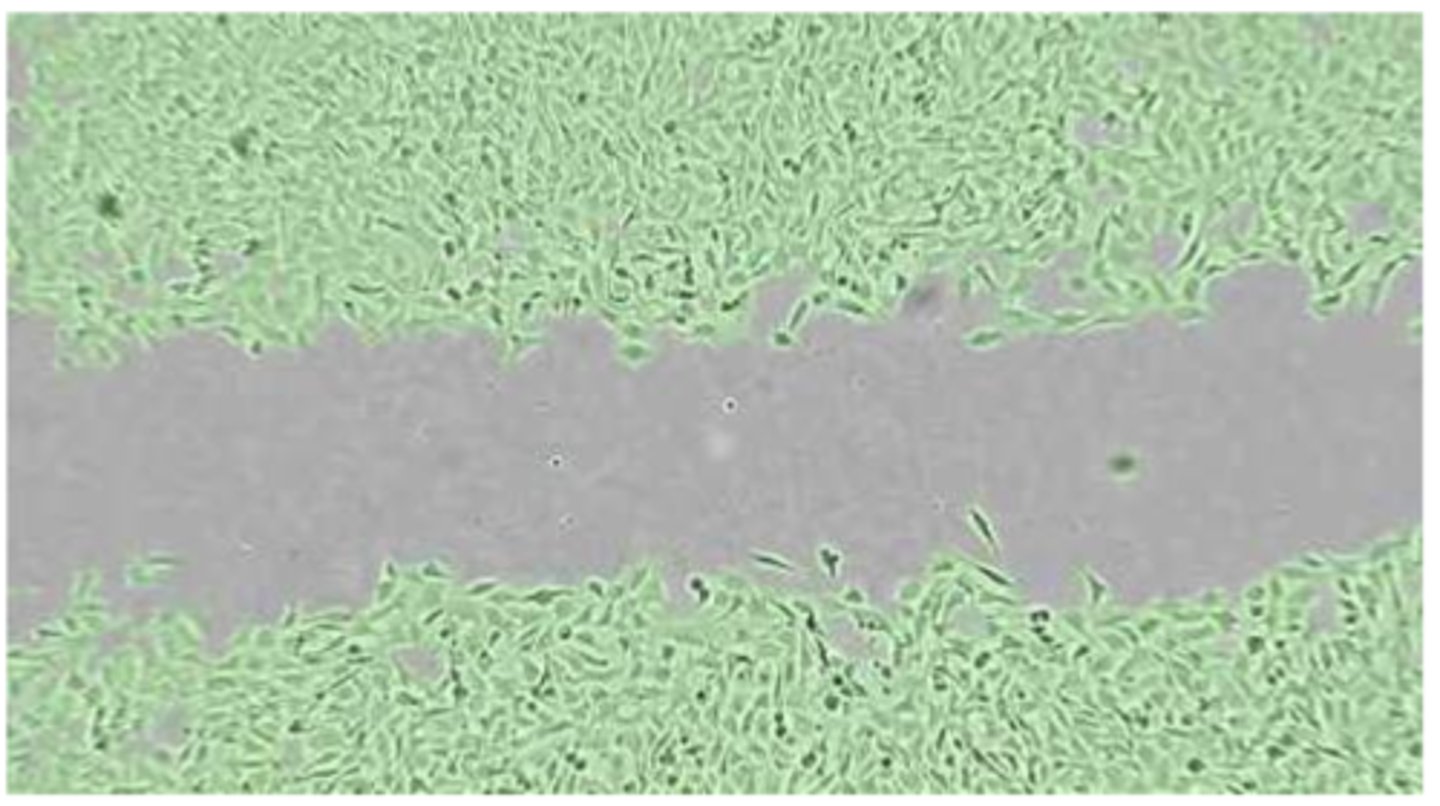
Provide an overview of the migration gap assay (purpose/description/analysis & common troubleshooting/data presentation) CONT
Troubleshooting CONT:
- also must ensure KO of chosen target does not affect cell proliferation as decreasing gap area over time should be due to cell migration; not simply a net increase in cells due to proliferation - if in doubt, can perform a proliferation assay alongside migration assay to provide evidence that cells are not proliferating in the time interval we are testing cell movement i.e proliferation may be a confounding variable
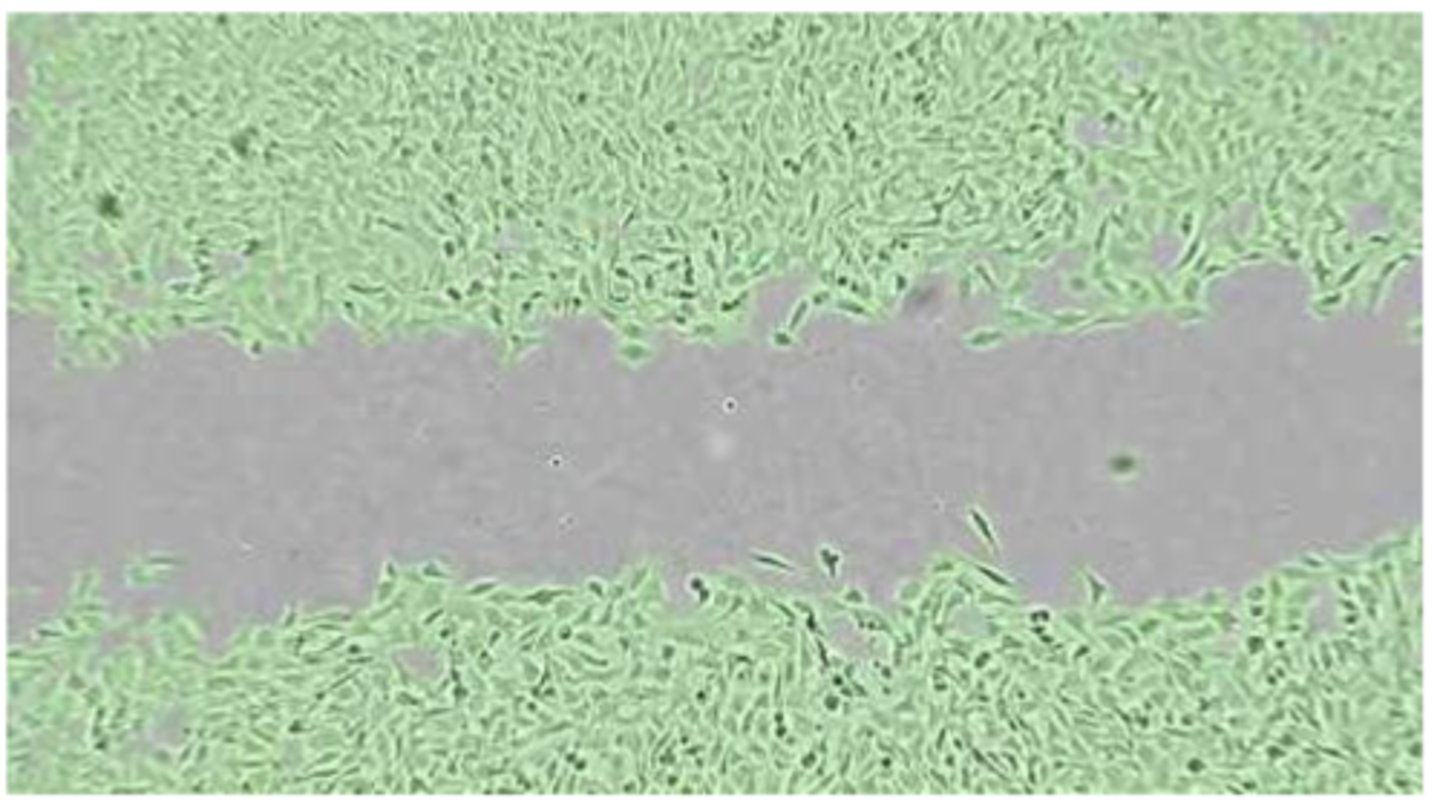
Provide an overview of the 3D spheroid invasion assay (purpose/description/ analysis & common troubleshooting/data presentation)
Aim:
to detect whether KO U87MG cells have impaired invasive abilities relative to WT control via assessing the ability of their spheroid form to invade ECM over a given time period
Description:
- Seed KO/WT U87MG cells in wells of ultra-low attachment plate(have special, non-charged hydrophilic coating which does not confer cell adherence, forcing cells to stay in suspension + naturally aggregate to form 3D tumour spheroid structure over ~5 days) - the 'U' bottom shape of the wells restricts spheroid size + shape, leading to little batch-to-batch variability - whilst 2D adherent, monolayer culture is ideal due to uniform O2 + nutrient exposure, 3D spheroid model better represents cell growth + associated dynamic O2/nutrient/metabolite gradients from outer proliferating zone to inner necrotic core
- once spheroids have formed, ~2/3 of media from each well is removed without disturbing spheroid + Matrigel added to embed spheroid - matrigel is derived from ECM in mouse sarcoma + designed to mimic in vivo 3D ECM environment + is rich in ECM proteins e.g aminin, collagen IV, entactin, fibronectin etc (exact composition varies across batches as ex vivo product)
- matrigel is then topped up with media in wells + plate placed incubator for matrix to solidify + cells in outer layer to begin invasion - cells imaged at regular time intervals over 72 hour period
Analysis:
- save images in consistent format e.g JPEG
- open imageJ + use freehand selection tool to draw around outer rim of invasion protrusions -> click analyse -> select measure - this gives you the pixel area of the total invasion area + original tumour spheroid area
- therefore to simply calculate the invasion area, repeat the steps above but draw around the spheroid core to give the area of the initial spheroid, as may have grown/shrunk over time
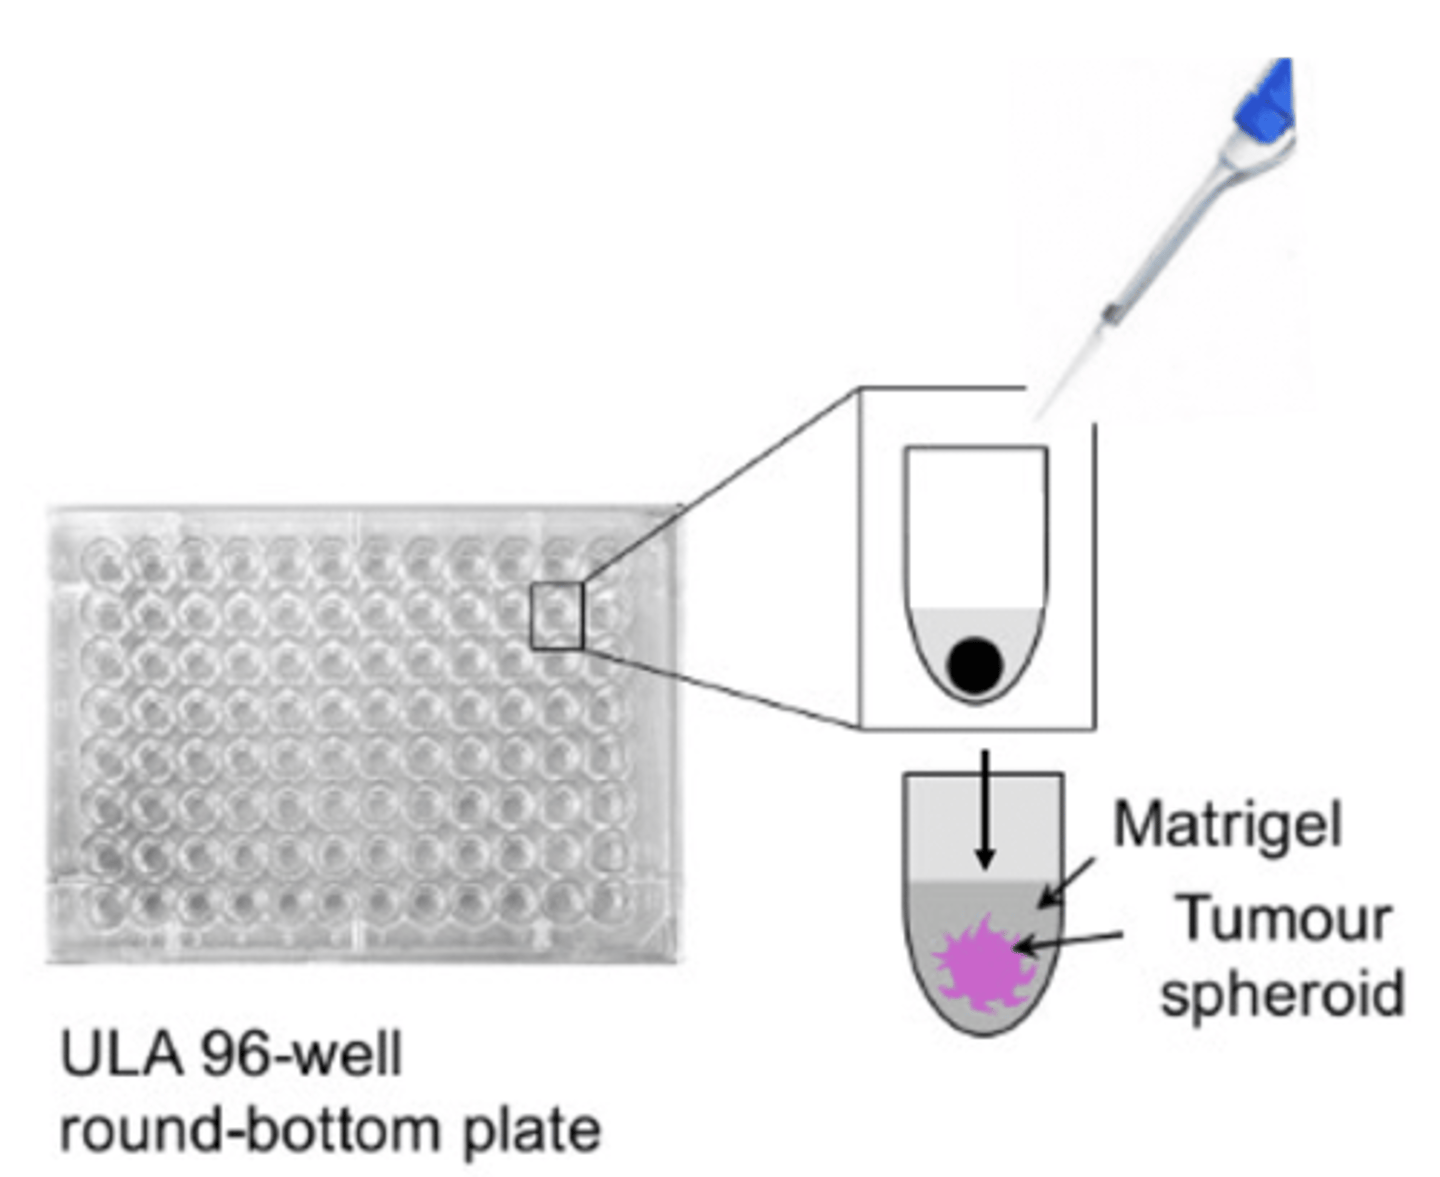
Provide an overview of the 3D spheroid invasion assay (purpose/description/ analysis & common troubleshooting/data presentation) - CONT
Analysis CONT:
- then calculate invasion area = total area - core area
- increase in invasion area across the various timepoints can then be plotted on a graph and compared for WT vs KO along with some representative images of the invasion
- additionally, single cells which have detached + invaded further into the matrix, beyond the main invasion area, can be quantified in WT vs KO and used as complementary data to the invasion area
Troubleshooting:
- Matrigel handling - matrigel is a hydrogel which is: stored between -70 and -20 deg; is liquid at 4 deg; and solidifies at temp>10 deg - therefore it must be properly stored + thawed on ice for a few hours on day of experiment; also sterile pipetting tips for dispensing matrigel should be kept at -20 deg to prevent it solidifying in the tip; therefore: temperature(low temp fundamental for maintaining liquid form when handling); time(once outside ice bucket, matrigel vial quickly warms up so must rapidly aliquot in wells); and accurate pipetting(to avoid inflating air which could form bubbles which become trapped in the matrix) are all important aspects
- Removing media - once spheroids have formed after ~5 days + are visible to naked eye(stand plate at right angle until you can see spheroid), before adding matrigel, ~2/3 media must be removed from each well to prevent matrix being too diluted/loose - to avoid disturbing spheroid, remove media in several steps by pointing pipette tip against side of wells rather than towards spheroid - also, as a contingency, when seeding, plate spheroids in triplicates, so you have repeats, in case a spheroid is lost
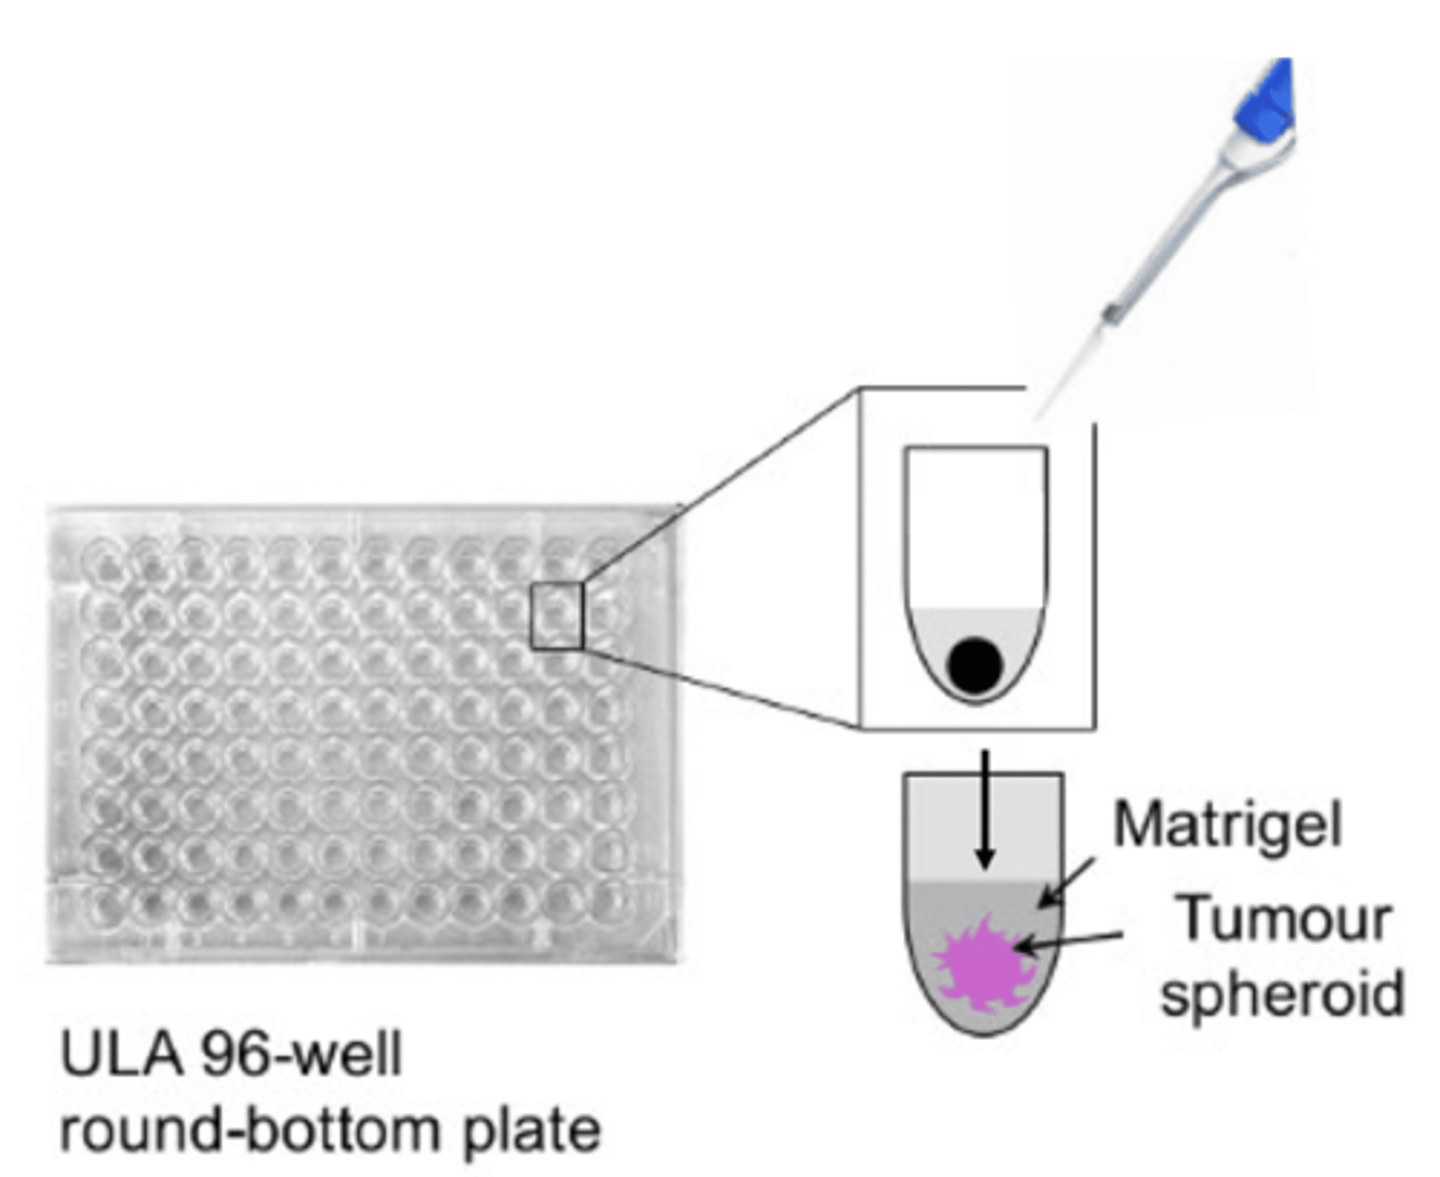
Provide an overview of the actin cytoskeleton + focal adhesion complex immunofluorescence assay(purpose/background/description/analysis & common troubleshooting/data presentation)
Aim:
to investigate how actin stress fibre cytoskeleton dynamics + focal adhesion complex formation is affected in KO U87MG cells relative to WT control via immunofluorescence staining of actin filaments/stress fibres, vinculin(a scaffold protein in focal adhesion complexes) + DAPI(to stain nuclei to distinguish distinct cells) after providing stimulus for cells to undergo directional migration via gap/scratch assay + subsequently fixing them
Background:
- fluorescence is a type of light emitted by (in)/organic molecules upon excitation of a cyclic or aromatic structure by radiation of higher energy
- organic molecules which emit fluorescence are caked fluorophores or fluorochromes
- when energy e.g light, interacts with fluorophore cyclic structure (absorption), electrons(e-) in pi bonds elevate to higher energy state(excitation) - excited electrons are unstable + soon return to ground state within a small fraction of a second, releasing energy in the form of light(emission)
- part of the initial energy absorbed by e- is dissipated + thus light emitted by e- during return to ground state is of lower energy + thus a higher wavelength i.e Stokes' Law of Fluorescence - 'the wavelength of the emitted fluorescent light (λem) is greater than that of the light exciting the fluorescence (λex)'
- the different absorption/emission spectra are within the wavelength range of visible light + can thus be visualised with colour e.g DAPI fluorophore absorbs in purple region but emits in blue wavelength region, hence nuclei appear blue
- the relative peaks/maximums of the absorption/emission spectra, correspond to the specific wavelength at which most of the fluorophores are excited or emitting fluorescence respectively
Provide an overview of the actin cytoskeleton + focal adhesion complex immunofluorescence assay(purpose/background/description/analysis & common troubleshooting/data presentation) CONT
Background CONT:
- a fluorescence microscope has many components to measure the above:
- polychromatic white light source which is filtered to monochromatic light of correct excitatory wavelength which is then perpendicularly reflected by dichromatic mirror to focus on fluorophore-containing sample/specimen
- sample then emits light which is filtered at the correct wavelength + imaged
- If fluorophores have an affinity for a specific molecule, they can be used directly to tag said molecule and emit fluorescence when examined under a fluorescent microscope -in LP2, we will use the DAPI fluorophore as it has high affinity for adenine-thymine-rich regions of DNA + emits blue fluorescence; we will also use phalloidin, a toxin derived from fungus with strong affinity to F-actin, preventing its depolarisation - we will directly conjugate it to fluorophore 'Alexa Fluor-488' which emits green fluorescence when excited at 488nm i.e phalloidin-488
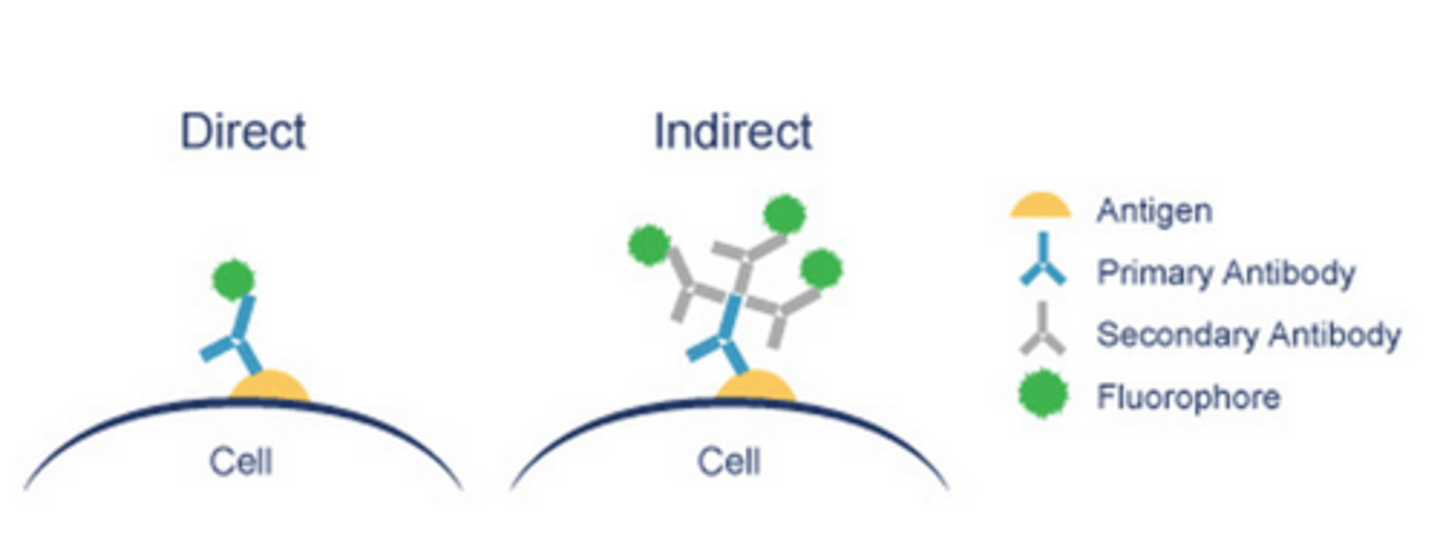
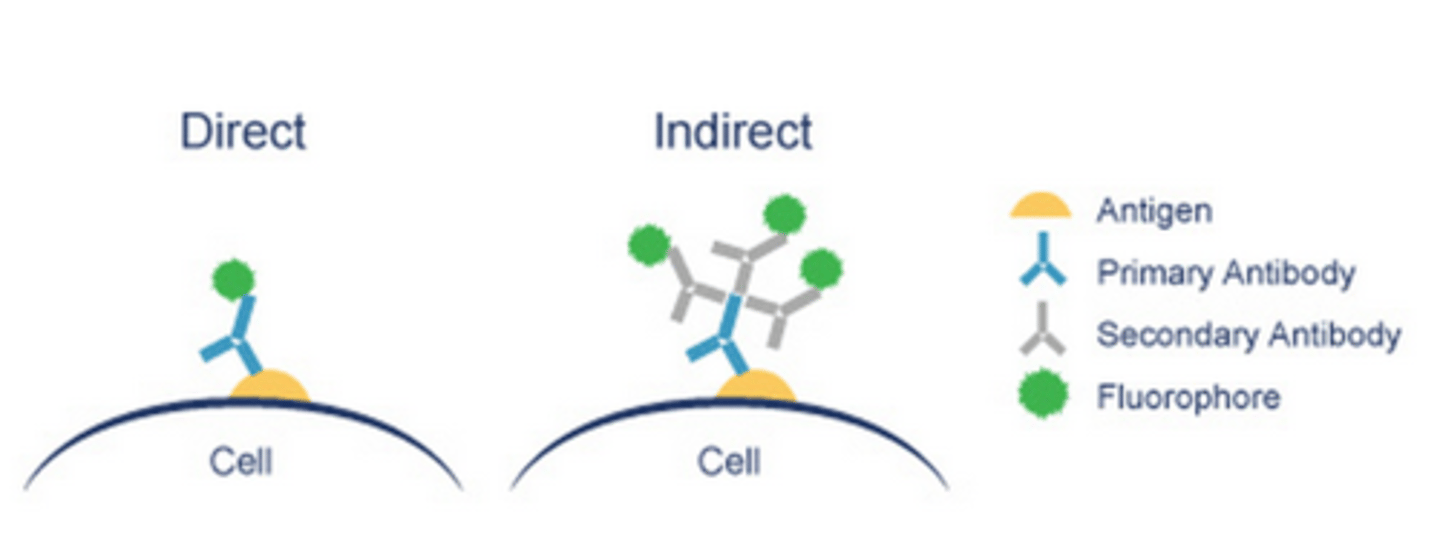
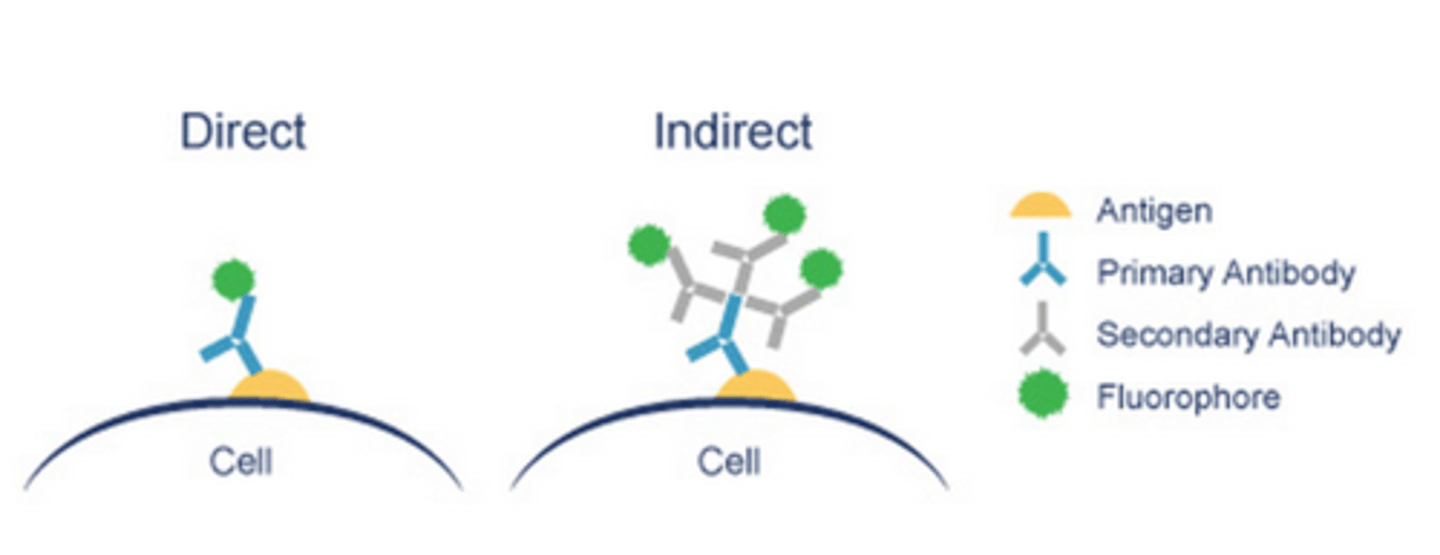
- if a fluorophore does not have high affinity for our chosen target, 'immuno'-fluorescence is used i.e covalently attaching fluorophore to constant region/Fc of an antibody, specific to our target - this can be:
- Direct i.e primary antibody labelled with fluorophore
- Indirect i.e primary antibody is detected by a secondary antibody, labelled with a fluorophore - in LP2, to detect vinculin, we will use primary antibody which is complementary to secondary antibody, which is conjugated with either 'Alexa Fluor 555/666', which emits orange or red light respectively
- ideally, with so many simultaneous targets, we would want fluorophores with distinct, non-overlapping absorption/emission spectra, to confidently identify each target - but this isn't always possible e.g DAPI partially overlaps with Alexa Fluor 488, leading to bluish-green tinge - thus important to be aware of
Provide an overview of the actin cytoskeleton + focal adhesion complex immunofluorescence assay(purpose/background/description/analysis & common troubleshooting/data presentation) CONT 1
Background CONT:
- Generally, antibodies have a superior affinity + specificity for their targets than dyes such as DAPI
- the antibody chosen can be polyclonal i.e binding multiple antigens/epitopes on target OR monoclonal ie binding single epitope - there are pros/cons for both:
- polyclonal:
- good as binding to multiple epitopes amplifies signal, allowing detection of target with low expression; also tolerates minor changes in buffer composition + pH & protein denaturation, which can affect protein conformation + therefore epitope presentation
- bad as batch-to-batch variation + potential cross reactivity with other targets
- monoclonal:
- good as very specific with low batch-to-batch variation
- bad as sensitive to buffer/pH change + loss of epitope due to protein denaturation
- detection of simultaneous fluorophores also provides info about potential colocalisation of targets, indicated by colour addition i.e when 2 overlapping fluorophores merge into a new colour - we might expect this for actin + vinculin since they are closely situated
- some organic molecules present in biological samples e.g collagen, elastin, NADPH, vitamin D etc, can also emit fluorescence if excited with the correct wavelength - if this overlaps with the excitatory wavelengths of our fluorophores, it can lead to 'autofluoresence', which can create 'background noise', rendering analysis difficult; use of appropriate filters can minimise this
Description:
- as microscopy is used for analysis, cells must be seeded on glass slide supports, mounted with a removable 8-well template
- once cells have reached confluence, to induce directional movement, a sterile pipette tip is used to create a scratch/gap in the monolayer
Provide an overview of the actin cytoskeleton + focal adhesion complex immunofluorescence assay(purpose/background/description/ & common troubleshooting/data presentation) CONT 2
Description CONT:
- place cells in incubator for 2 hours to allow migration to begin to seal the gap(can see migration front under microscope)
- Fix cells using 4% paraformaldehyde(PFA) in PBS which works via forming covalent bonds between adjacent molecules i.e cross-linking- this provides a snapshot of our cells during migration
- for our indirect immunofluorescence detection of vinculin, cells are blocked using BSA to avoid antibody binding non-specific targets - additionally as vinculin is an intracellular target, plasma membranes must first be permeabilised using a mild detergent, to allow entry of large antibody into the cell
- incubated with vinculin primary antibody for 1-48 hrs; then washed with PBS to remove unbound antibody + incubated with secondary antibody, conjugated with fluorophore, for 1 hr
- whilst, adding secondary antibody, the direct fluorophore, phalloidin-488, can also be added to detect actin
- cells washed multiple times with PBS to remove unbound antibody + also final wash with double-distilled water(ddH2O) to dissolve any residual salt in PBS, which could form crystals + emit fluorescence, interfering with imaging
- finally, we use mounting medium with dissolved DAPI fluorophore i.e 'Pro-Long gold with DAPI', to simultaneously facilitate nuclei staining + sticking the glass slide to the coverslip for protection during analysis + long-term preservation - the mounting media hardens overnight at room temp + an anti-fade reagent quenches non-specific autofluorescence from the mounting medium
Troubleshooting:
- Fluorophores exposed to light for a long period can become damaged + lose ability to emit fluorescence i.e photobleaching - thus should cover samples with foil during secondary antibody + fluorophore incubation
Provide an overview of the actin cytoskeleton + focal adhesion complex immunofluorescence assay(purpose/background/description/ & common troubleshooting/data presentation) CONT 3
Troubleshooting CONT:
- Note secondary antibody should only bind to the primary antibody and not structures in the cells - thus may want to include a secondary antibody-only control without primary antibody, to verify its specificity - if this emits fluorescence, a different secondary antibody should be used
Data Presentation:
- for each field of view, save an image for: transmitted light view, fluorescent channels + overlay, onto USB stick - can make small adjustments e.g brightness, contrast etc to raw image, ideally during acquisition on the microscope, but can also edit after
- import images to powerpoint + resize to appropriate size
- include control images at top of panel, followed by test samples - ensure images chosen are representative of single or multiple experiments conducted
- can show an image of several cells + then zoom into 1 particular cell in more detail - signpost this with arrow + explain in figure legend
- include a scale bar + include the numerical value on the scale bar or in figure legend
- ensure to label corresponding cell line on the rows e.g U87MG WT or KO + then probed target or merged target overlay for colocalisation, in the columns
- write a figure legend - include name of microscope instrument used to collect + analyse data i.e epifluorescent microscope Axiovert-5 from Zeiss, + any abbreviations, scales, arrows, error bars etc
- if enough independent experiments conducted (i.e n>=3), can conduct statistical analysis, quantifying the detected target fluorescence per cell
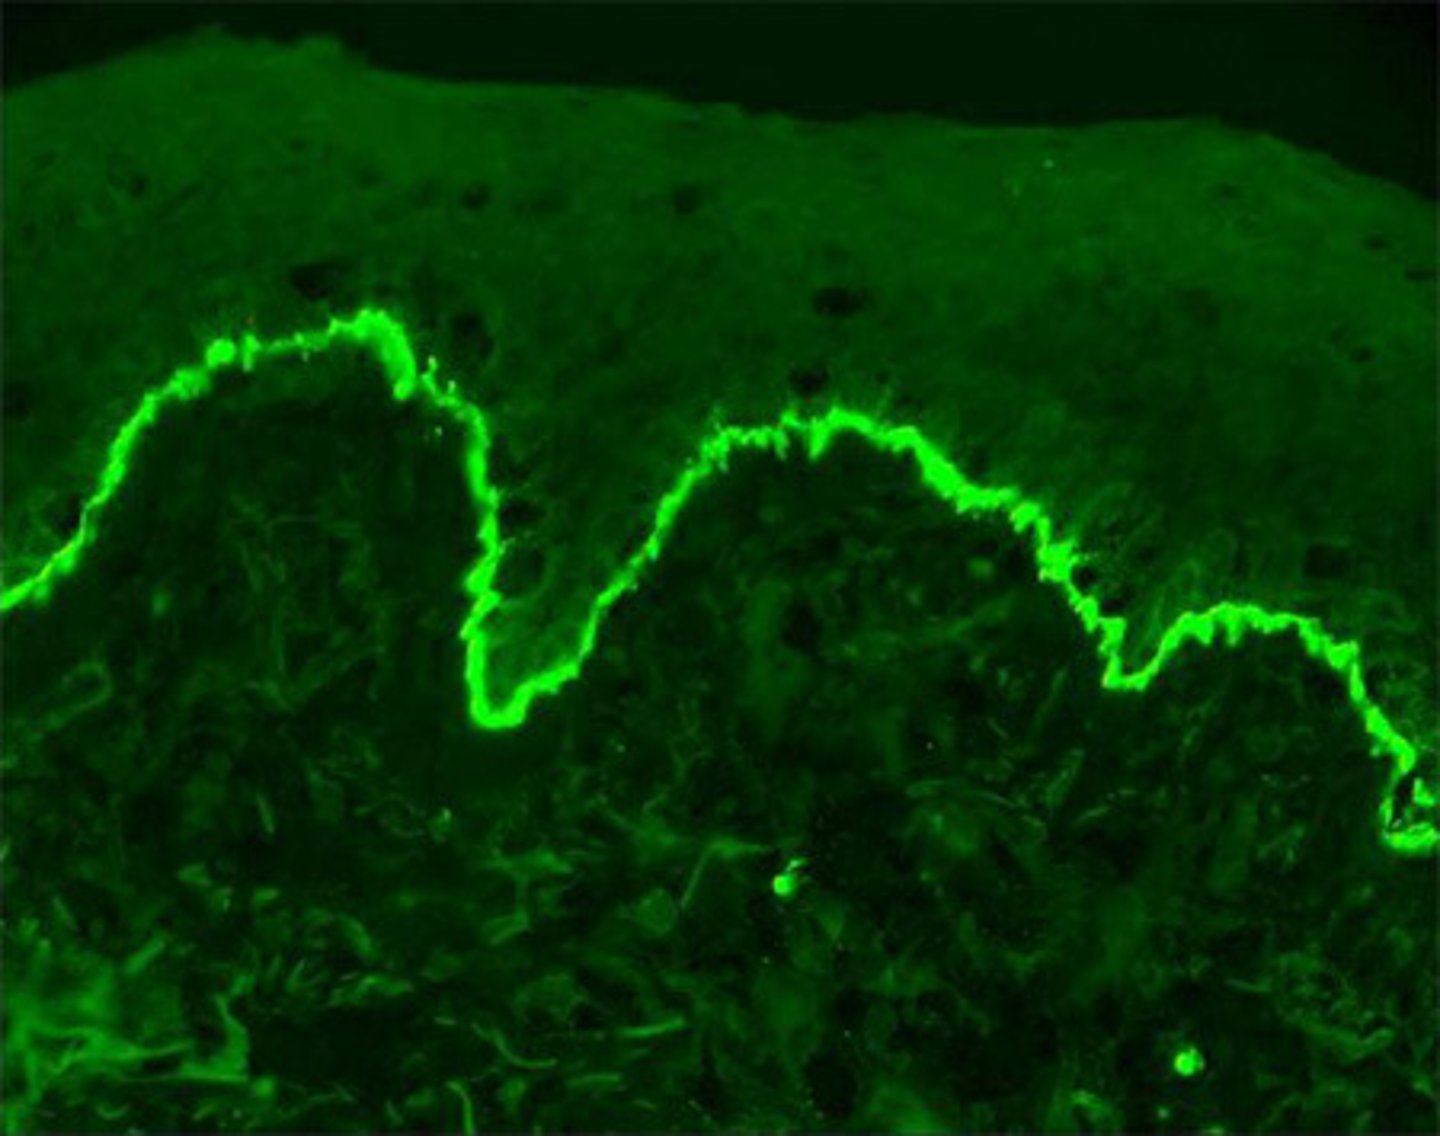
Provide an overview of the self-renewal colony formation/clonogenic assay(purpose/description/analysis & troubleshooting)
Aim:
Does KO of target diminish stem-cell like properties of U87MG + thus their ability to survive, proliferate + undergo unlimited cell division, via observing whether colony formation is impaired in KO - note only small proportion of cancer cell population will have self-renewal ability + majority of cells should die or not be able to proliferate + form colonies, after a few cell divisions
Description:
- Counting, diluting + seeding 2000-5000 cells per well - too many cells will form a confluent layer, not allowing individual cells to form colonies - cell number plated should be same in WT vs KO + technical triplicates should be performed to increase reliability
- Incubate plate between to allow formation of colonies - U87MG forms colonies in 10-15 days but aren't neat/bold - cells should be regularly monitored during this period with media changed + plates discarded if contaminated
- once colonies are visible, wells are fixed in 4% paraformaldehyde fixative which forms cross-links between adjacent molecules, providing a 'snapshot' of the colonies + also stained in crystal violet to ensure all colonies are visible
Analysis:
- image each well using IBright + observe difference in colony number(average technical replicates for each condition), size + shape in WT vs KO - note plates should have undergone exact same length of incubation to ensure colonies are comparable
- Plot colony number in a graph + present it along with a representative image of the relevant clonogenic assay
- Should ideally expect less colony formation in KO
Troubleshooting:
- accurate counting, diluting + seeding of cells is crucial to ensure equal cells plated per well e.g if more cells plated in 1 well, it could increase likelihood that the subpopulation of stem-like cells within it will be bigger and likely form more colonies
Provide an overview of the stem cell AldeRed 588 assay by flow cytometry assay(purpose/background on AldeRed Assay + Flow Cytometry/description/analysis/data presentation)
Aim:
To assess whether KO of target diminishes stem-cell like properties of U87MG via observing difference in frequency of stem cell markers in WT vs KO cells, using flow cytometry(FC)
Background - AldeRed Assay:
- only small proportion of total cancer cell population will express stem cells markers but important as these cells have great metastatic potential
- a key stem cell marker is enzyme aldehyde dehydrogenase (ALDH), which oxidises aldehydes + detoxifies ROS + has a speculative detoxifying role in maintaining stemness
- to assess ALDH activity in U87MG, we use Alde-Red which is an ALDH substrate, tagged with fluorophore BODIPY-588A for detection + can diffuse in&out of cells - once oxidised to corresponding carboxylate by ALDH, it becomes -vely charged + thus can no longer diffuse out of cell, becoming 'trapped', providing an indication of ALDH activity; note HCl must be present to activate AldeRed 588 reagent for reaction to occur
- a -ve control is also included, containing Alde-Red-588A but also a competitor, DEAB, which binds ALDH, preventing AldeRed from binding - provides baseline fluorescence emitted by unbound AldeRed-588A, which freely flows in/out of cells
- FC then measures fluorescence in WT vs KO + associated -ve controls
Background - Flow Cytometry(FC):
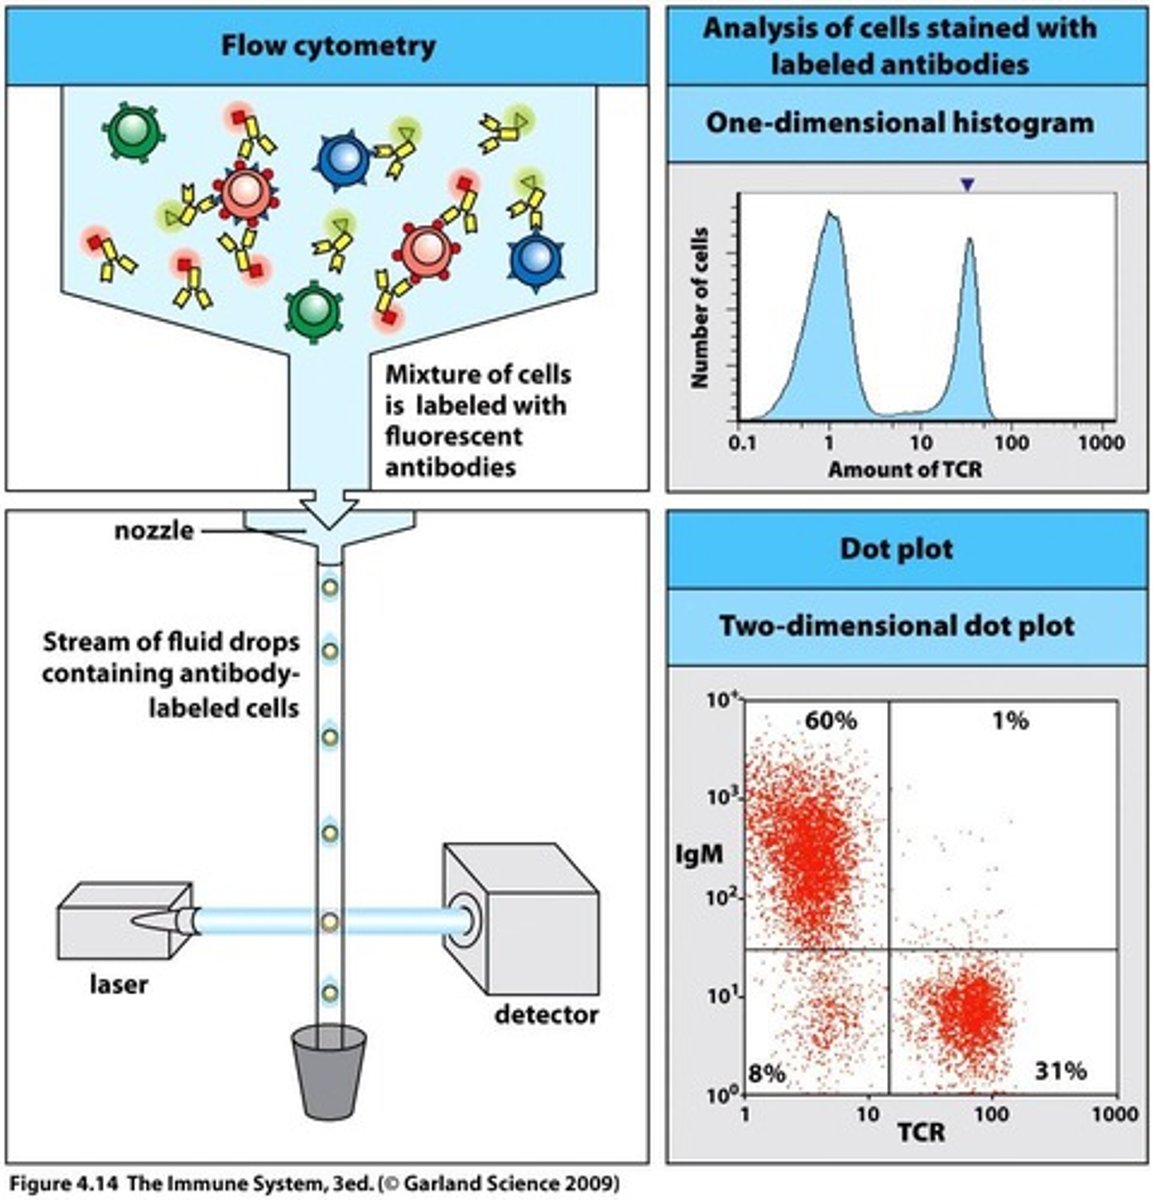
- conducts multi-parametric analysis on single cells within suspension i.e physical characteristics e.g cell count, cell size, granularity, cell surface marker expressions, intracellular proteins etc
- machine consists of:
- fluidics suck up sample into FC in single-file fashion via hydrodynamics + mix with saline solution - note sample injection port should probe should always be immersed in double distilled H2O to avoid drying out
Provide an overview of the stem cell AldeRed 588 assay by flow cytometry assay(purpose/background on AldeRed Assay + Flow Cytometry/description/analysis/data presentation) CONT 1
FC Background CONT:
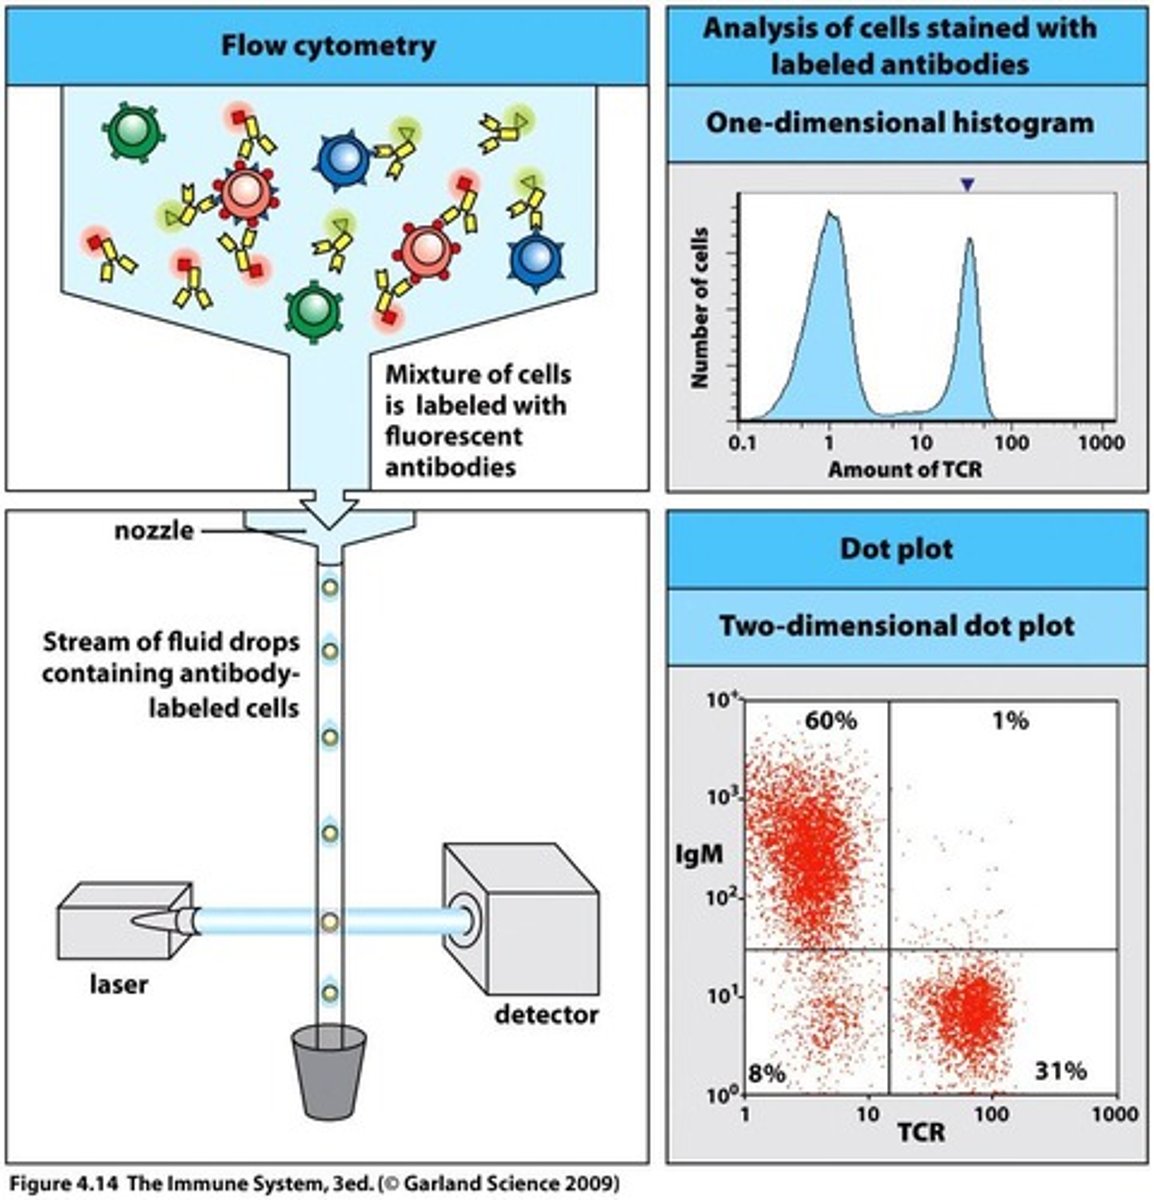
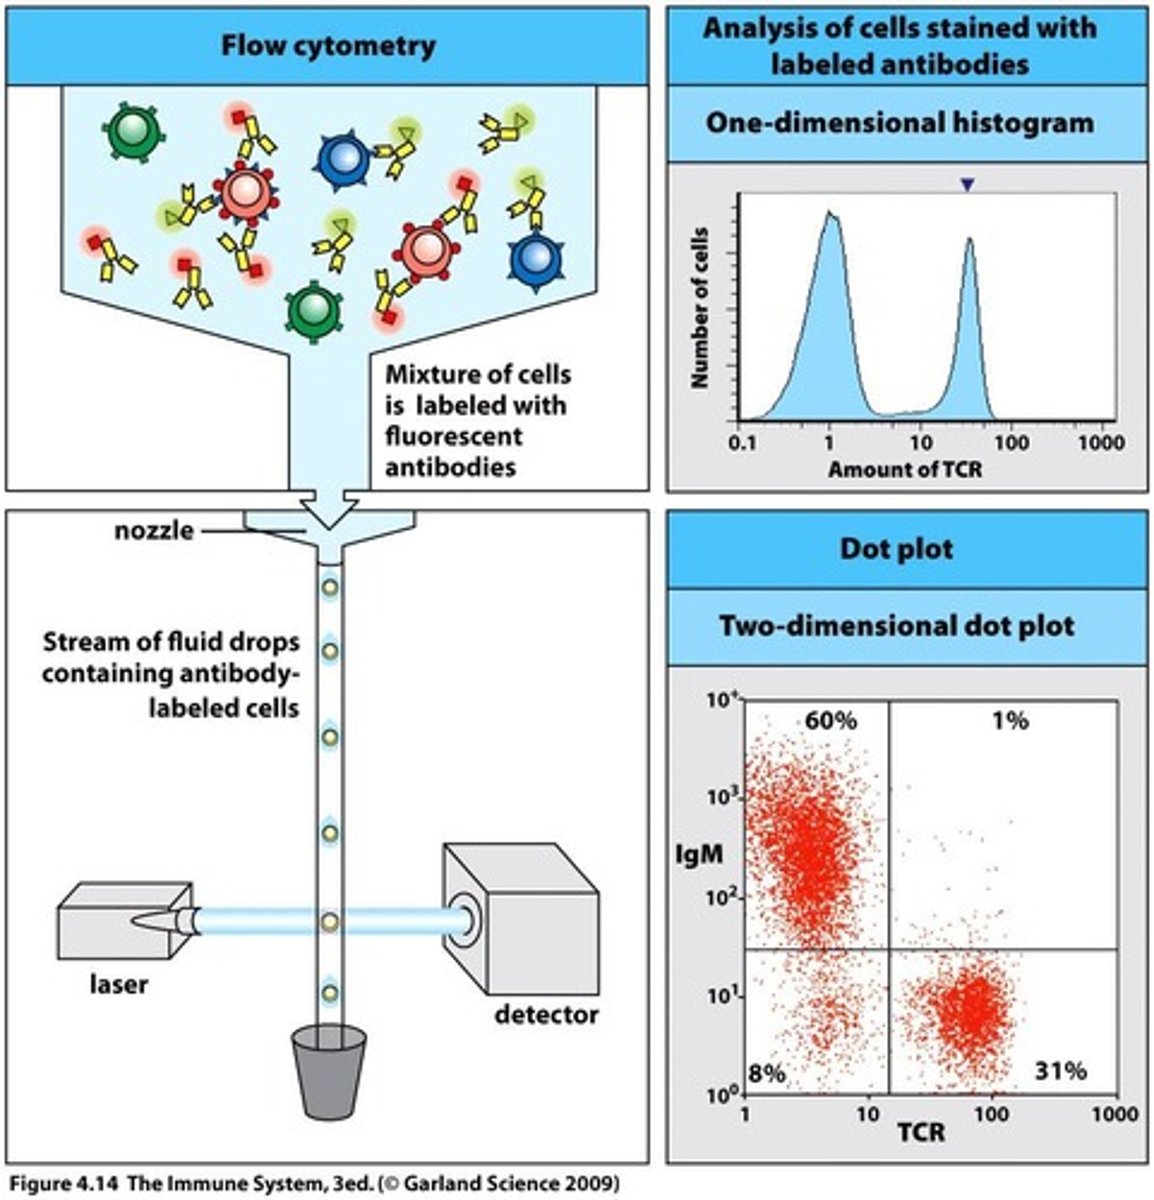
- each cell reaches interrogation point, in which they're exposed to laser beam - resultant light scatters in multiple directions + is measured by forward scatter(FS) detector in which signal intensity/voltage pulse is proportional to cell size; + perpendicular side scatter detector(SS) i.e signal intensity/voltage pulse is proportional to interval cell complexity/granularity/shape
- computer then converts this data into a histogram format or dot plot
In this way, a heterogeneous population of cells can be grouped into sub-groups
- in addition to FS/SS, presence + abundance of specific molecules can be determined through labelling antibodies with fluorophores or use of direct fluorescent dyes/stains - excitation at appropriate wavelength by the laser beam, causes fluorophore to emit light which can be measured by detectors + quantified as a histogram or dot plot - multiple fluorophores can be simultaneously detected (but take care to avoid excessive overlap of emission spectra)
- when preparing sample, in addition to untreated DEAB control, you should have unstained control to: derive clear FS/SC plots in absence of fluorescence; determine sample background noise/autofluorescence; distinguish live from dead cell/debris to exclude autofluorescence + non-specific antibody binding, which can lead to false positives
- in LP2, we use the Flow cytometer-BD Accuri™ C6 Plus, which has 2 lasers, 2 light scatter detectors + 4 fluorescence detectors
See emodule for FC machine structure image + software guidance
Description:
- do pre-checks: ensure fluidics bottle not empty; waste bottle not full + sample injection port(SIP) in ddH2O - then, start machine + open software
- Prepare samples via vortexing + load sample tube on SIP sample stage - always load unstained sample first
Provide an overview of the stem cell AldeRed 588 assay by flow cytometry assay(purpose/background on AldeRed Assay + Flow Cytometry/description/analysis/data presentation) CONT 2
Description CONT:
- load single stain Alde-Red sample with DEAB +/- for WT/KO
- save file data + perform 'SIP' clean function, using FACS cleaning solution
Analysis:
- several data plots generated:
- initial FSC/SSC plot allows you to 'gate/group' cell population of interest from total cells, some of which may be dead or debris(found on bottom left of dot plot as have low FSC/SSC parameters) - these can be excluded from further analysis
- using same data from unstained control, further gating of 'single cells' is conducted to remove doublet cells i.e 2+ cells clumped together - doublets have double the area + width of a single cell but approx the same height as a single cell - therefore, a
forward scatter height (FSC-H) vs forward scatter area (FSC-A) doublet exclusion plot can be used to exclude false positives, as a doublet of a fluorescence positive (+) + fluorescence negative (-) cell will produce the same fluorescence as a single positive cell, leading to a fluorescence-negative cell being included in the analysis - to initially minimise clumping during sample preparation, cells are passed through a blue mesh cap, which forces clumped cells to dissociate + vortexing the samples before loading on the SIP can also help reduce cell clumping
Note all gates are pre-set on FC, so don't need to be created
Provide an overview of the stem cell AldeRed 588 assay by flow cytometry assay(purpose/background on AldeRed Assay + Flow Cytometry/description/analysis/data presentation) CONT 3
Analysis CONT:
- once you have accurately distinguished the cell population of interest from the overall sample population, the single stain Alde-Red sample can be run, producing a 'SSC vs AldeRed-588A' dot plot - this indicates expression of target markers + % of ALDH+ cells in sample + thus provides an indication into the relative 'stemness' activity of cells in WT vs KO i.e you would expect lower proportion of ALDH+ cells in KO vs WT - the DEAB inhibitor -ve control also is run to cancel any background fluorophore fluorescence; in experiments using multiple fluorophore, a single-stain sample in run to determine the level of spectral overlap between the diff fluorophores + thus calculate compensation values
- FC can produce histograms for univariate, single-parameter data e.g relative fluorescence on the x-axis and the number of events (cell count) on the y-axis - overlay of histograms allow the visualisation of events that occur across different experimental groups e.g Alde-Red+ in WT vs KO
- For presenting bivariate, bi-parameter data, FC can produce multiple plots :
- density plots - displays 2 parameters + provides info about quantity + fluorescence intensity + also shows distribution of target cells within overall population
- Contour plots - display relative frequency of data; event densities are depicted with contour lines, with closely placed contour lines indicating a high concentration of events
- Pseudocolour plots - displays respective densities of events using different colours - a smoothed plot displays these colours in a heat map style using a rainbow colour spectrum with red and blue/green indicating high + low density events respectively
- Dot plots - each cell represented as a dot - used for moderate or low-frequency populations + helps with accurate gating of cells
Provide an overview of the stem cell AldeRed 588 assay by flow cytometry assay(purpose/background on AldeRed Assay + Flow Cytometry/description/analysis/data presentation) CONT 4
Analysis CONT:
- Zebra plots - a hybrid contour + density plot
Note gating strategy plots(usually from untreated, -ve control) should always be included alongside sample plots as well as explanation- for example: FSC/SSC gate to exclude debris + dead cells based on morphology; followed by doublet gating based on FSC-SSC height/width plots; followed by viability gate to remove dying cells which fluoresce in DAPI channel; followed by gating of previous parameters in stained sample plots
Data Presentation:
- export appropriate plot format from FC into powerpoint - in LP2, dot or pseudocolor plots are best + most common for visualising bivariate data
- Crop+resize images
- Label each plot with corresponding test sample or control; re-label/size axes titles appropriately with marker i.e fluorophore + channel i.e target, if required; display % of cells within relevant gates for reference - dot plot + corresponding histogram should be placed next to each other
- write a figure legend: heading; method i.e FC + LP2 analysis software; results - key finding; definitions/key/descriptions e.g error bars, symbols, scales, abbreviations etc; include type of statistical analysis conducted e.g 1-way ANOVA with post-hoc Tukey test + p-values/asterisks key
- to avoid showing multiple FC/histogram plots for all samples across many experiments, it is easier to combine final readout e.g % of Alde-Red+ cells, in a bar graph - remember to include axis titles/units; key e.g different colours; error bars to represent biological variation between independent experiments or technical variation within one biological replicate e.g standard deviation or standard error of mean(include in fig legend); statistical analysis using brackets and '*' or 'ns' +respective p-values
Multi-panel data of representative dot plots + bar graphs can be shown
F2F Extras