2.1.1 Economic growth
1/41
There's no tags or description
Looks like no tags are added yet.
Name | Mastery | Learn | Test | Matching | Spaced | Call with Kai |
|---|
No analytics yet
Send a link to your students to track their progress
42 Terms
Here are the spec points
What is economic growth?
refers to the increase in a country’s real GDP over time.
it signifies an expansion of an economy’s production capacity and is a key indicator of its overall economic health.
How is economic growth usually measured? what is the formula?
By calculating the percentage change in real GDP over a specific period of time, such as a year.
It can also be shown through the shift of a PPF
What is the formula for growth rate?
Growth rate = [(GDP at Time 2 - GDP at time 1)/GDP at time 1] x 100
What Gross Domestic Product?
the standard measure of output, which allows us to compare countries.
It is the total value of finished goods and services produced in a country within a year.
What is GDP an indicator of?
standard of living in a country
What is the difference between total GDP and GDP per capita?
Total GDP represents the overall GDP for the country whilst the GDP per capital is the total GDP divided by the number of people in the country
What is Real values?
Real GDP is the measure of economic growth adjusted for inflation and reflects changes in the quantity of goods and services produced
so real GDP ignore the effect of inflation
What are nominal values?
Nominal values do not adjust for inflation and represent current market prices.
Compare real and nominal values
real values are adjusted for inflation and reflect changes in quantity of goods and services produced whereas nominal values do not adjust for inflation and represent current market prices
Describe the difference between Real and Nominal using volume and
real values can be described as the volume of national income i.e the size of the basket of goods, whilst nominal values represents the value of national income i.e. the monetary cost of this basket of goods.
Define value (in oppose to volume)
value represents the monetary worth of goods and services produced
Define volume (in oppose to value)
volume measures the physical quantity of goods and services produced, disregarding the monetary value.
What is the difference between value and volume?
Value represents the monetary worth of good and services produced. Whereas volume represents the physical quantity of goods and services produced, disregarding their monetary value
What is the equation which relates the value and volume?
Value = volume x current price
What is the difference between total and per capita?
total values represent the aggregate sum of a variable for a given population or area. Whereas per capita values represents the average amount per person and are calculated by dividing the total by the number of the population.
define the value of national income
it is the monetary value at the prices of the day
define the volume of national income
the volume of national income adjusted for inflation and is expressed either as an index number or in money terms.
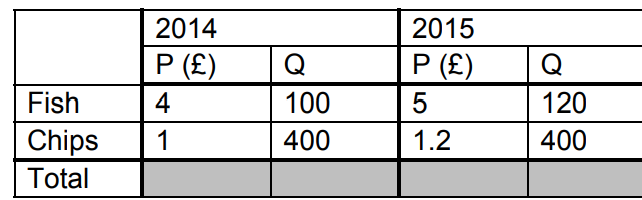
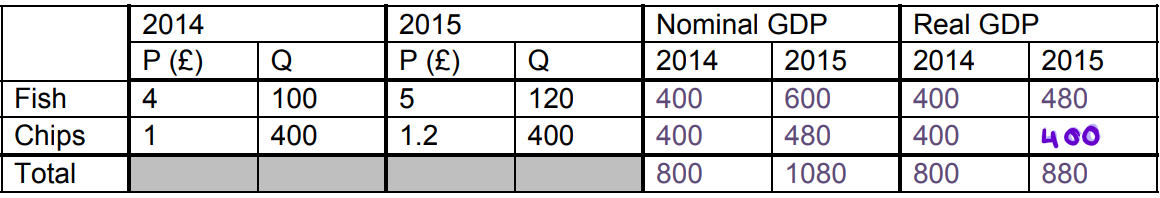
Example question:
Using 2014 as a base year for prices, work out nominal and real GDP:
value of national income = volume x current price level
Nominal GDP = price x quantity for each year:
Nominal GDP for fish
for 2014 = 4 × 100 = 400
for 2015 = 5×120 = 600
Nominal GDP for chips
for 2014= 1 × 400= 400
for 2015= 5 × 120= 600
Real GDP = quantity x price
Real GDP for fish
for 2014 = 4 × 100= 400
for 2015 = 4 × 120= 480 (real fish in 2015 - so ignores inflation therefore price stays at £4 when calculating)
Real GDP for chips
for 2014= 1 × 400= 400
for 2015= 1 × 400 = 400
Give 2 other national income measures
Gross National Income (GNI)
Gross National Product (GNP)
Define GNI (Gross national income)
the total income earned by a country’s residents and businesses, both domestically and abroad.
it is a broader measure than GDP and considers income earned from overseas investment and remittances.
value of goods and services produced by a country over a period of time plus net overseas interest payments and dividends.
This means that nit adds what a country earns from overseas investment and subtracts what foreigners earn in country and send back home from GDP. It is affected by profits from businesses owned overseas and remittances sent home by migrant workers. This increasingly used rather than GDP because of the growing size remittances and aid.
What will changing national income levels show?
Changing national income levels will show us whether the country has grown or shrunk over a period of time.
What are the main uses of growth indexes?
the data is compared to other countries to put figures in a context. Growth figures over a set period of time can be compared against similar countries to see whether a country has done well or not.
figures can also make judgements about economic welfare as growth in national income means a rise in living standards as the economy is producing more goods and services so people have access to more things.
Why is it important to use both real, per capita figures?
If a country’s population grows over time, then this may cause a rise in GDP without a rise in living standards, and so provide inaccurate comparisons. We use real GDP in order to strip out the effect of inflation, and therefore can give the impression of GDP growing without any more services and goods being produced
Define inflation
rising prices
Describe what is meant by cross- country comparisons
comparing growth rate between countries helps asses relative economic performance
it can reveal disparities in development and highlo9ght factors contributing to growth
Describe what is meant by long term trends
examining growth rates over time reveals economic patterns and trends
long term analysis can identify periods of economic expansion, recession or stagnation.
What are purchasing power parities (PPP)s?
Purchasing power parities (PPPs) are exchange rates that equalise the purchasing power of different currencies for a common basket of goods/
They account for price differences between countries and facilitate meaningful international comparisons
For example: if the exchange rate suggests that 1 USD equals 100 Japanese yen, but the PPP-adjusted exchange rate is 1 USD equals 110 yen, it means that the yen has greater purchasing power in Japan
Give 3 limitations of using GDP to compare standards of living
Income distribution: GDP per capital does not accounts for income inequality, and a high GDP may conceal disparities in living standards.
Non-market Activities: GDP excludes non-market activities like household labour and informal economies, leading to an incomplete picture of living standards.
Quality of life: GDP does not measure factors such as healthcare, education, environmental quality, and overall well-being
What is National Happiness?
talks about the UK National wellbeing and relationships between Real Income and subjective Happiness
UK National Happiness
some countries, including the UK, have explored measures of national well-being to complement GDP.
These measures consider factors like satisfaction, mental health, and social connections
What is the relationship between real incomes and subjective happiness?
Research suggests that while higher incomes are associated with increased happiness up to a point, the relationship between income and happiness diminishes beyond a certain income level.
For example: The world Happiness Report ranks countries based on factors like income, social support, life expectancy, freedom to make life choices, trust and generosity.
In recent years what have economists and policymakers increasingly recognised? Give an example from a Professor
They have recognised that wellbeing may be a more useful indicator of a country’s progress.
As Professor Jeffrey Sachs states in the UN World Happiness Report: “There is now a rising worldwide demand that policy be more closely aligned with what really matters to people as they themselves characterise their wellbeing.”
When was the ONS Measuring National Wellbeing Programme launched and what were its aims?
It was launched in 2010
this programme aims to measure how the UK is doing beyond GDP - not just economic growth, but quality of life.
What are the 10 wellbeing domains the ONS (Office for National Statistics) collects data across?
health
Education
Environment
Personal finance
Relationships
Governance
What are the 2 measures the Office for National Statistics uses?
Objective measures
Subjective measures
What are objective measures? Give examples
things that can be measured numerically (e.g life expectancy, unemployment, income levels, crime rates, education attainment=
What are subjective measures?
How people feel about their live (e.g life satisfaction, happiness yesterday, anxiety levels, sense of purpose)
Why is it important for the distinction to be made between objective and subjective measures?
Because objective measures indicators do not always match people’s perceptions. For examples, actual crime may fall, but fear of crime may stay high.
What have recent ONS wellbeing updates typically shown?
Life satisfaction and happiness have been fairly stable but vulnerable to falls during economic uncertainty (e.g cost-of-living pressures).
Anxiety tends to rise during periods of financial stress or political instability.
Mental health continues to be a major factor affecting wellbeing.
Inequalities in wellbeing exists across religions, ages and income groups .
According to Richard Layard what are the 7 major factors which affect individual wellbeing?