Maxwell Boltzman
0.0(0)
Card Sorting
1/3
Earn XP
Description and Tags
Study Analytics
Name | Mastery | Learn | Test | Matching | Spaced |
|---|
No study sessions yet.
4 Terms
1
New cards
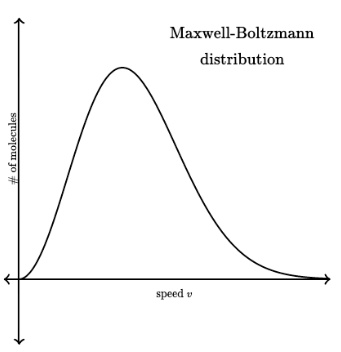
Maxwell Boltzman Graph
2
New cards
Maxwell Boltzman definition
display distribution of energy at given temperatures for GAS
3
New cards
X-Axis of graph
represents the amount of energy of temperature; increases as you move to the right
4
New cards
Y-Axis of graph
represents the amount of molecules present; increases as you move up