unit 4
1/23
There's no tags or description
Looks like no tags are added yet.
Name | Mastery | Learn | Test | Matching | Spaced | Call with Kai |
|---|
No analytics yet
Send a link to your students to track their progress
24 Terms
what is
locus
allele
genotype
characteristic/trait
character state
phenotype
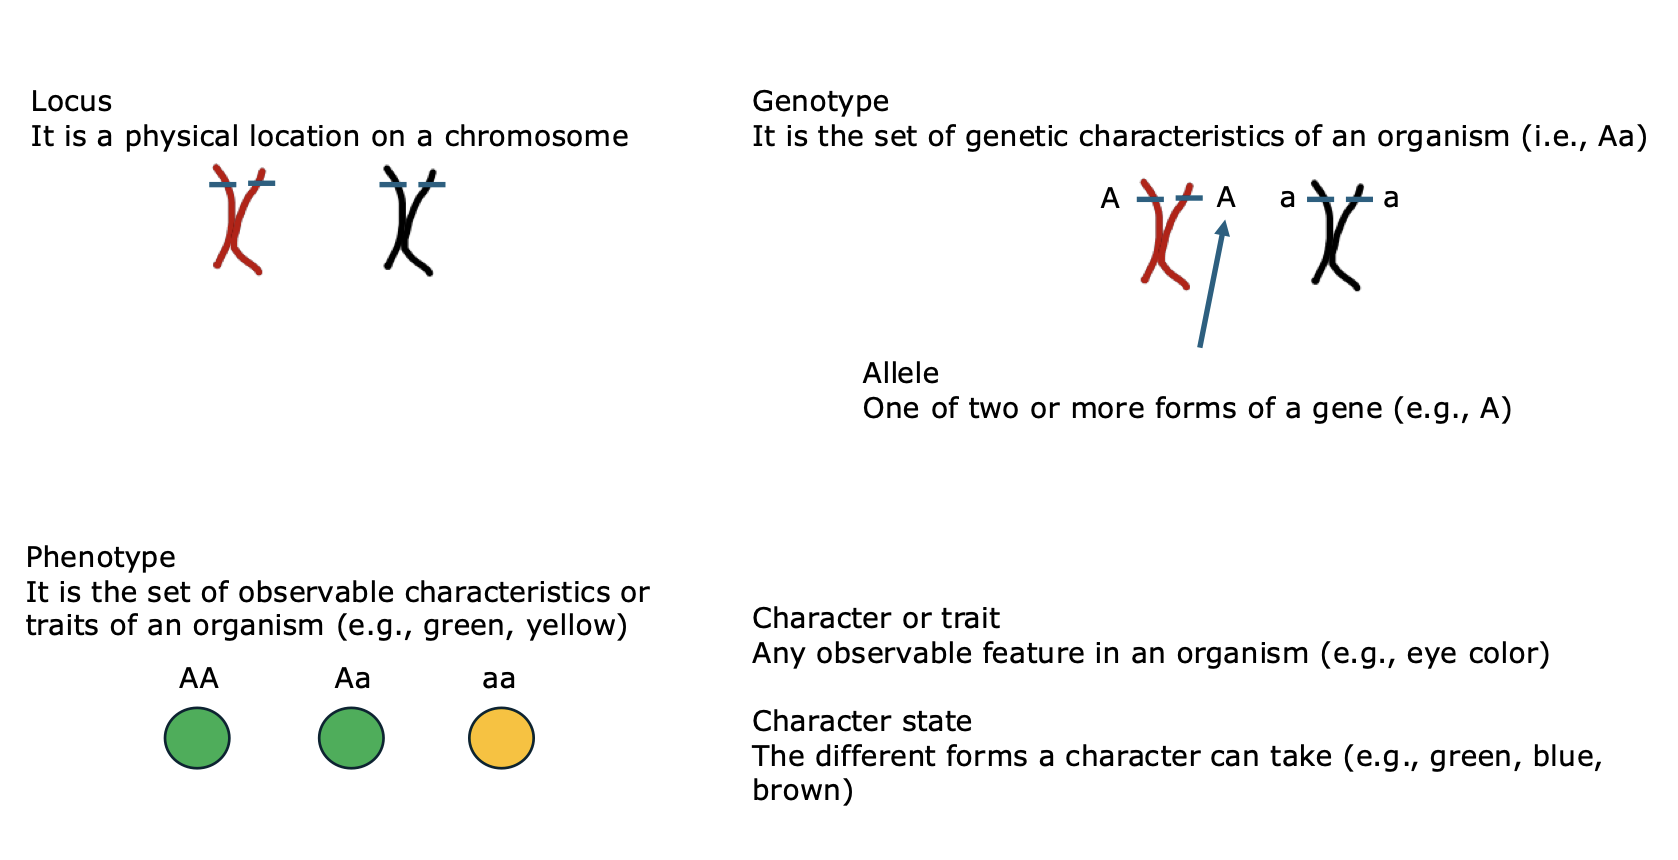
locus - physical location on the chromosome
allele - one of two or more forms of a gene (i.e. A or a)
genotype - set of genetic characteristics of an organism (i.e. Aa)
characteristic/trait - any observable feature of an organism (i.e. eye colour)
character state - the different forms a characteristic can take (i.e. green, blue, brown)
phenotype - set of observable characteristics or traits of an organism (i.e. green, yellow)
genotypic frequency
Definition: The proportion of a specific genotype in a population.
Formula: f(genotype) = # with that genotype/total pop’n
Example:
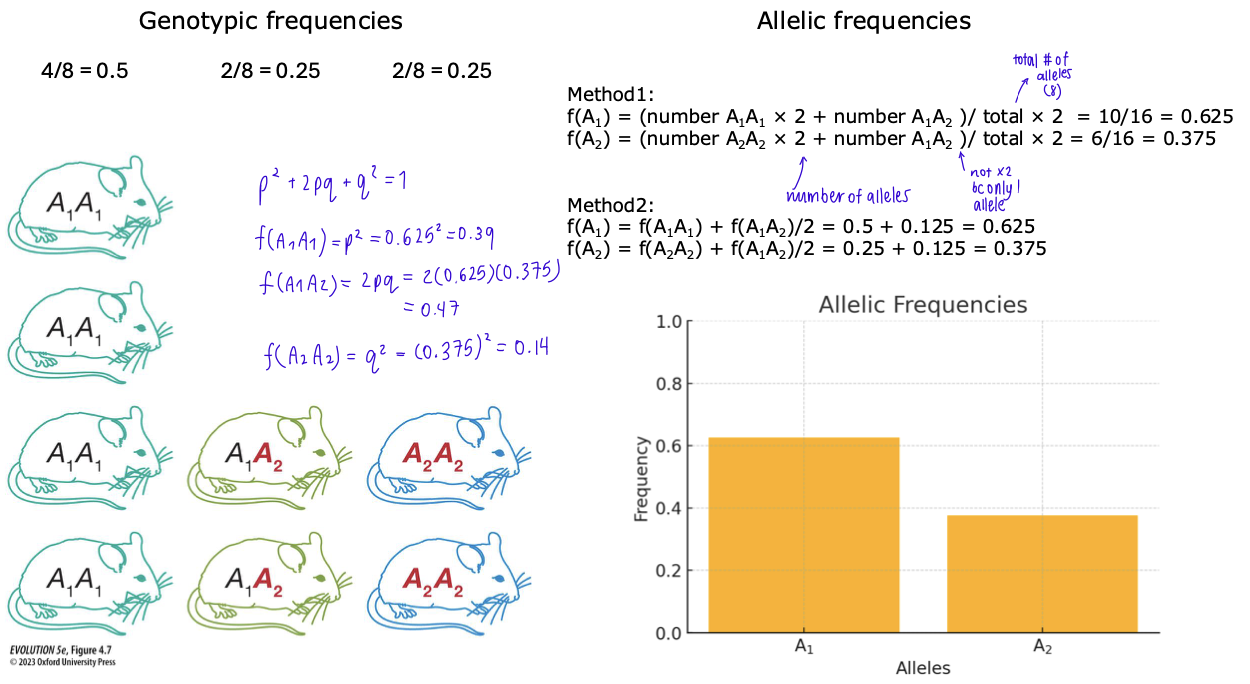
allelic frequencies
Definition: The proportion of a specific allele in the population.
Formula:
two methods, see image
Segregation
Segregation: Transmission of one of two copies of a locus during meiosis.
Fusion of egg & sperm → Offspring receives one allele from each parent.
Offspring can have a new genotype unlike either parent.
Example:
Mother: A₁A₁ (homozygous)
Father: A₂A₂ (homozygous)
Offspring: 100% A₁A₂ (heterozygous)
Hardy-Weinberg Equilibrium
Describes genotype proportions when only segregation affects frequencies.
General case: Let p = frequency of A1, and q = frequency of A2.
Genotype frequencies using the allele frequencies:
f(A₁A₁) = p²
f(A₁A₂) = 2pq
f(A₂A₂) = q²
p² + 2pq + q² = 1
equals 1 because 100% of the population has to fall within the three genotypes and the two allele types
p + q must equal 1

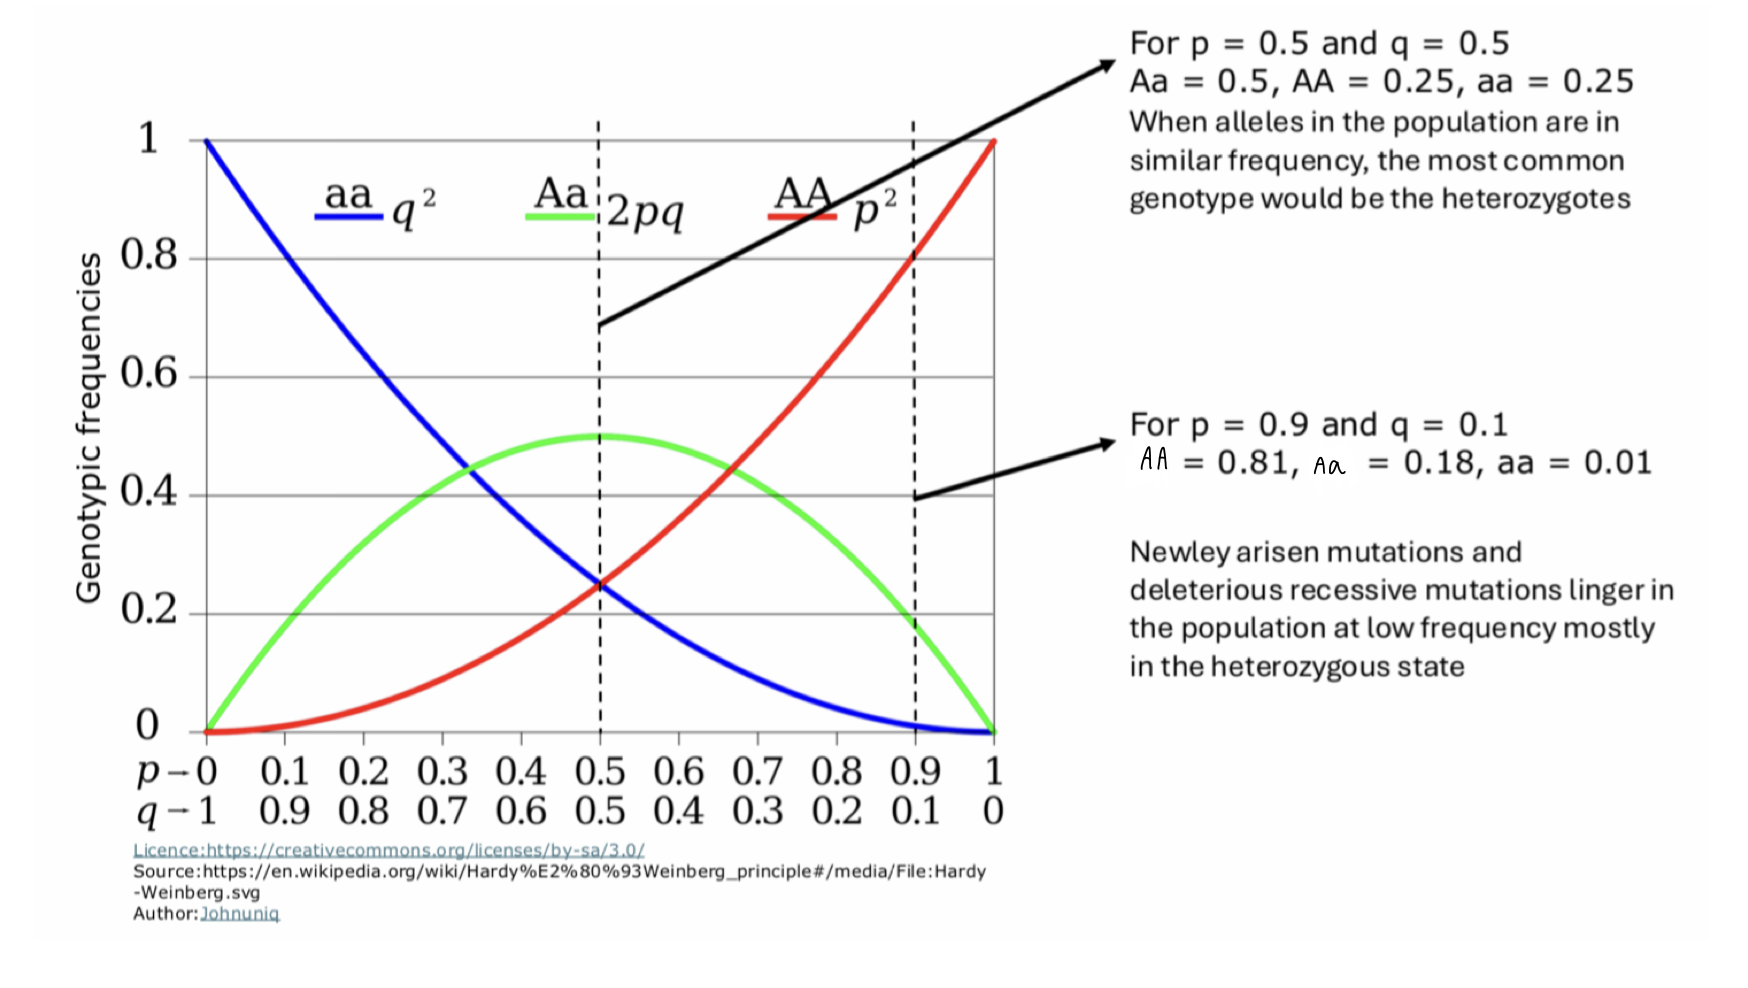
Hardy-Weinberg equilibrium graph
Shows the relationship between allele frequencies (p and q) and genotype frequencies (p², 2pq, and q²)
X-axis: Represents allele frequencies (p and q) ranging from 0 to 1, sum is always equal to 1
Y-axis: Represents genotypic frequencies in the population, sum is always equal to 1
Curves:
Red (p²) → Frequency of the homozygous dominant genotype (AA)
Green (2pq) → Frequency of the heterozygous genotype (Aa)
Blue (q²) → Frequency of the homozygous recessive genotype (aa)
What is the purpose of the Assumptions of Hardy-Weinberg Equilibrium
conditions needed for allele & genotype frequencies to stay constant (no evolution)
if any assumption is violated → population evolves
creates an idealized, non-evolving population → used as a baseline to detect evolutionary changes
Assumptions of Hardy-Weinberg Equilibrium
Random mating → Equal chance of mating with any individual of the opposite sex; maintains constant allele/genotype frequencies.
No selection → No advantage for specific genotypes; prevents changes in allele/genotype frequencies.
Infinite population → Prevents genetic drift, which is stronger in small populations.
No gene flow → No introduction of external alleles; maintains population’s genetic composition.
No mutation → Mutations are rare but can still impact allele/genotype frequencies over time.
⚠ Real populations never fully meet these conditions, but large populations with low mutation rates approximate Hardy-Weinberg frequencies closely.
what happens when there is a union of gametes in a population not in equilibrium with only few heterozygotes?
Random mating alone restores Hardy-Weinberg equilibrium in one generation.
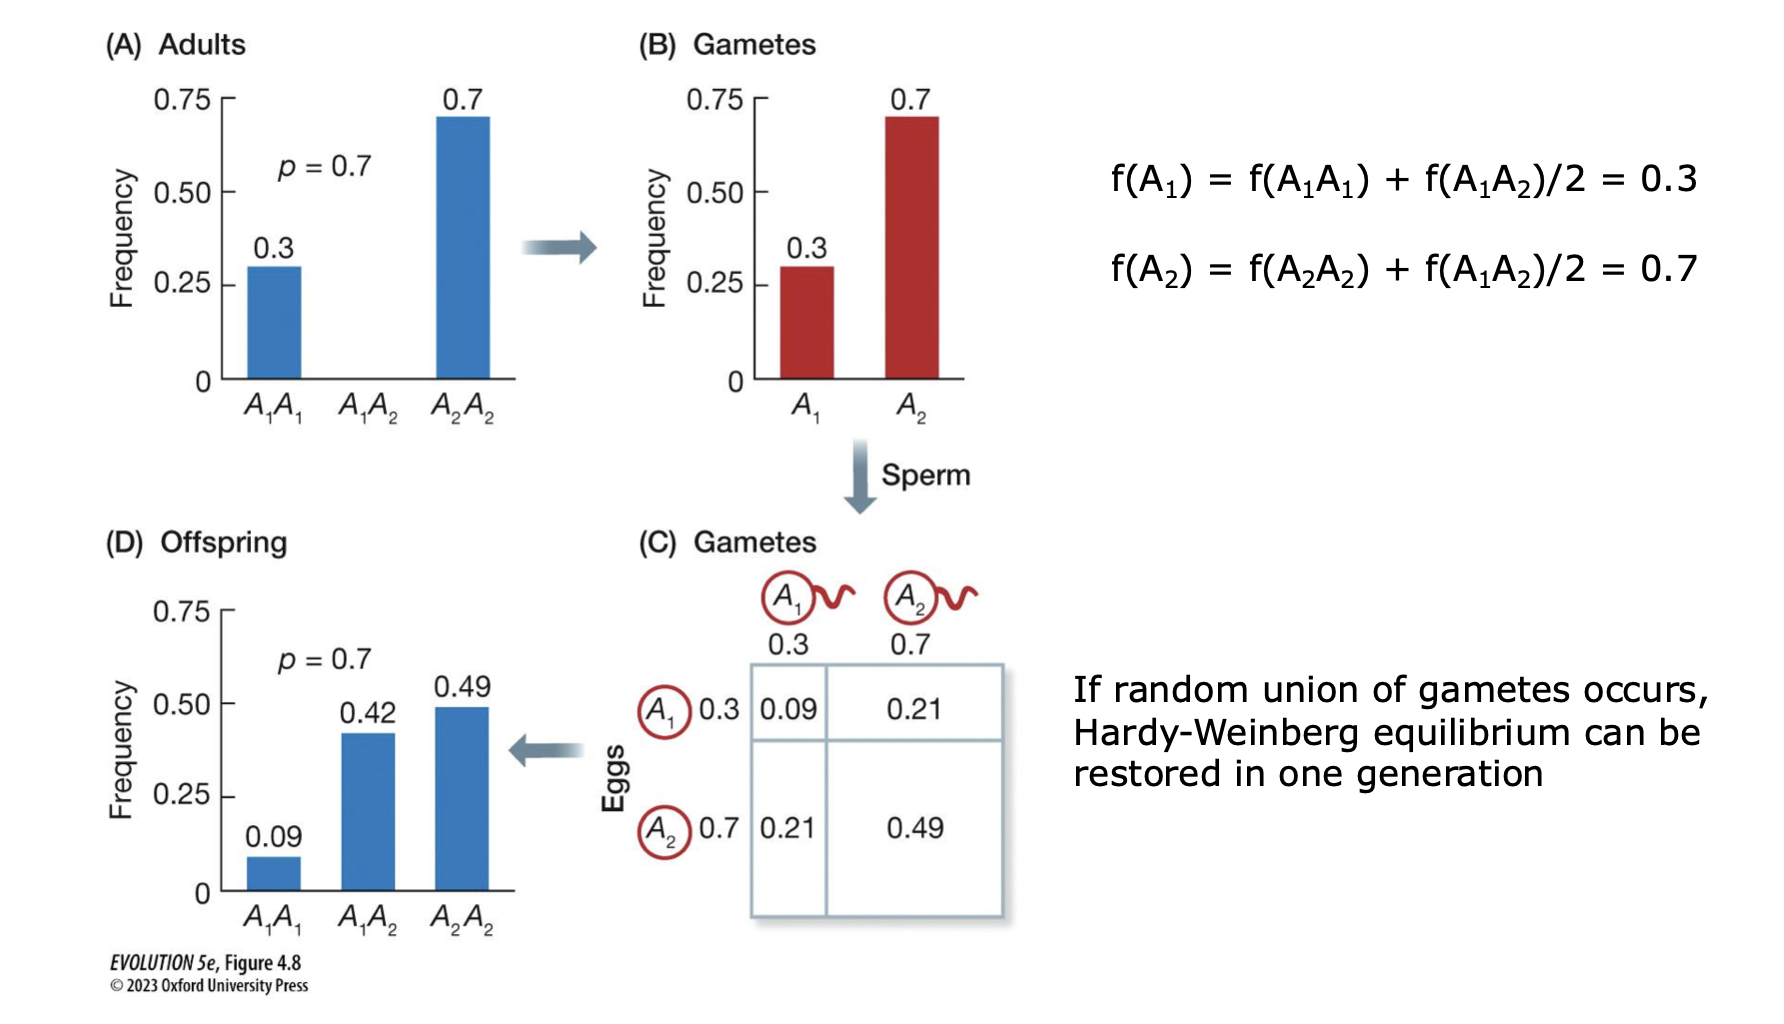
Initial population:
30% A₁A₁, 70% A₂A₂ (not in equilibrium, few heterozygotes).
Random mating → Offspring genotypes:
A₁A₁ = (1 - 0.7)² = 0.09 (9%)
A₁A₂ = 2(0.7 × 0.3) = 0.42 (42%)
A₂A₂ = 0.7² = 0.49 (49%)
Genotypes shift to equilibrium, but allele frequencies remain constant.
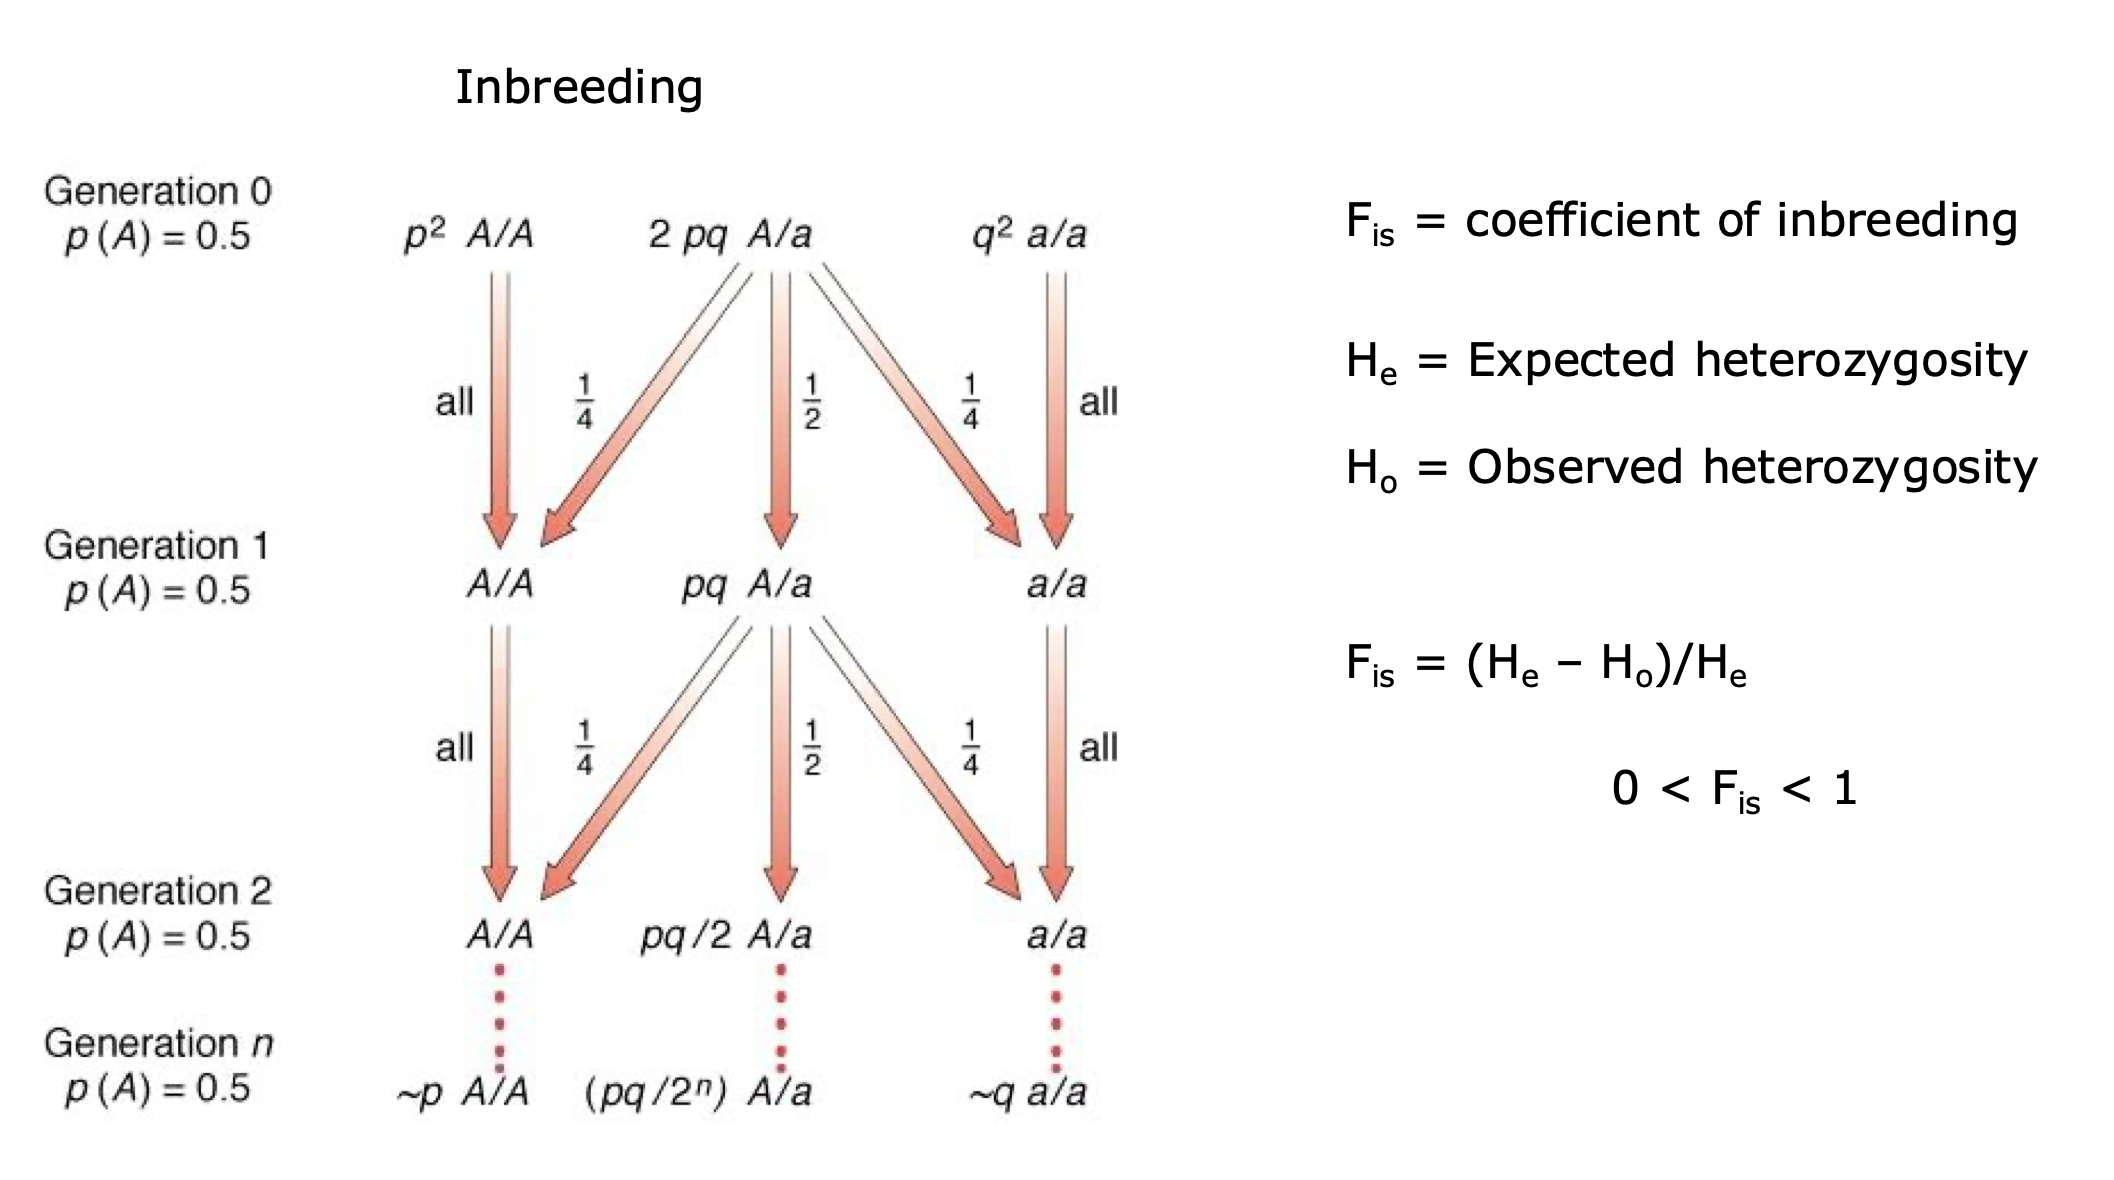
inbreeding and what does it do to the genotype frequencies? what about allele frequencies? what is the inbreeding coefficient?
Increases homozygosity (more A/A and a/a genotypes) and decreases heterozygosity (fewer A/a genotypes).
Over time, leads to more homozygous individuals and a reduction in genetic diversity.
No change in allele frequencies (p(A) and p(a) stay the same) because inbreeding does not introduce new alleles or remove existing ones
mendelian vs multigenic traits
Mendelian Traits:
Controlled by one gene, follow Mendel’s laws (dominant/recessive)
Predictable inheritance (e.g., cystic fibrosis, Huntington’s)
Multigenic (Polygenic) Traits:
Controlled by multiple genes, show continuous variation
Influenced by environment (e.g., height, skin color, diabetes).
Key Difference: Mendelian traits have distinct categories, while multigenic traits show a range of phenotypes
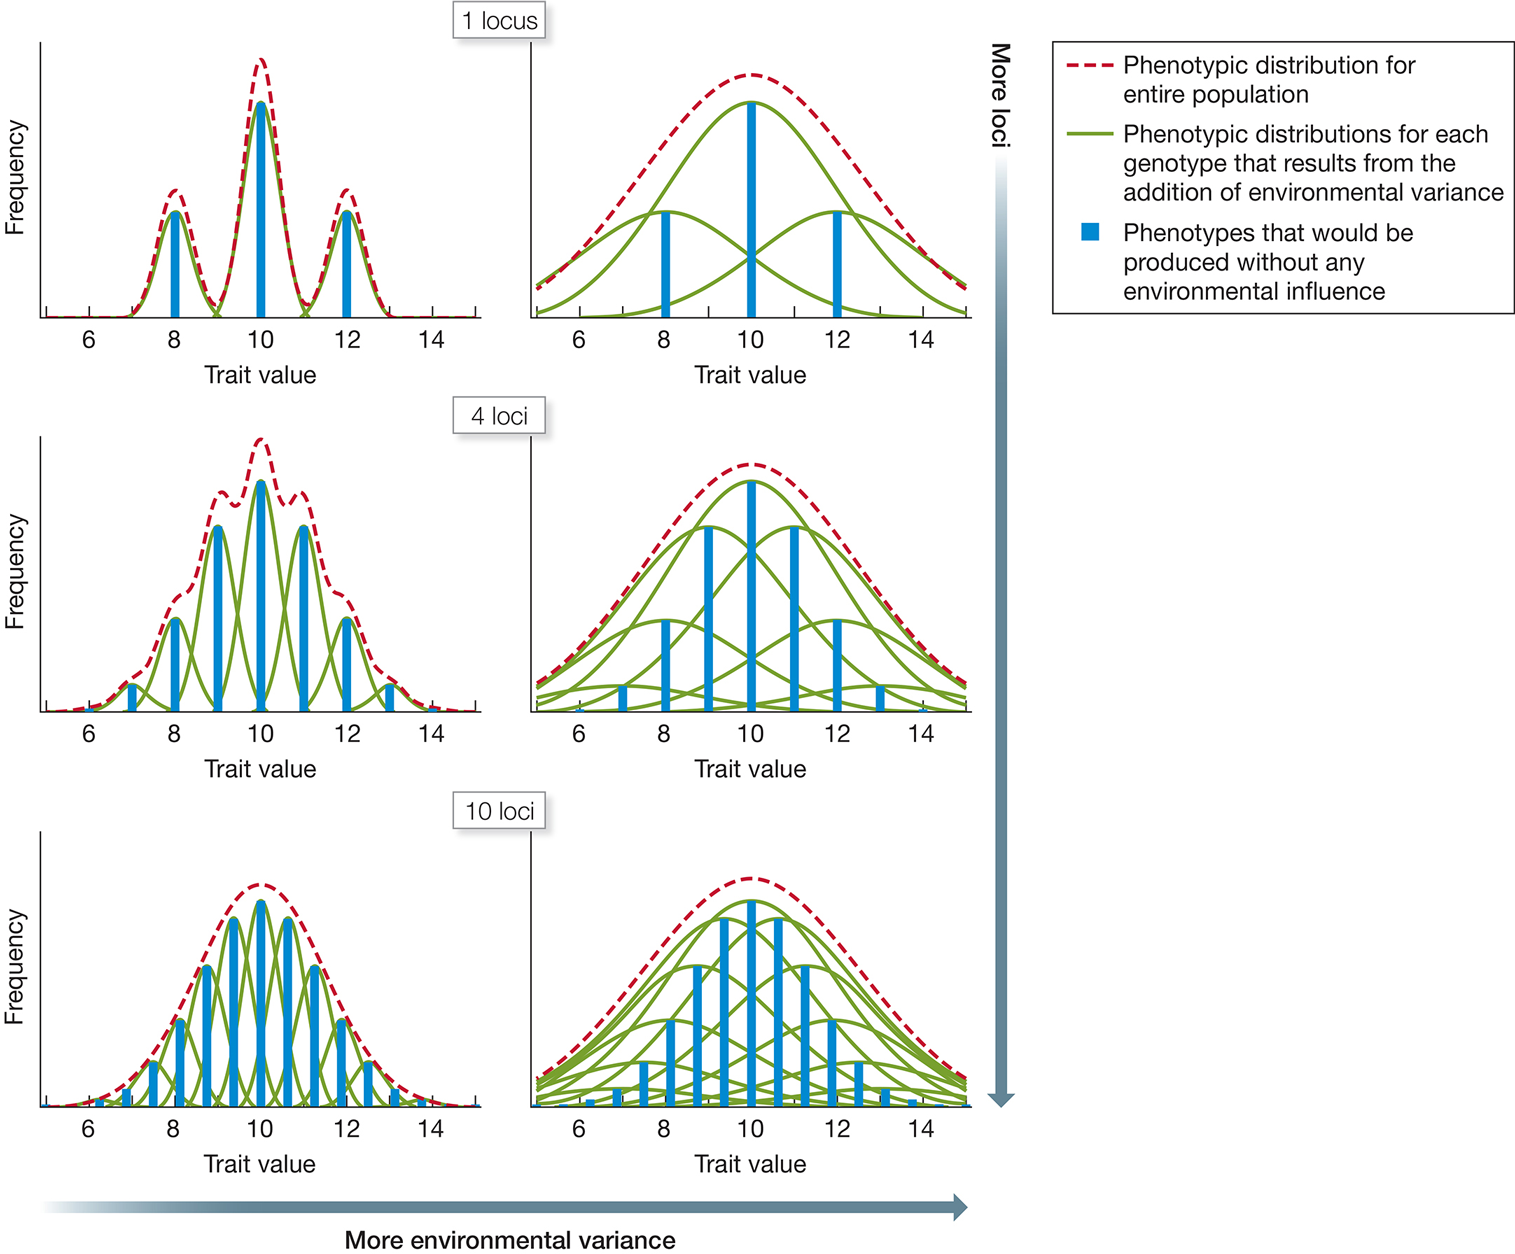
DNA is made of discrete characters (i.e., C, G, T, A), but a phenotypic trait like height varies in a continuous way. Why?
Single locus + low environmental variation → Distinct phenotypic categories (reflects discrete genotypes).
Single locus + high environmental variation → Smoother phenotypic distribution.
Multiple loci (e.g., 10) + low environmental variation → Very smooth distribution.
Polygenic traits + environmental influence → Continuous variation (e.g., height).
Quantitative traits often follow a normal (Gaussian/bell-shaped) distribution.
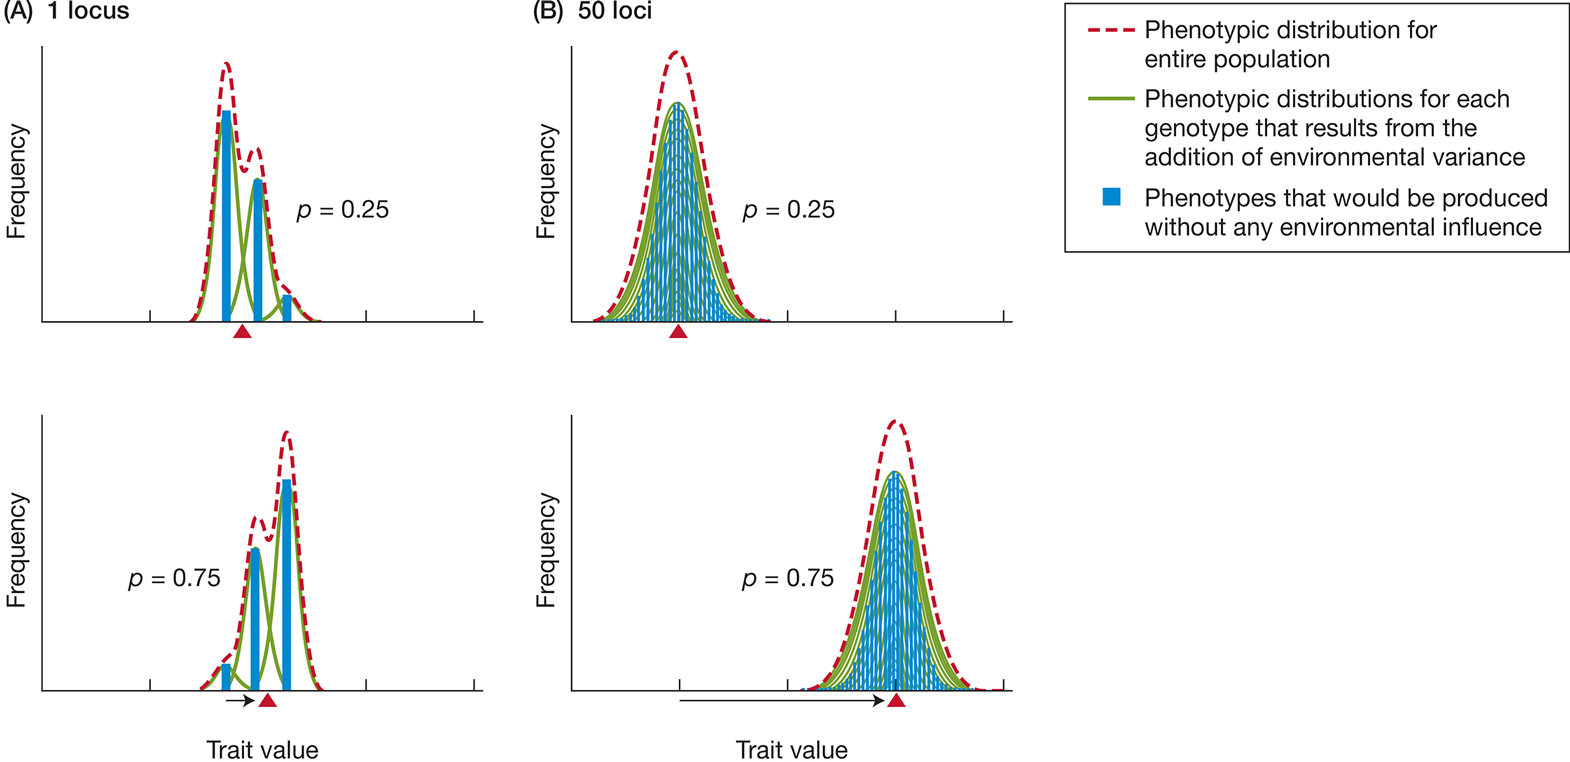
Changes in allelic frequencies can determine large phenotypical changes in multigenic traits
A shift in allele frequencies can result in a significant increase in previously rare or absent genotypes, leading to the emergence of new and extreme phenotypes.
what is Phenotypic variation determined by
determined by a combination of genetic and environmental factors
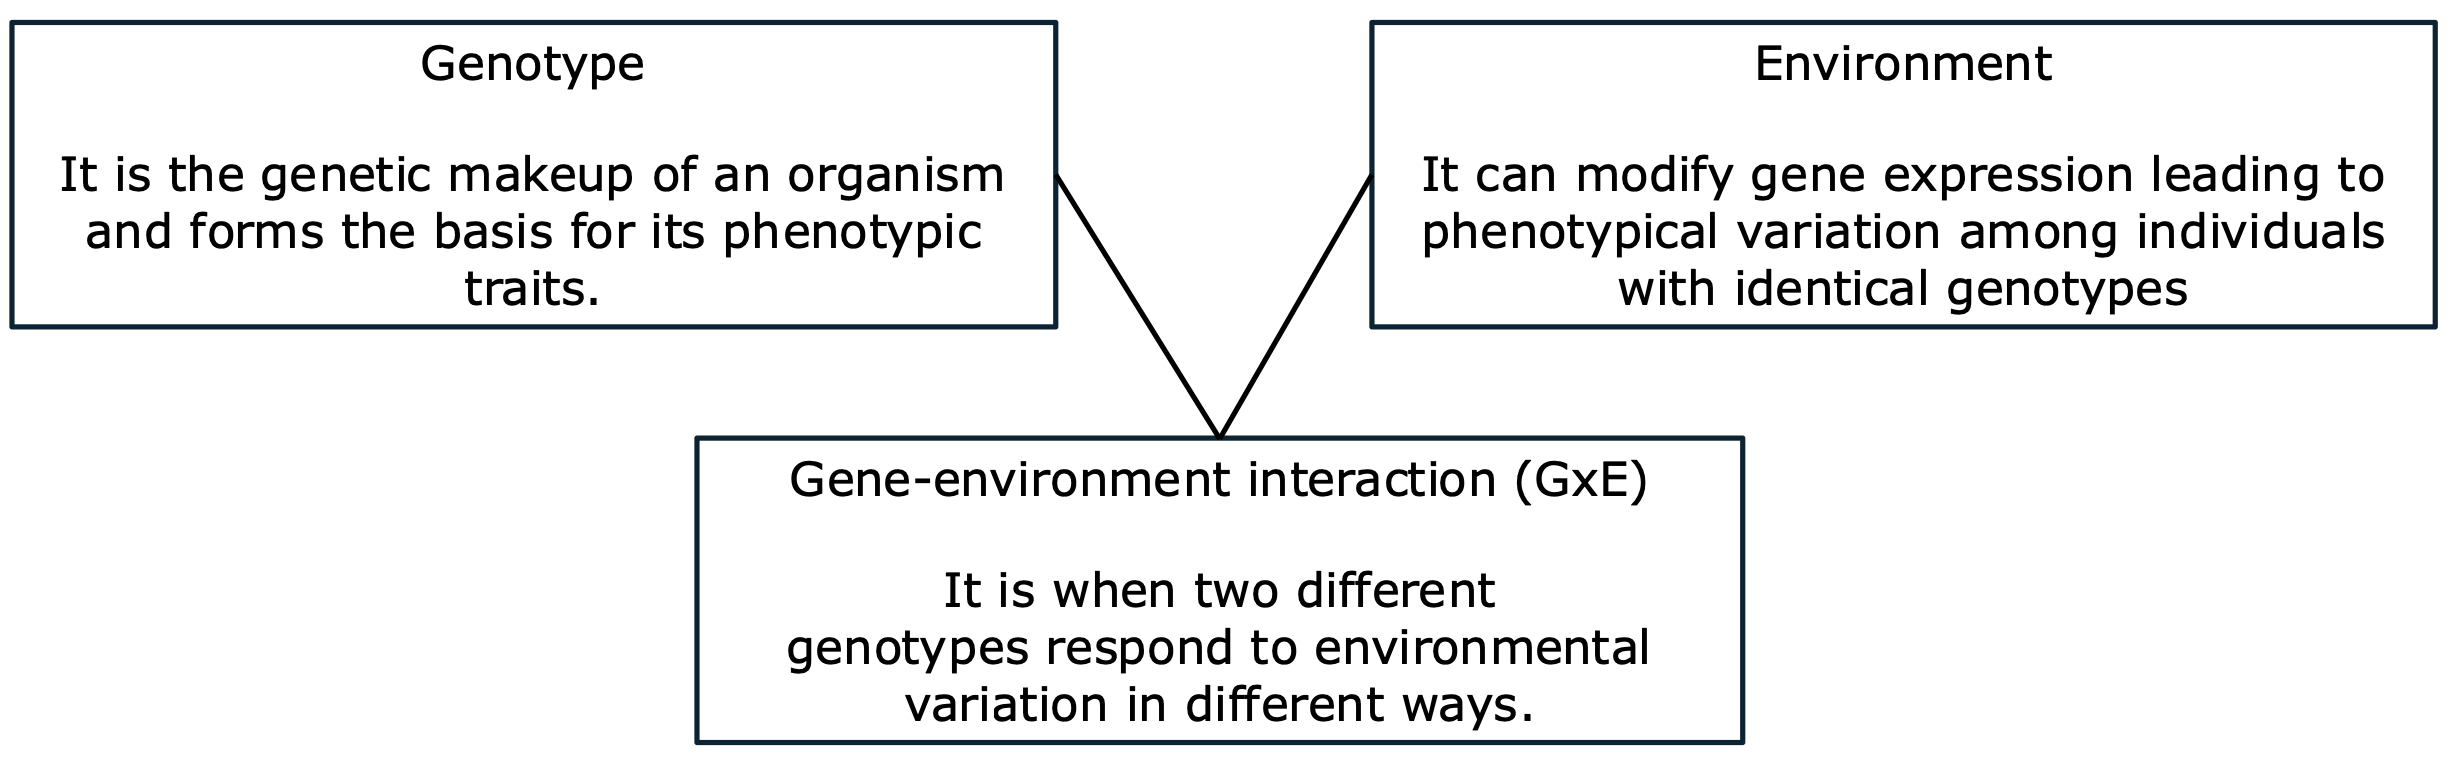
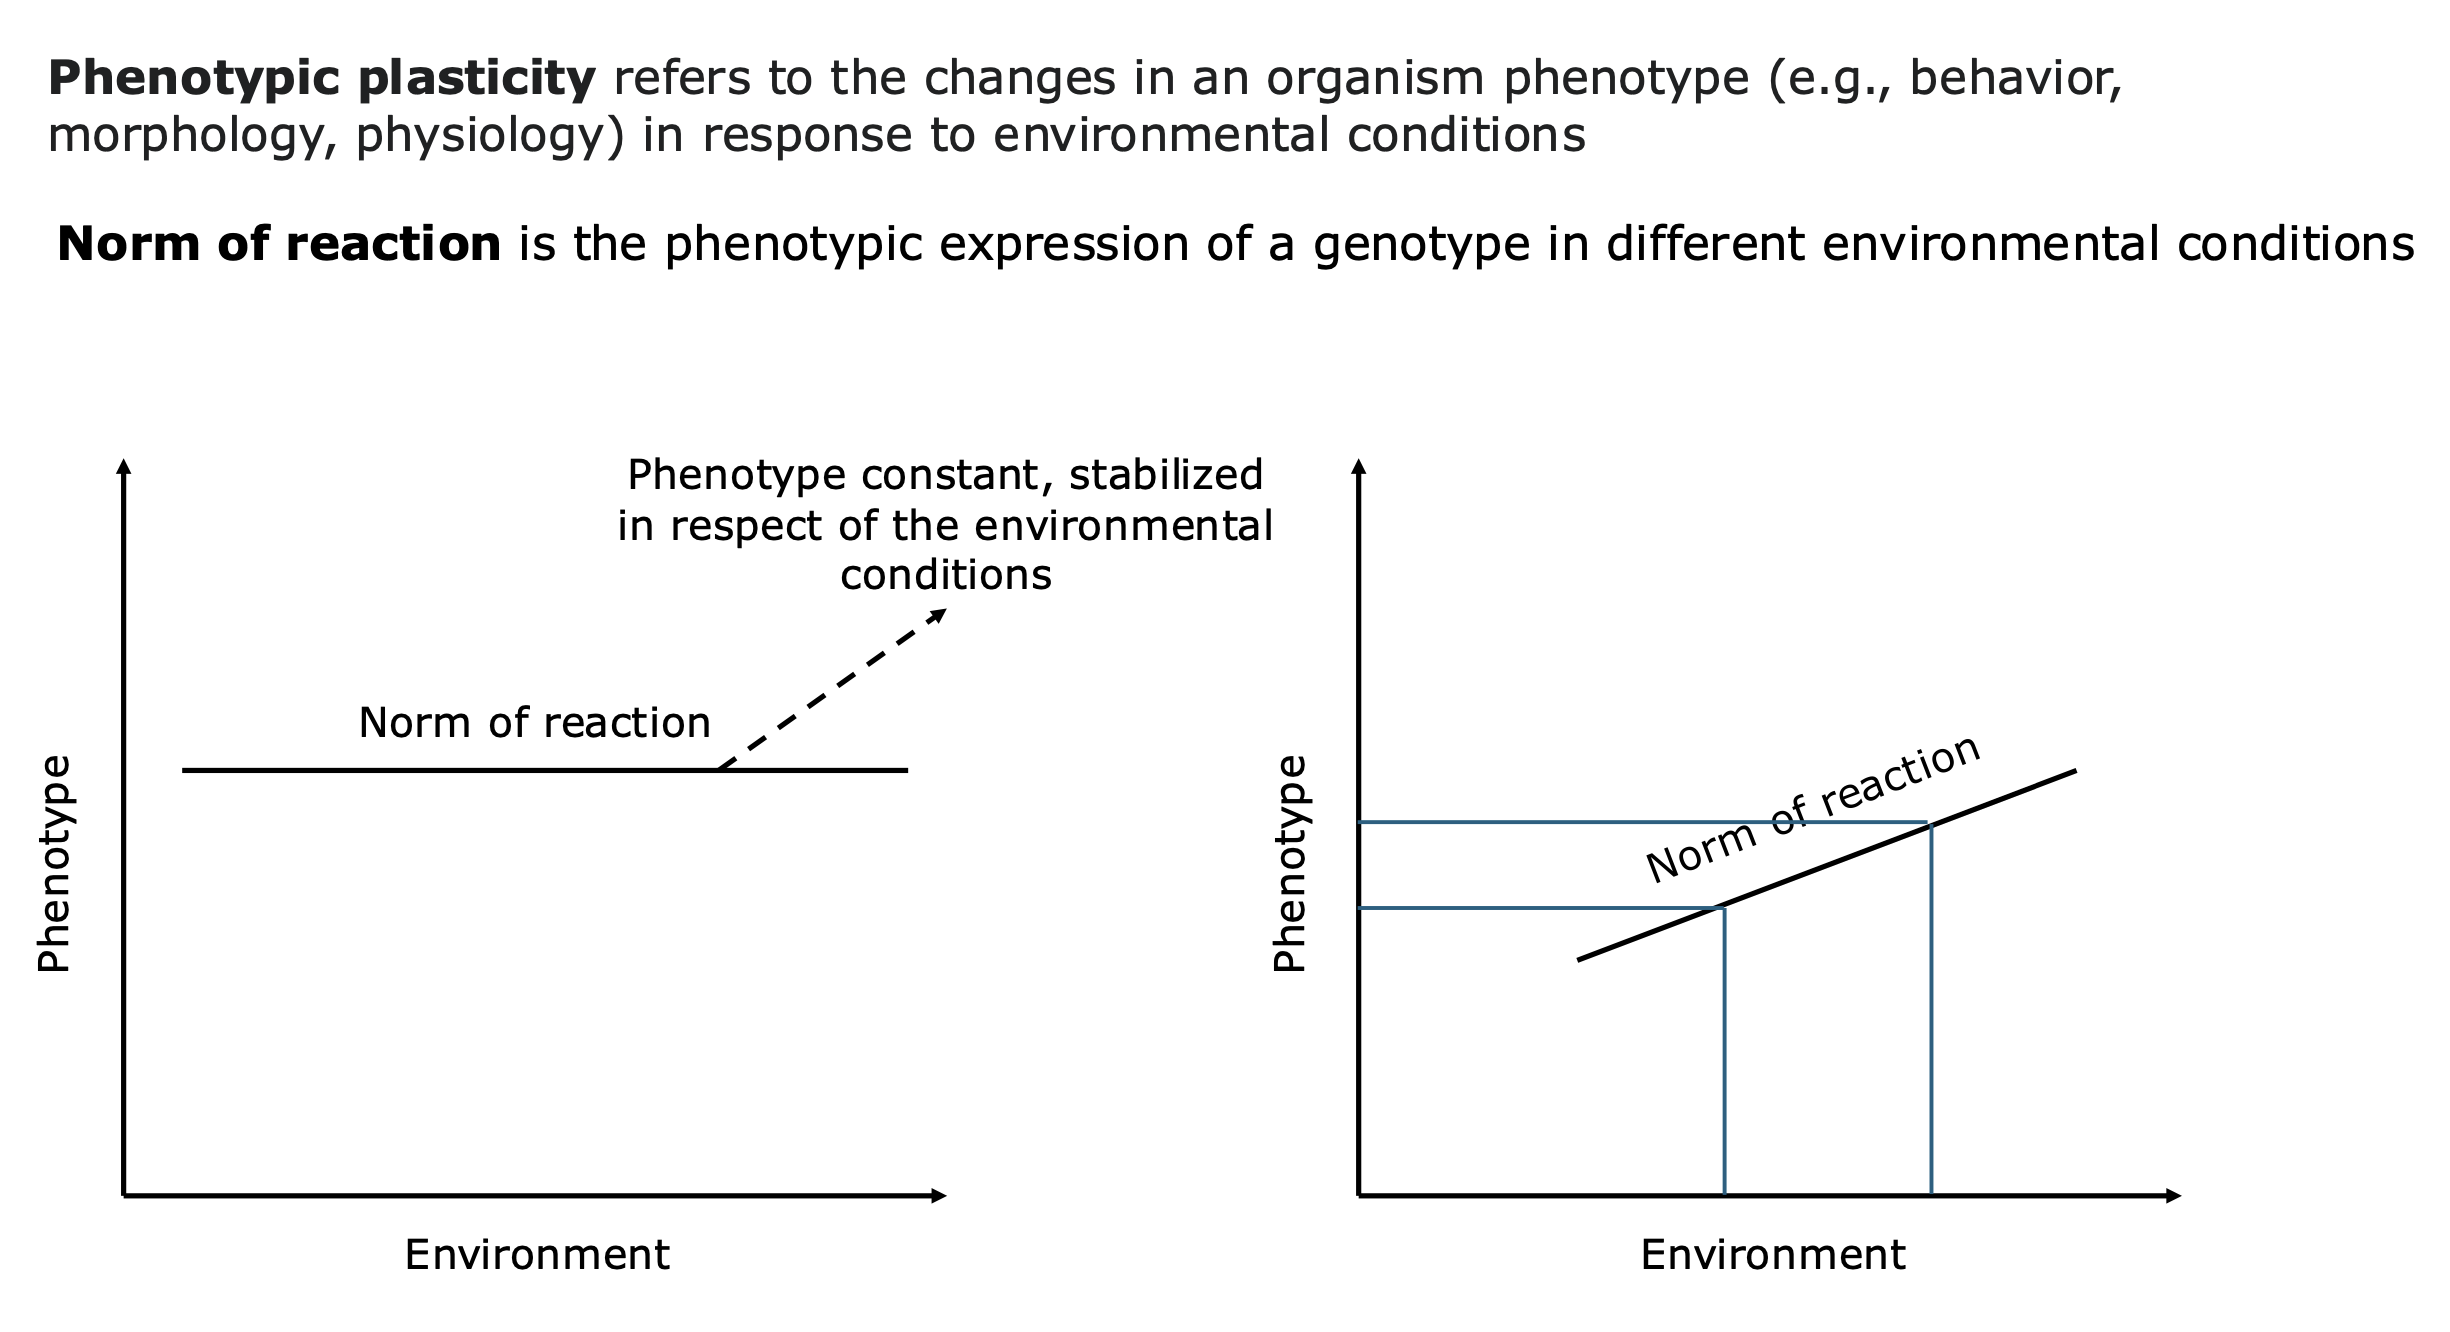
define phenotypic plasticity and norm of reaction
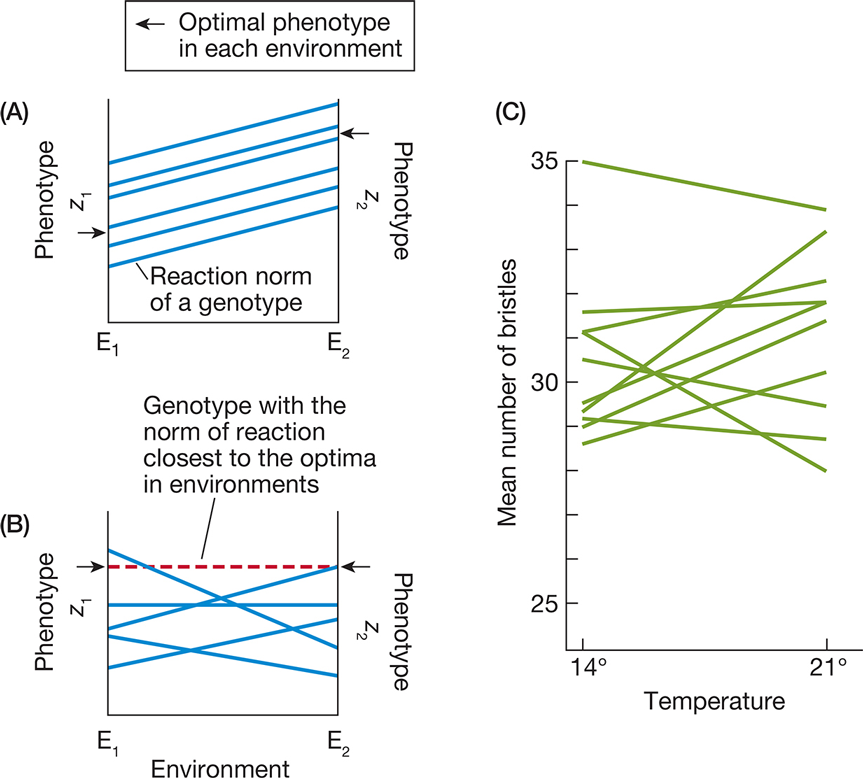
what way of genotypic responses to the environment leads to evolution?
No evolution when all genotypes respond the same way:
No genetic variation in response to the environment → no selection.
All genotypes shift together → no differentiation for selection to act on.
Population cannot evolve toward an optimal phenotype.
Evolution occurs when genotypes respond differently:
Genotype-by-environment interaction (VG × E) creates variation in plasticity.
Selection favors genotypes with optimal phenotypic responses.
Over time, population evolves toward environment-specific optima (e.g., Drosophila pseudoobscura bristle variation).
importance of phenotypic plasticity for organisms with and without mobility?
1. Mobile Organisms
Can move to new environments, but still benefit from plasticity.
Allows behavioral, physiological, and morphological adjustments to varying conditions.
Example: Arctic fox changes coat color with seasons (white in winter, brown in summer).
2. Non-Mobile (Sessile) Organisms
Cannot relocate, so plasticity is crucial for survival.
Adapt by altering growth patterns, metabolic rates, or reproductive strategies.
Example: Plants modify leaf size based on sunlight availability.
Plasticity enhances survival & fitness in both mobile & non-mobile organisms by allowing adaptation to environmental changes without genetic change.
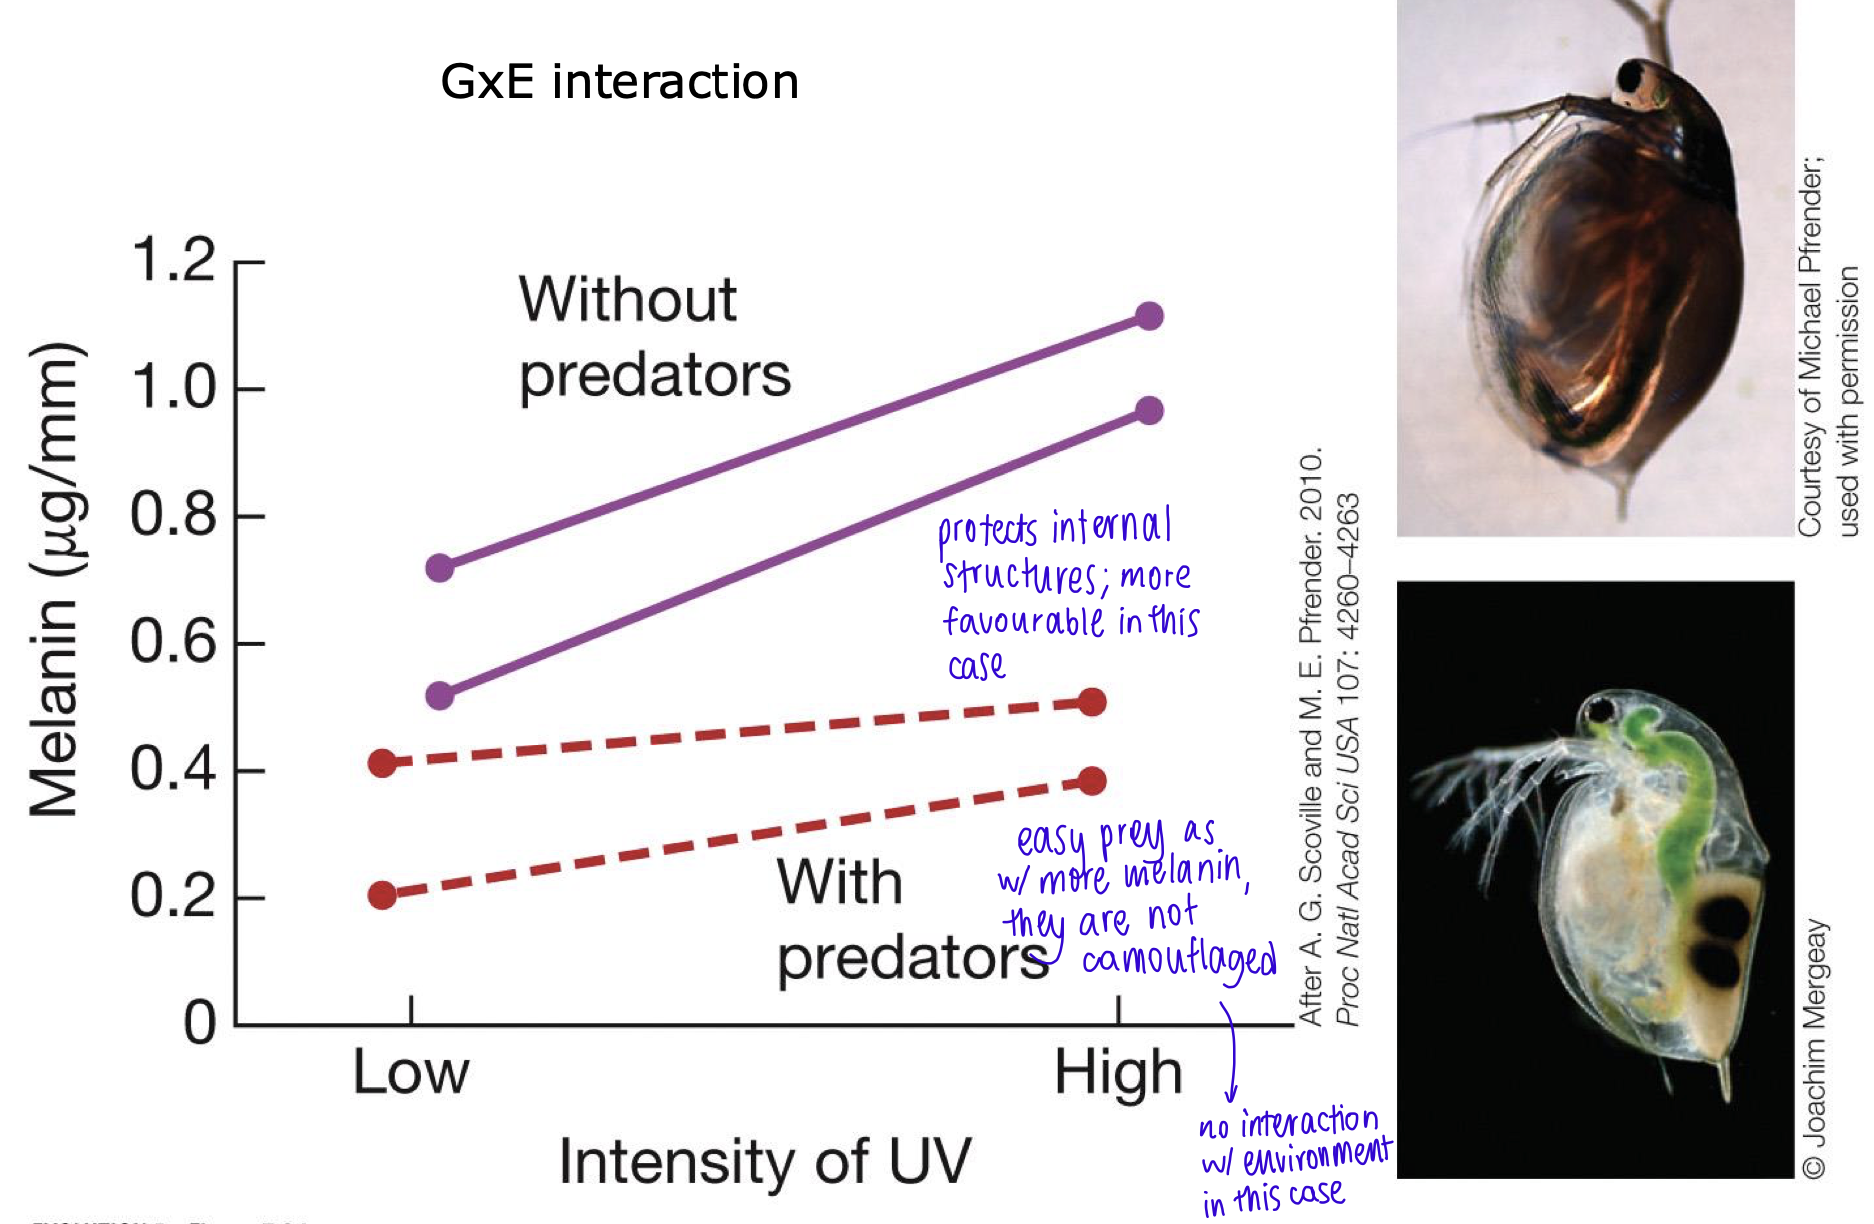
Different norms of reaction expressed by different genotypes (water flea example)
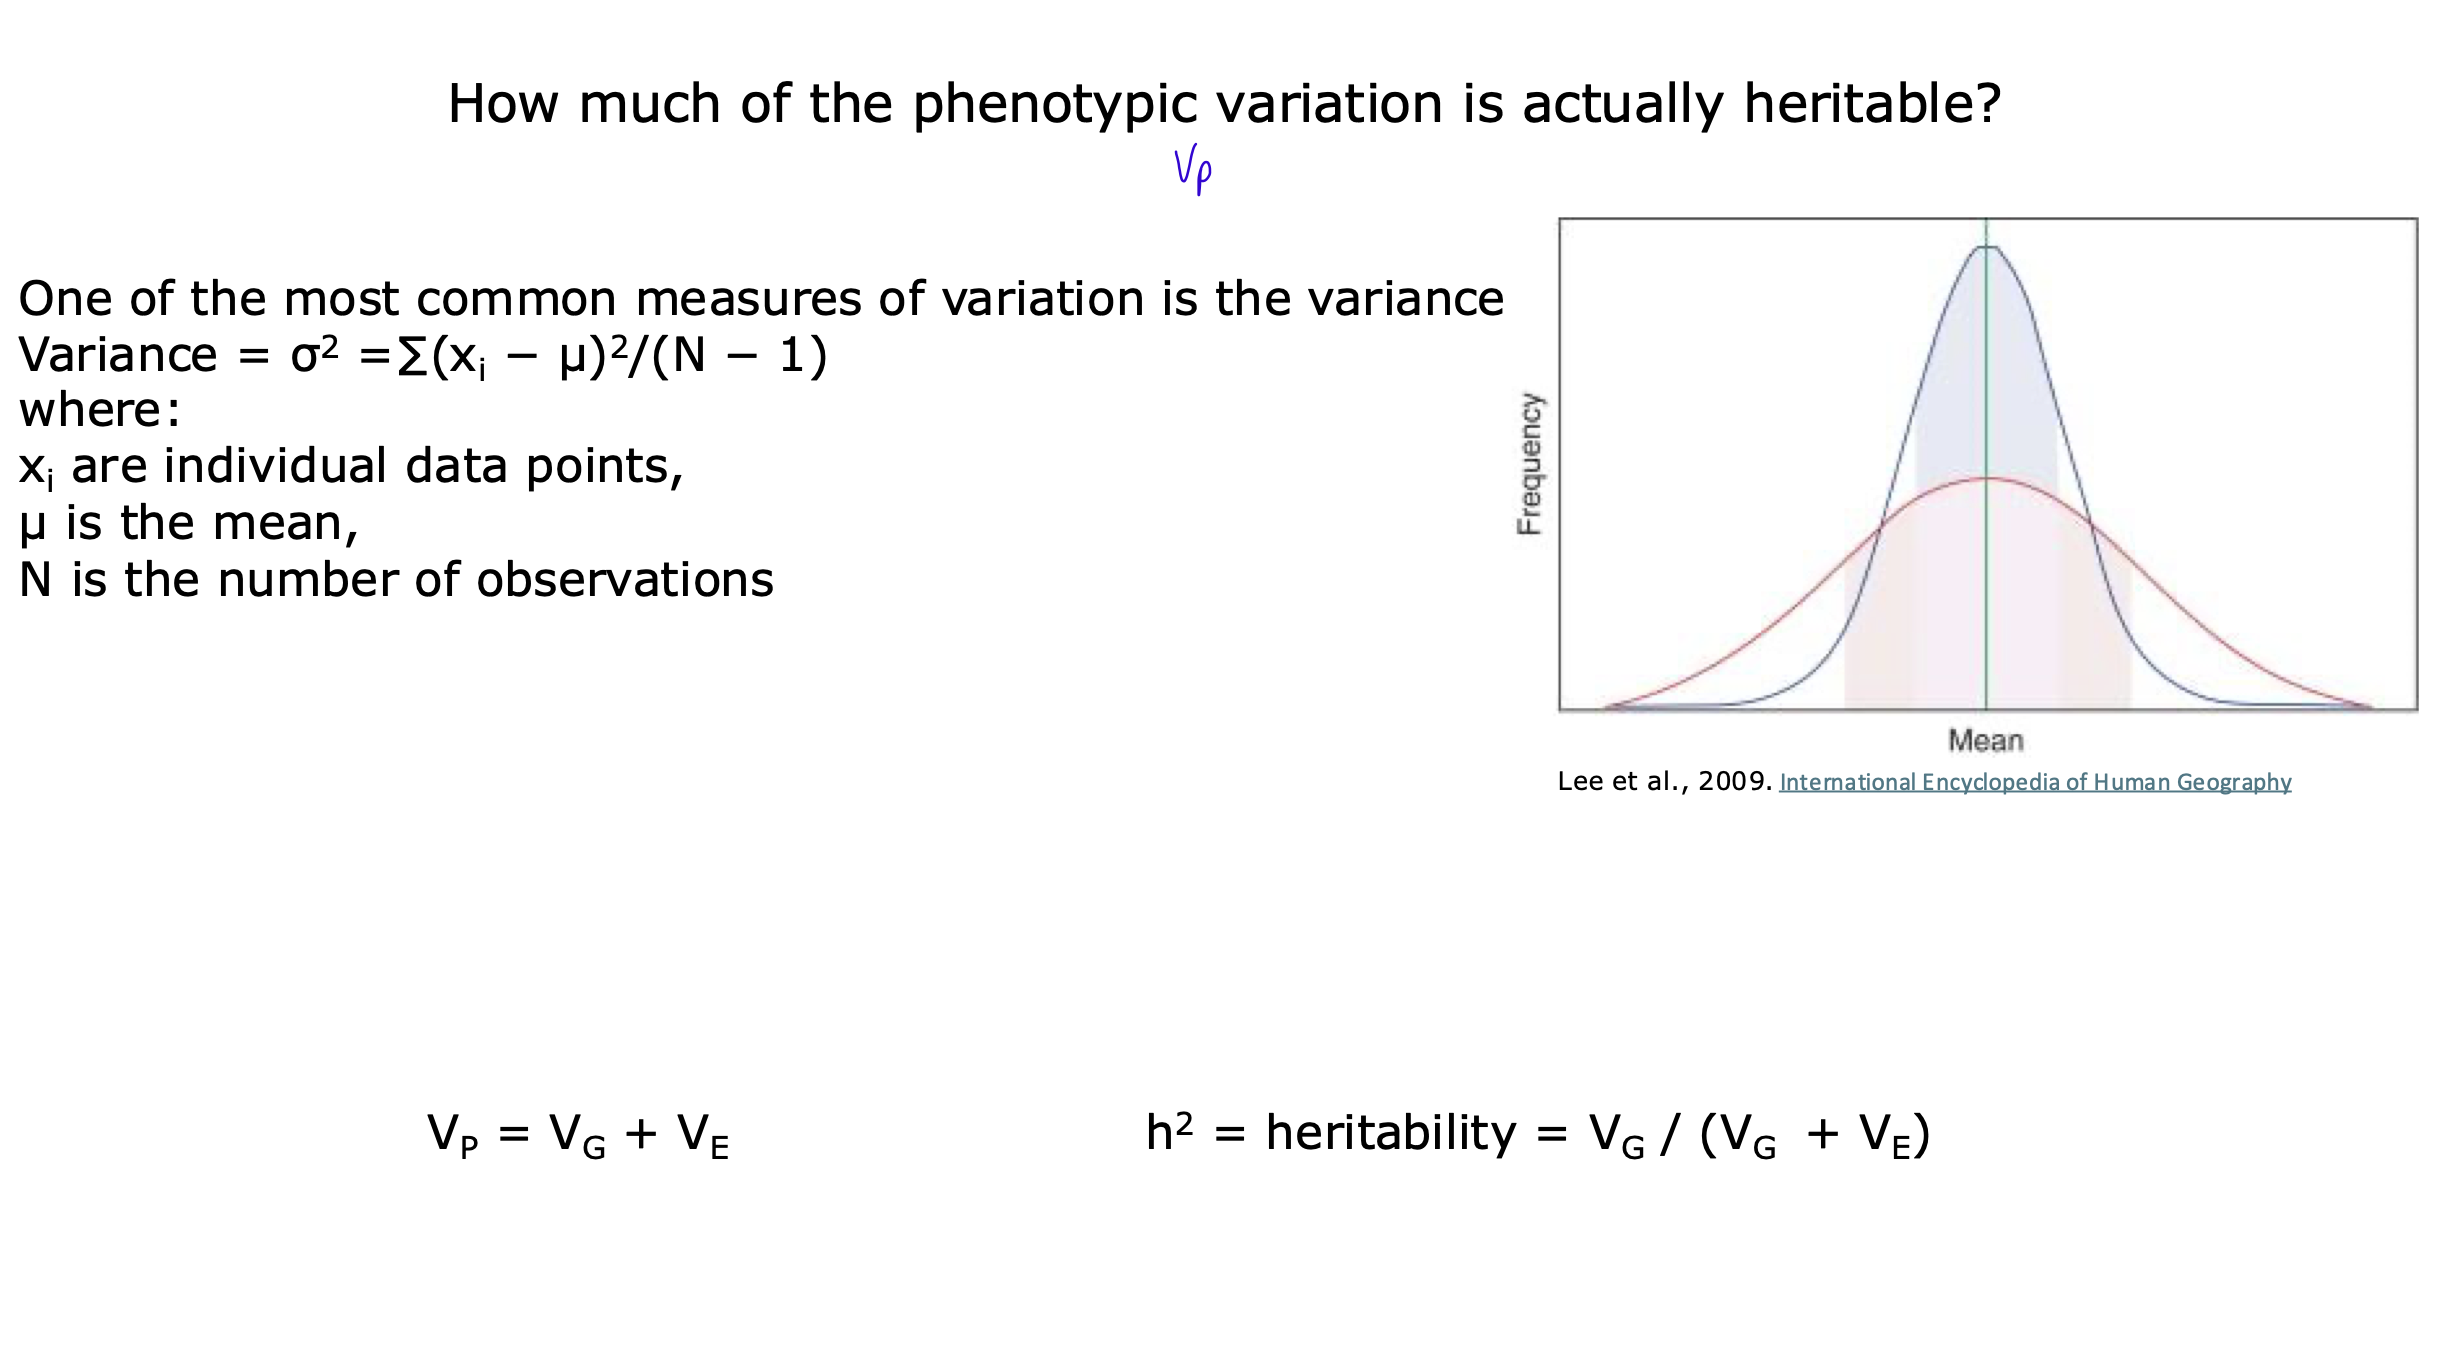
how do you measure variance? phenotypic variance (Vp)? heritability?
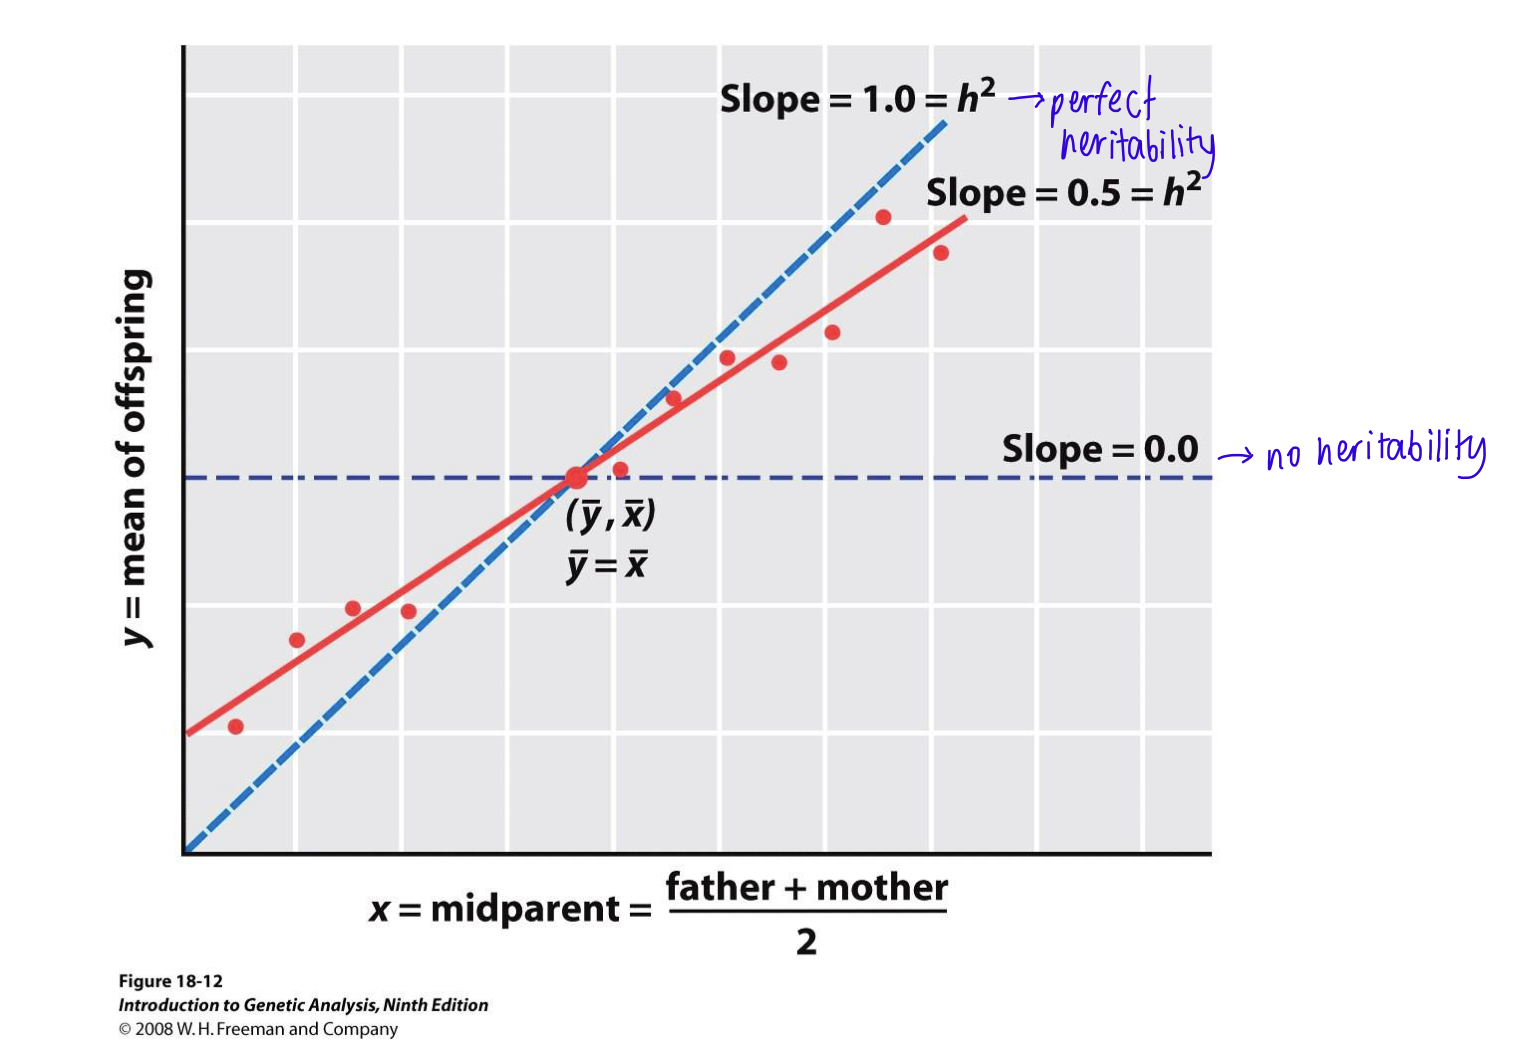
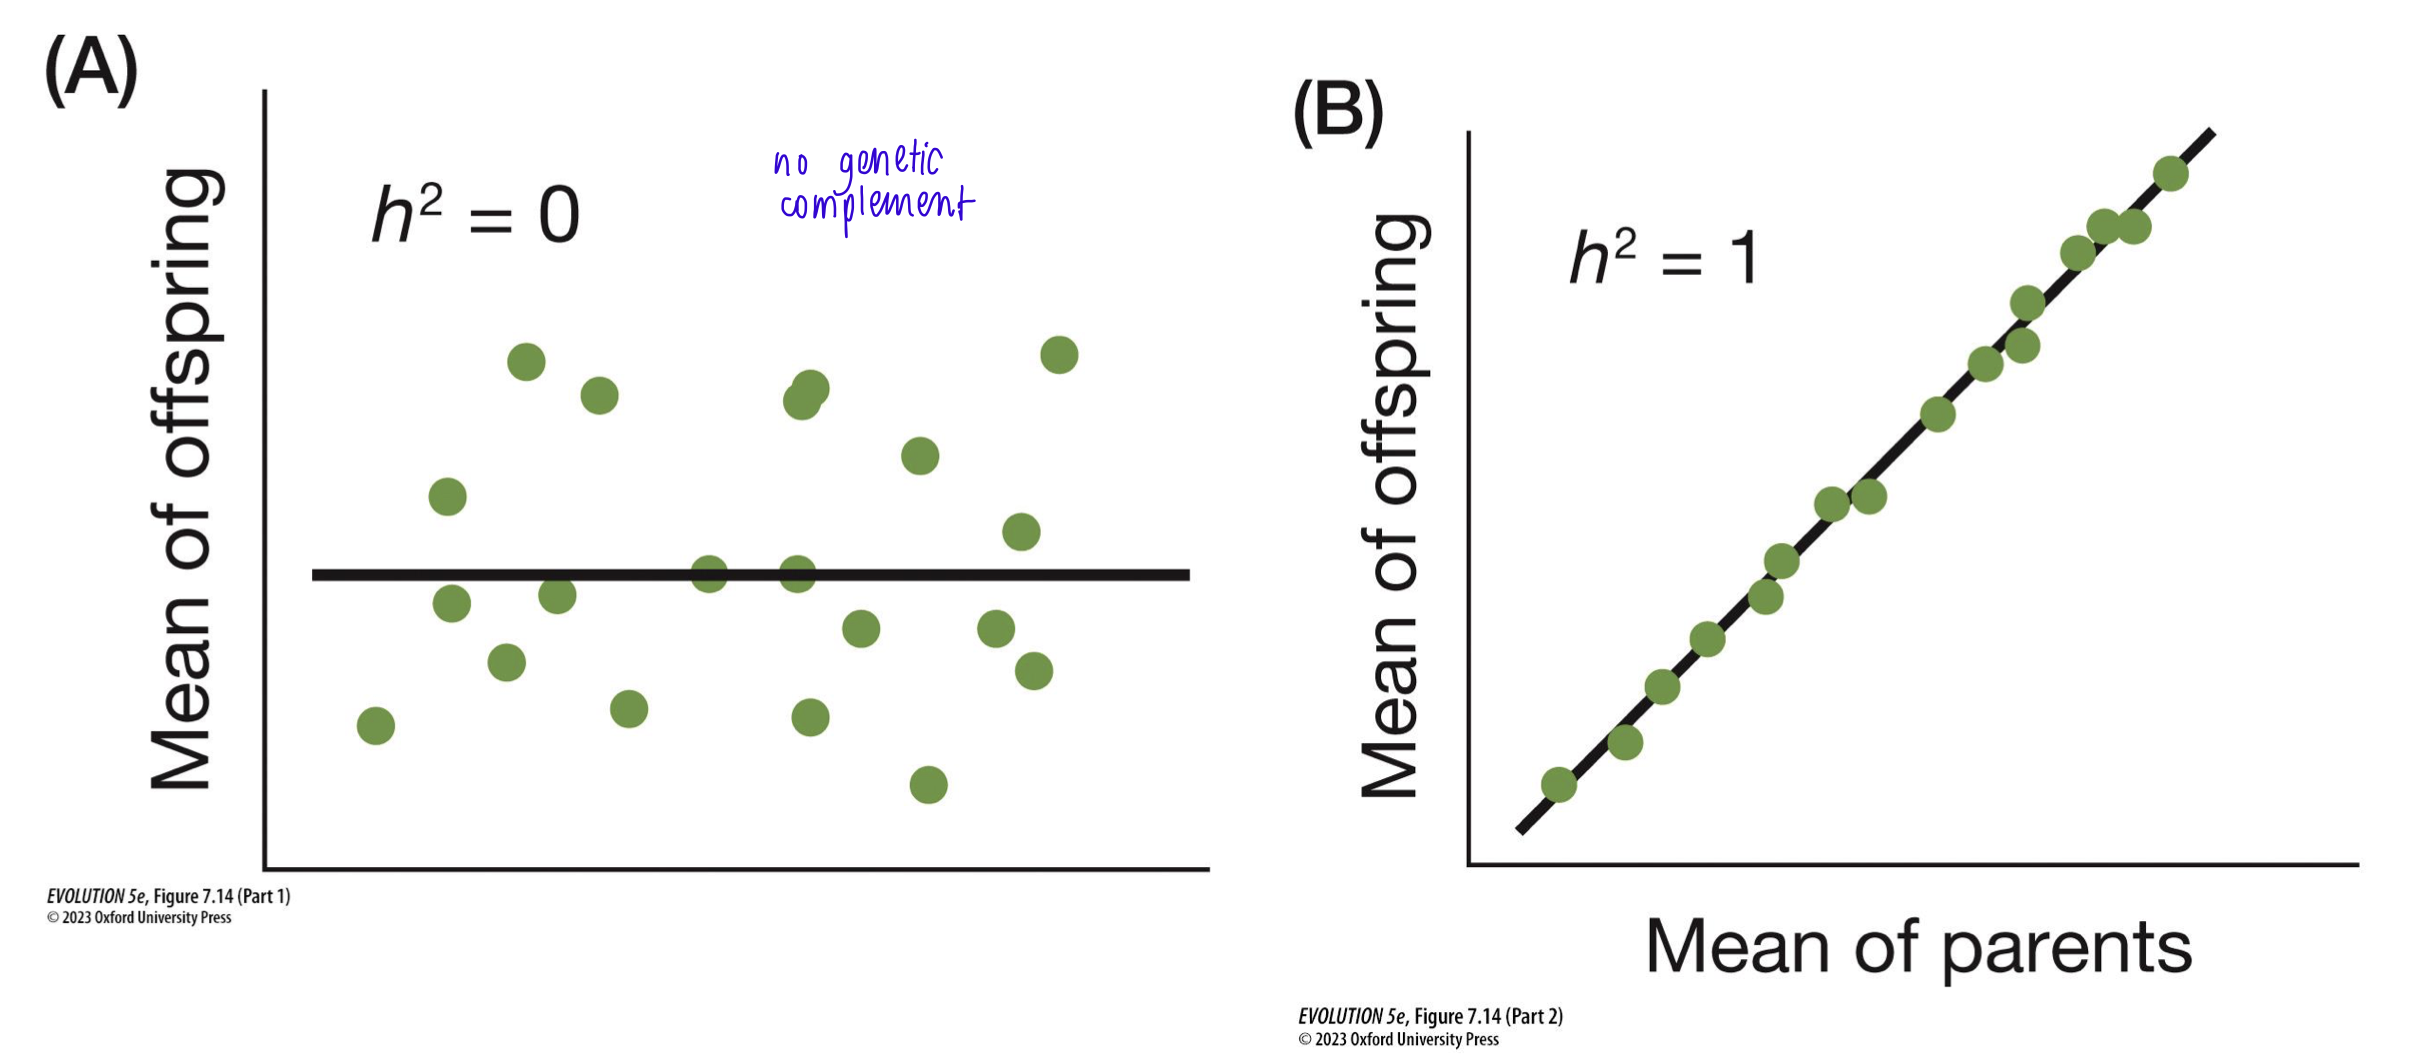
How is h2 determined?
By measuring the correlation between traits in parents and offspring
This can be rigorously measured with a regression analysis, which examines the relationship between the midparent value (average of both parents’ traits), and the mean trait value of the offspring
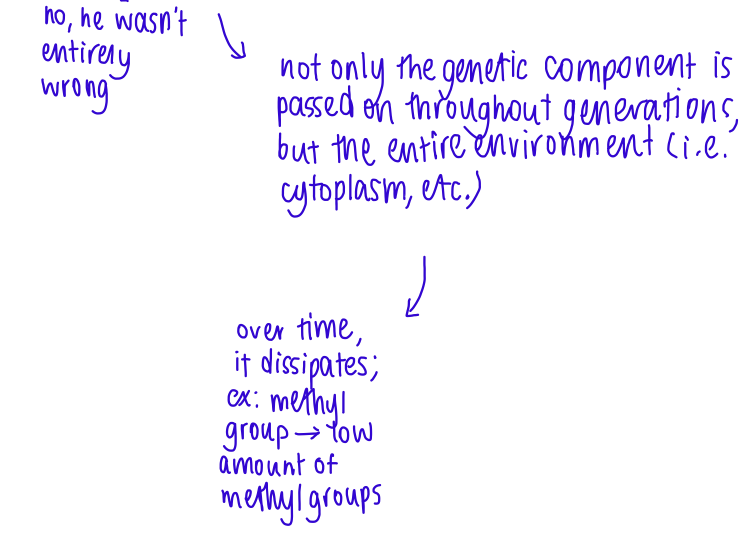
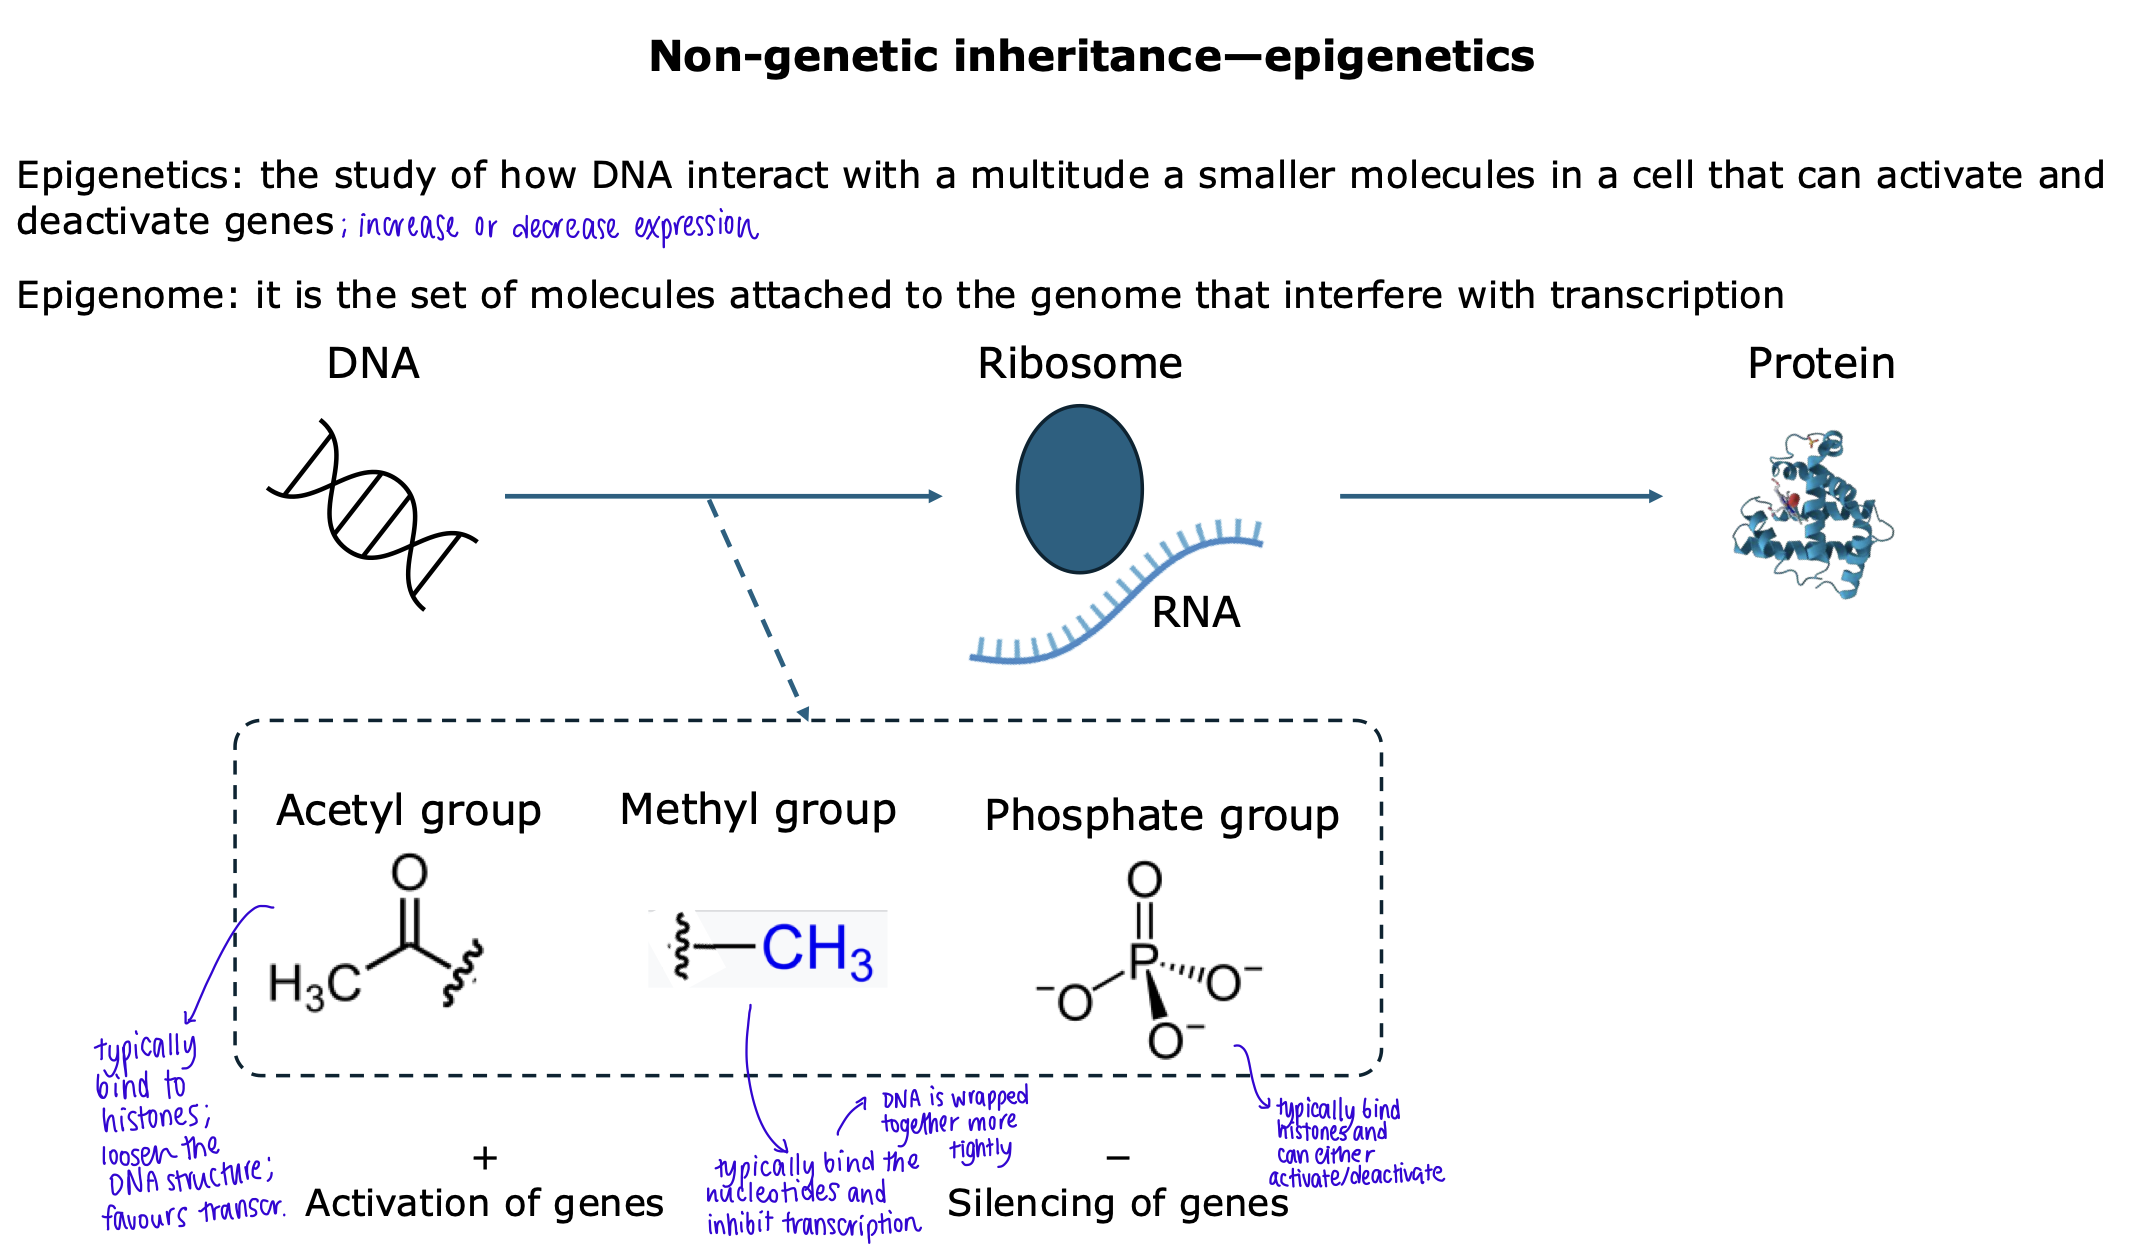
define epigenetic and the epigenome. how are genes silenced and activated?
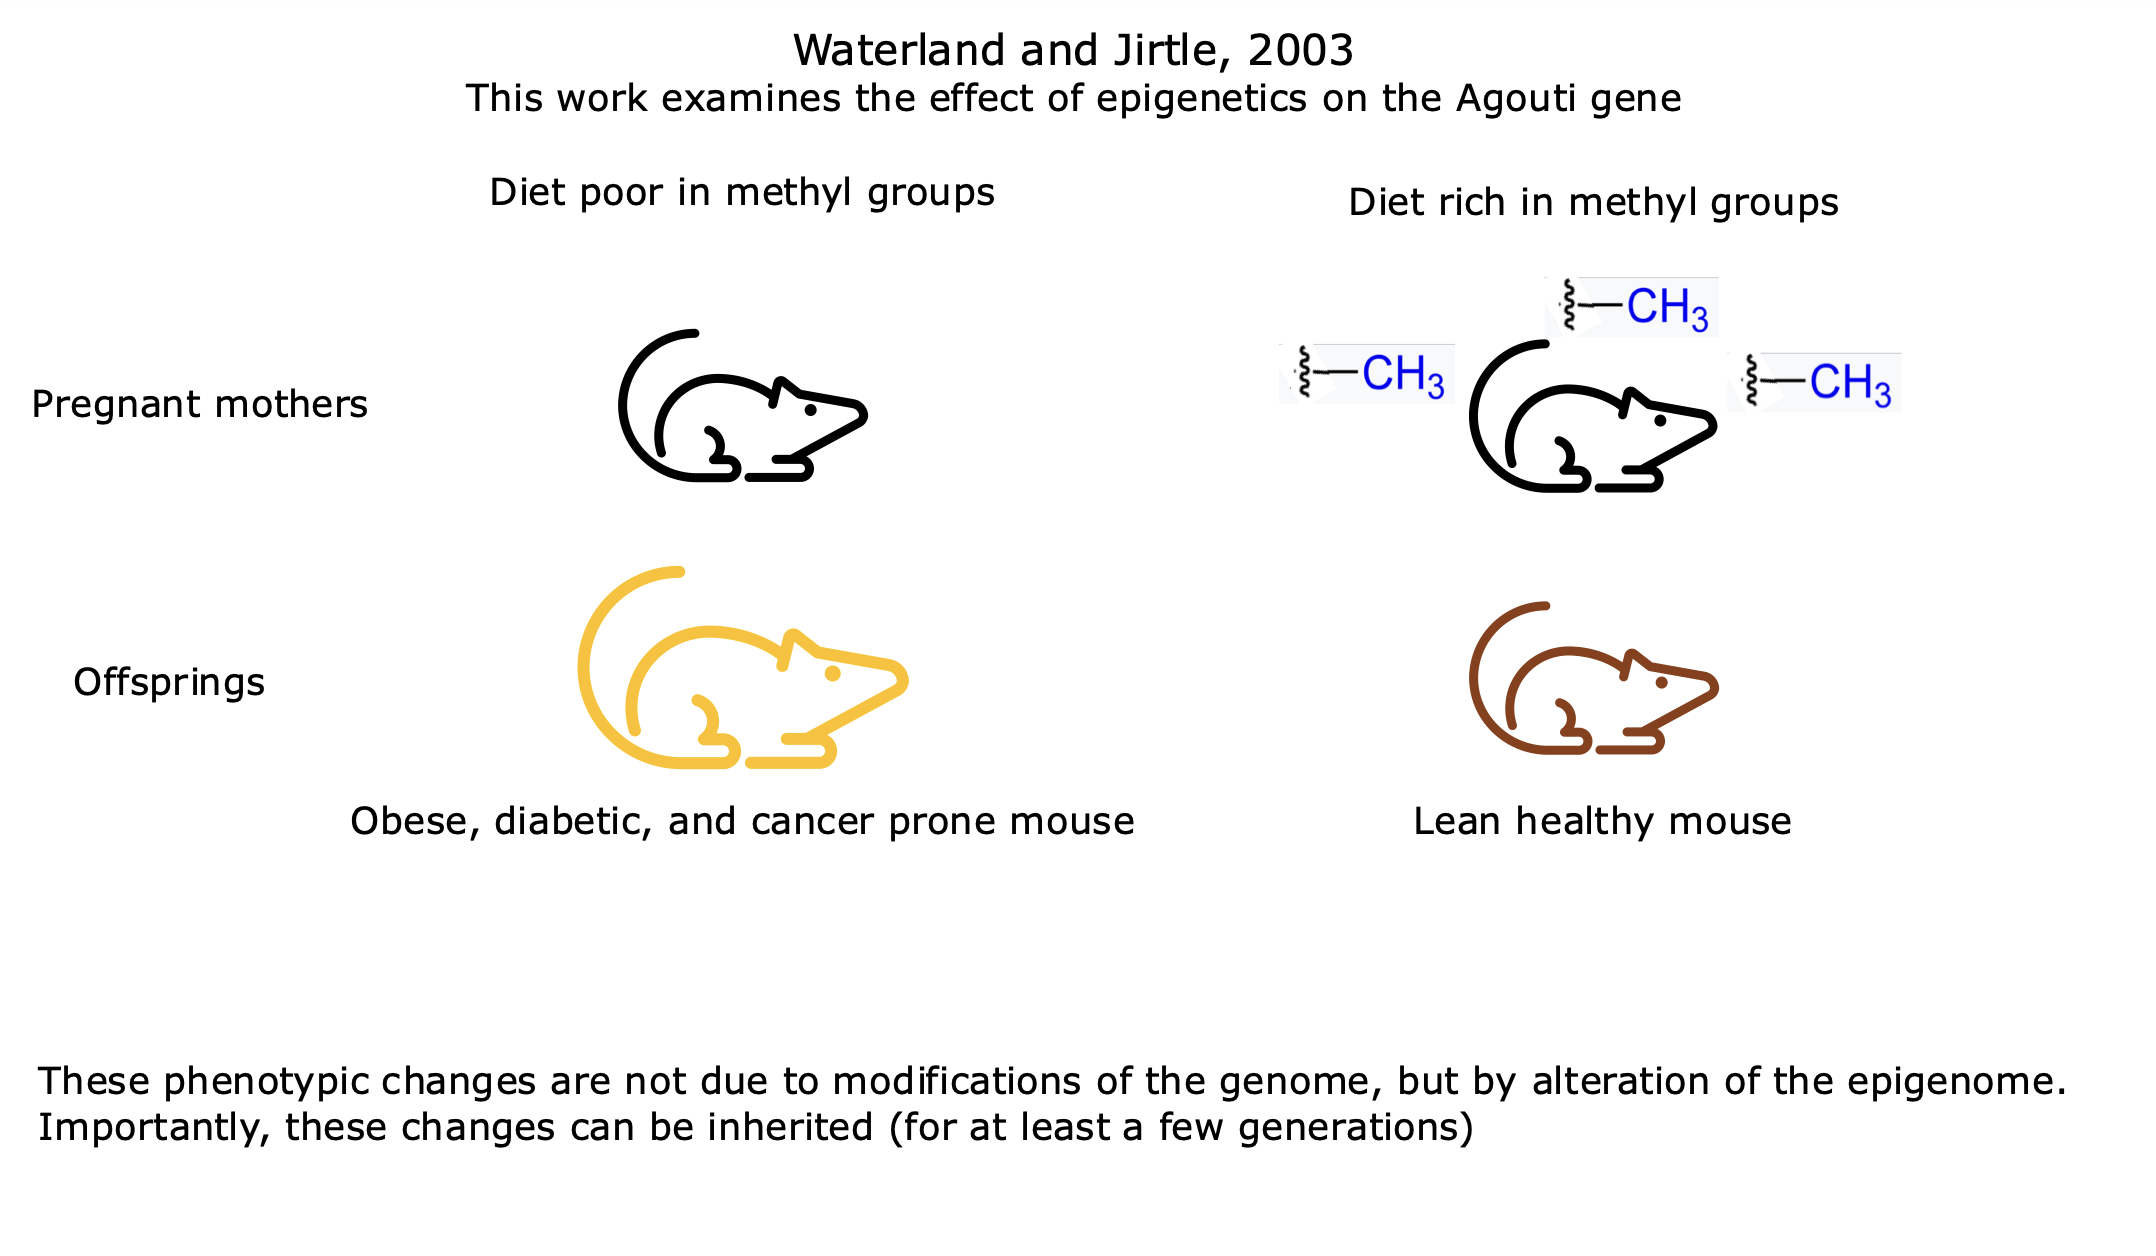
effect of epigenetics on the Agouti gene
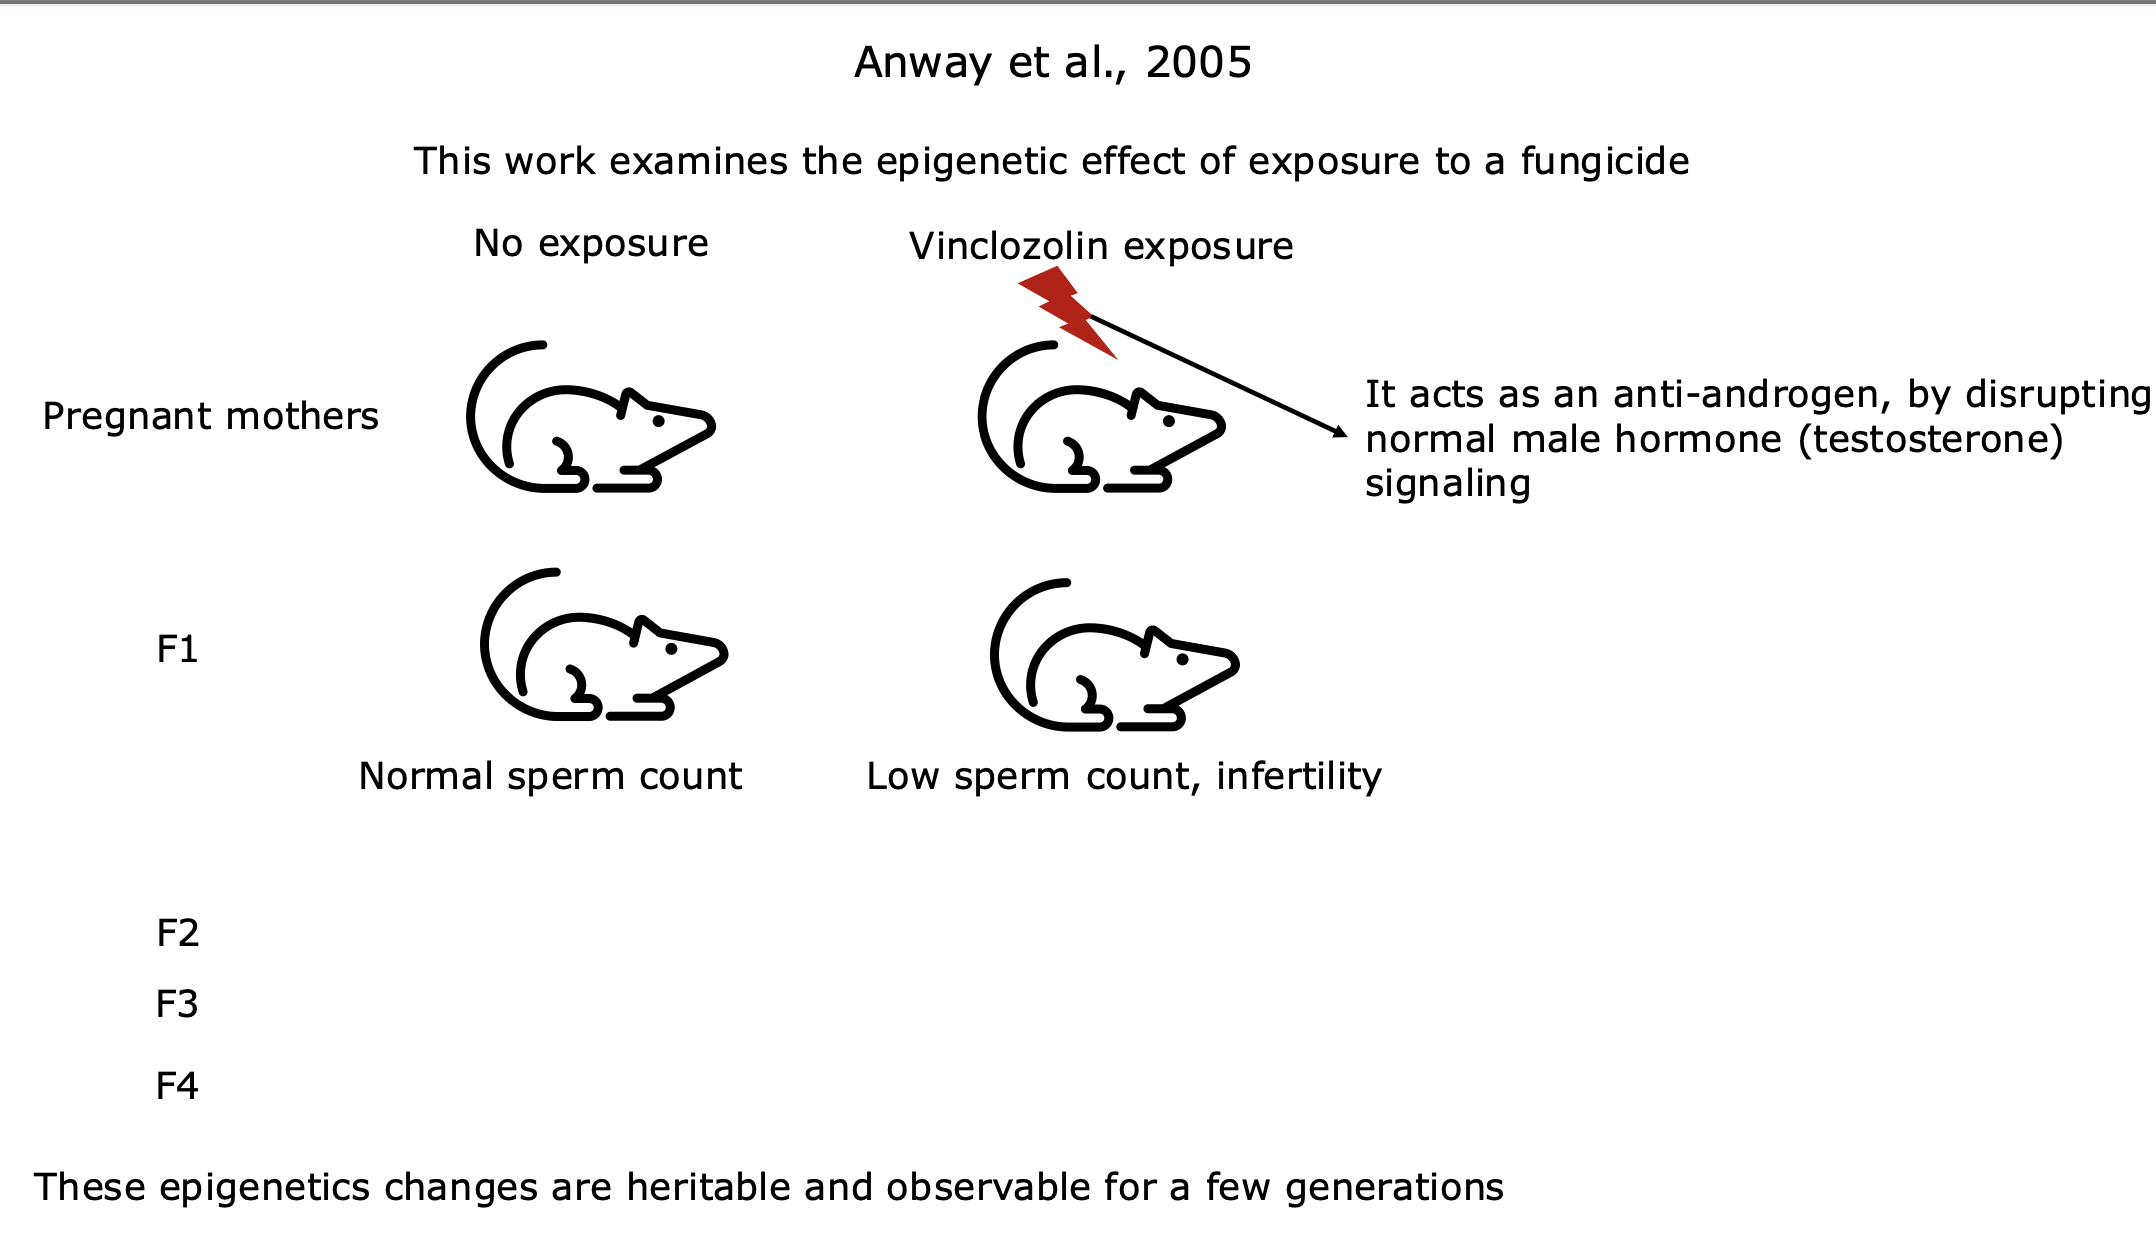
epigenetic effect of exposure to a fungicide
Was Lamarck entirely wrong?