Maths statistics
1/51
There's no tags or description
Looks like no tags are added yet.
Name | Mastery | Learn | Test | Matching | Spaced | Call with Kai |
|---|
No analytics yet
Send a link to your students to track their progress
52 Terms
What is a census?
observes or measures every member of the population
Census advantages and disadvantages
Add: very reliable
Diss: hard or impossible to carry out
Sample advantages and disadvantages
Add: easy to carry out
Diss: not as reliable
What are the random sampling methods?
simple random sampling
systematic sampling
stratified sampling
What is the method for simple random sampling?
Number all items in the population
Use random numbers to select sample
What is the method for systematic sampling?
Number all items in the population
Let 𝑛=𝑝𝑜𝑝𝑢𝑙𝑎𝑡𝑖𝑜𝑛 𝑠𝑖𝑧𝑒𝑠𝑎𝑚𝑝𝑙𝑒 𝑠𝑖𝑧𝑒
Use random numbers from 1 to 𝑛 to select the first item
Choose every 𝑛th item after that
What is the stratified sampling method?
The population will be divided into groups.
Decide how many to sample from each group using: 𝑛𝑢𝑚𝑏𝑒𝑟 𝑖𝑛 𝑔𝑟𝑜𝑢𝑝/𝑛𝑢𝑚𝑏𝑒𝑟 𝑖𝑛 𝑝𝑜𝑝𝑢𝑙𝑎𝑡𝑖𝑜𝑛 ×𝑠𝑎𝑚𝑝𝑙𝑒 𝑠𝑖𝑧𝑒
Use simple random sampling to select the items from each group.
What are the non random sampling methods?
Opportunity sampling (convenience Sampling)
Quota sampling
What is the Opportunity sampling (convenience Sampling) method?
Your sample consists of any items which are available to be sampled.
What is the quota sampling method?
The population is divided into groups. The same proportion of items from each group are included in the sample
Opportunity sampling is used to sample items until the required number from each group has been sampled
What 2 time periods does the LDS cover?
May to October 1987
May to October 2015
When is the correlation negative and when id the correlation positive?
When it tends to 1 it is positive
when it tends to -1 it is negative
0 is no correlation
How to find the regression line pmcc ( r ) using a calculator?
Select statistics mode ‘Menu 6’
Select 2: 𝑦=𝑎+𝑏𝑥
Enter data
Then press ‘OPTN’ and select ‘4: Regression Calc’
Calculator displays 𝑎 and 𝑏 for regression line in the form ‘𝑦=𝑎 +𝑏𝑥’ and ‘𝑟’ the pmcc
What to always start hypothesis testing in correlation with?
𝐻0: 𝜌=0
𝐻1: 𝜌<0 𝑜𝑟 𝜌> 0
steps to hypothesis testing with correlation
Hypotheses
Critical Region
Compare
Conclusion
Equation for mean
𝑀𝑒𝑎𝑛=∑𝑥 / n
Equation for median in non- grouped data
(n + 1) / 2
Equation for median grouped data
n / 2
Name examples of the measures of spread
range
lower quartile
upper quartile
interquartile range
How to use a calculator to be able to calculate mean, standard deviation, variance, median and the quartiles?
MENU 6 (Statistics)
1 (1-Variable)
Enter the data using =
AC then OPTN
2 (1-Variable Calc
Define discreate data
Data which can be counted and has finite values
Define continuous data
Data which can take any value and is measured
What is the mean affected by in coded data?
addition and subtraction
multiplication and division
What is the standard deviation affected by in code?
just multiplication and division
What equation do you need to know for histograms?
FREQUENCY DENSITY = 𝐅𝐑𝐄𝐐𝐔𝐄𝐍𝐂𝐘 / 𝐂𝐋𝐀𝐒𝐒 𝐖𝐈𝐃𝐓𝐇
What number do you use in cumulative frequency?
the upper bound
What shape should a cumulative frequency graph be?
an S shaped curve
What is the area in a histogram proportional to?
the frequency
What units will standard deviation have?
the same units as the data
How do you model binomial distribution?
You can model a random variable 𝑿 with a binomial distribution 𝑩(𝒏,𝒑)
What are the 4 conditions for it to be binomial distribution?
• there are a fixed number of trials, 𝒏,
• there are two possible outcomes: ‘success’ and ‘failure’,
• there is a fixed probability of success, 𝒑
• the trials are independent of each other
How to use your calculator to find probabilities in binomial distribution?
MENU (7) DISTRIBUTION
For = probabilities (4) Binomial PD P-Probability
For ≤ probabilities (↓1) Binomial CD C-Cumulative
Then (2) Variable
Enter your data using (=)
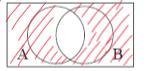
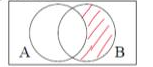
Draw A’ U B’
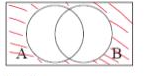
Draw A’ N B’
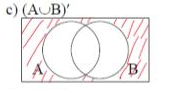
Draw (A U B)’
Draw (A N B)’
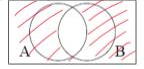
Draw A N B’
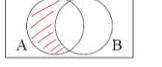
Draw A’ N B
What is true for statistically independent events?
𝑷(𝑨∩𝑩)=𝑷(𝑨)×𝑷(𝑩)
What is true for mutually exclusive events?
𝑷(𝑨∩𝑩)=𝟎 𝑎𝑛𝑑 𝑷(𝑨∪𝑩)=𝑷(𝑨)+𝑷(𝑩)
What is a mutually exclusive event?
When events have no outcomes in common
What is a statistically independent event?
When one event has no effect on another
What does 𝑷(𝑩|𝑨) mean?
the probability that 𝐵 occurs GIVEN that 𝐴 has already occurred.
𝑷(𝑩|𝑨)=
𝑷(𝑨 N B) / 𝑷(𝑩)
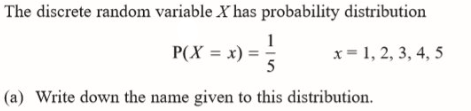
discrete / UNIFORM distribution
How is normal distribution displayed.
X~N(mew,varience)
What does mew in standard deviation represent?
the mean
What percentage of the data is within 1 standard deviation of the mean?
68%
What percentage of the data is within 2 standard deviations of the mean?
95%
What percentage of the data is within 3 standard deviations of the mean?
99.7%
What does Z in normal distribution mean?
its the standard normal
What is the mean and variance of the standard normal
mean= 0
variance= 1