Microeconomics-Chapter 3-Supply
1/28
There's no tags or description
Looks like no tags are added yet.
Name | Mastery | Learn | Test | Matching | Spaced |
|---|
No study sessions yet.
29 Terms
individual supply
the Quantity firm plans to sell at each price; the amount you plan to sell at a given price is your quantity supplied at that price
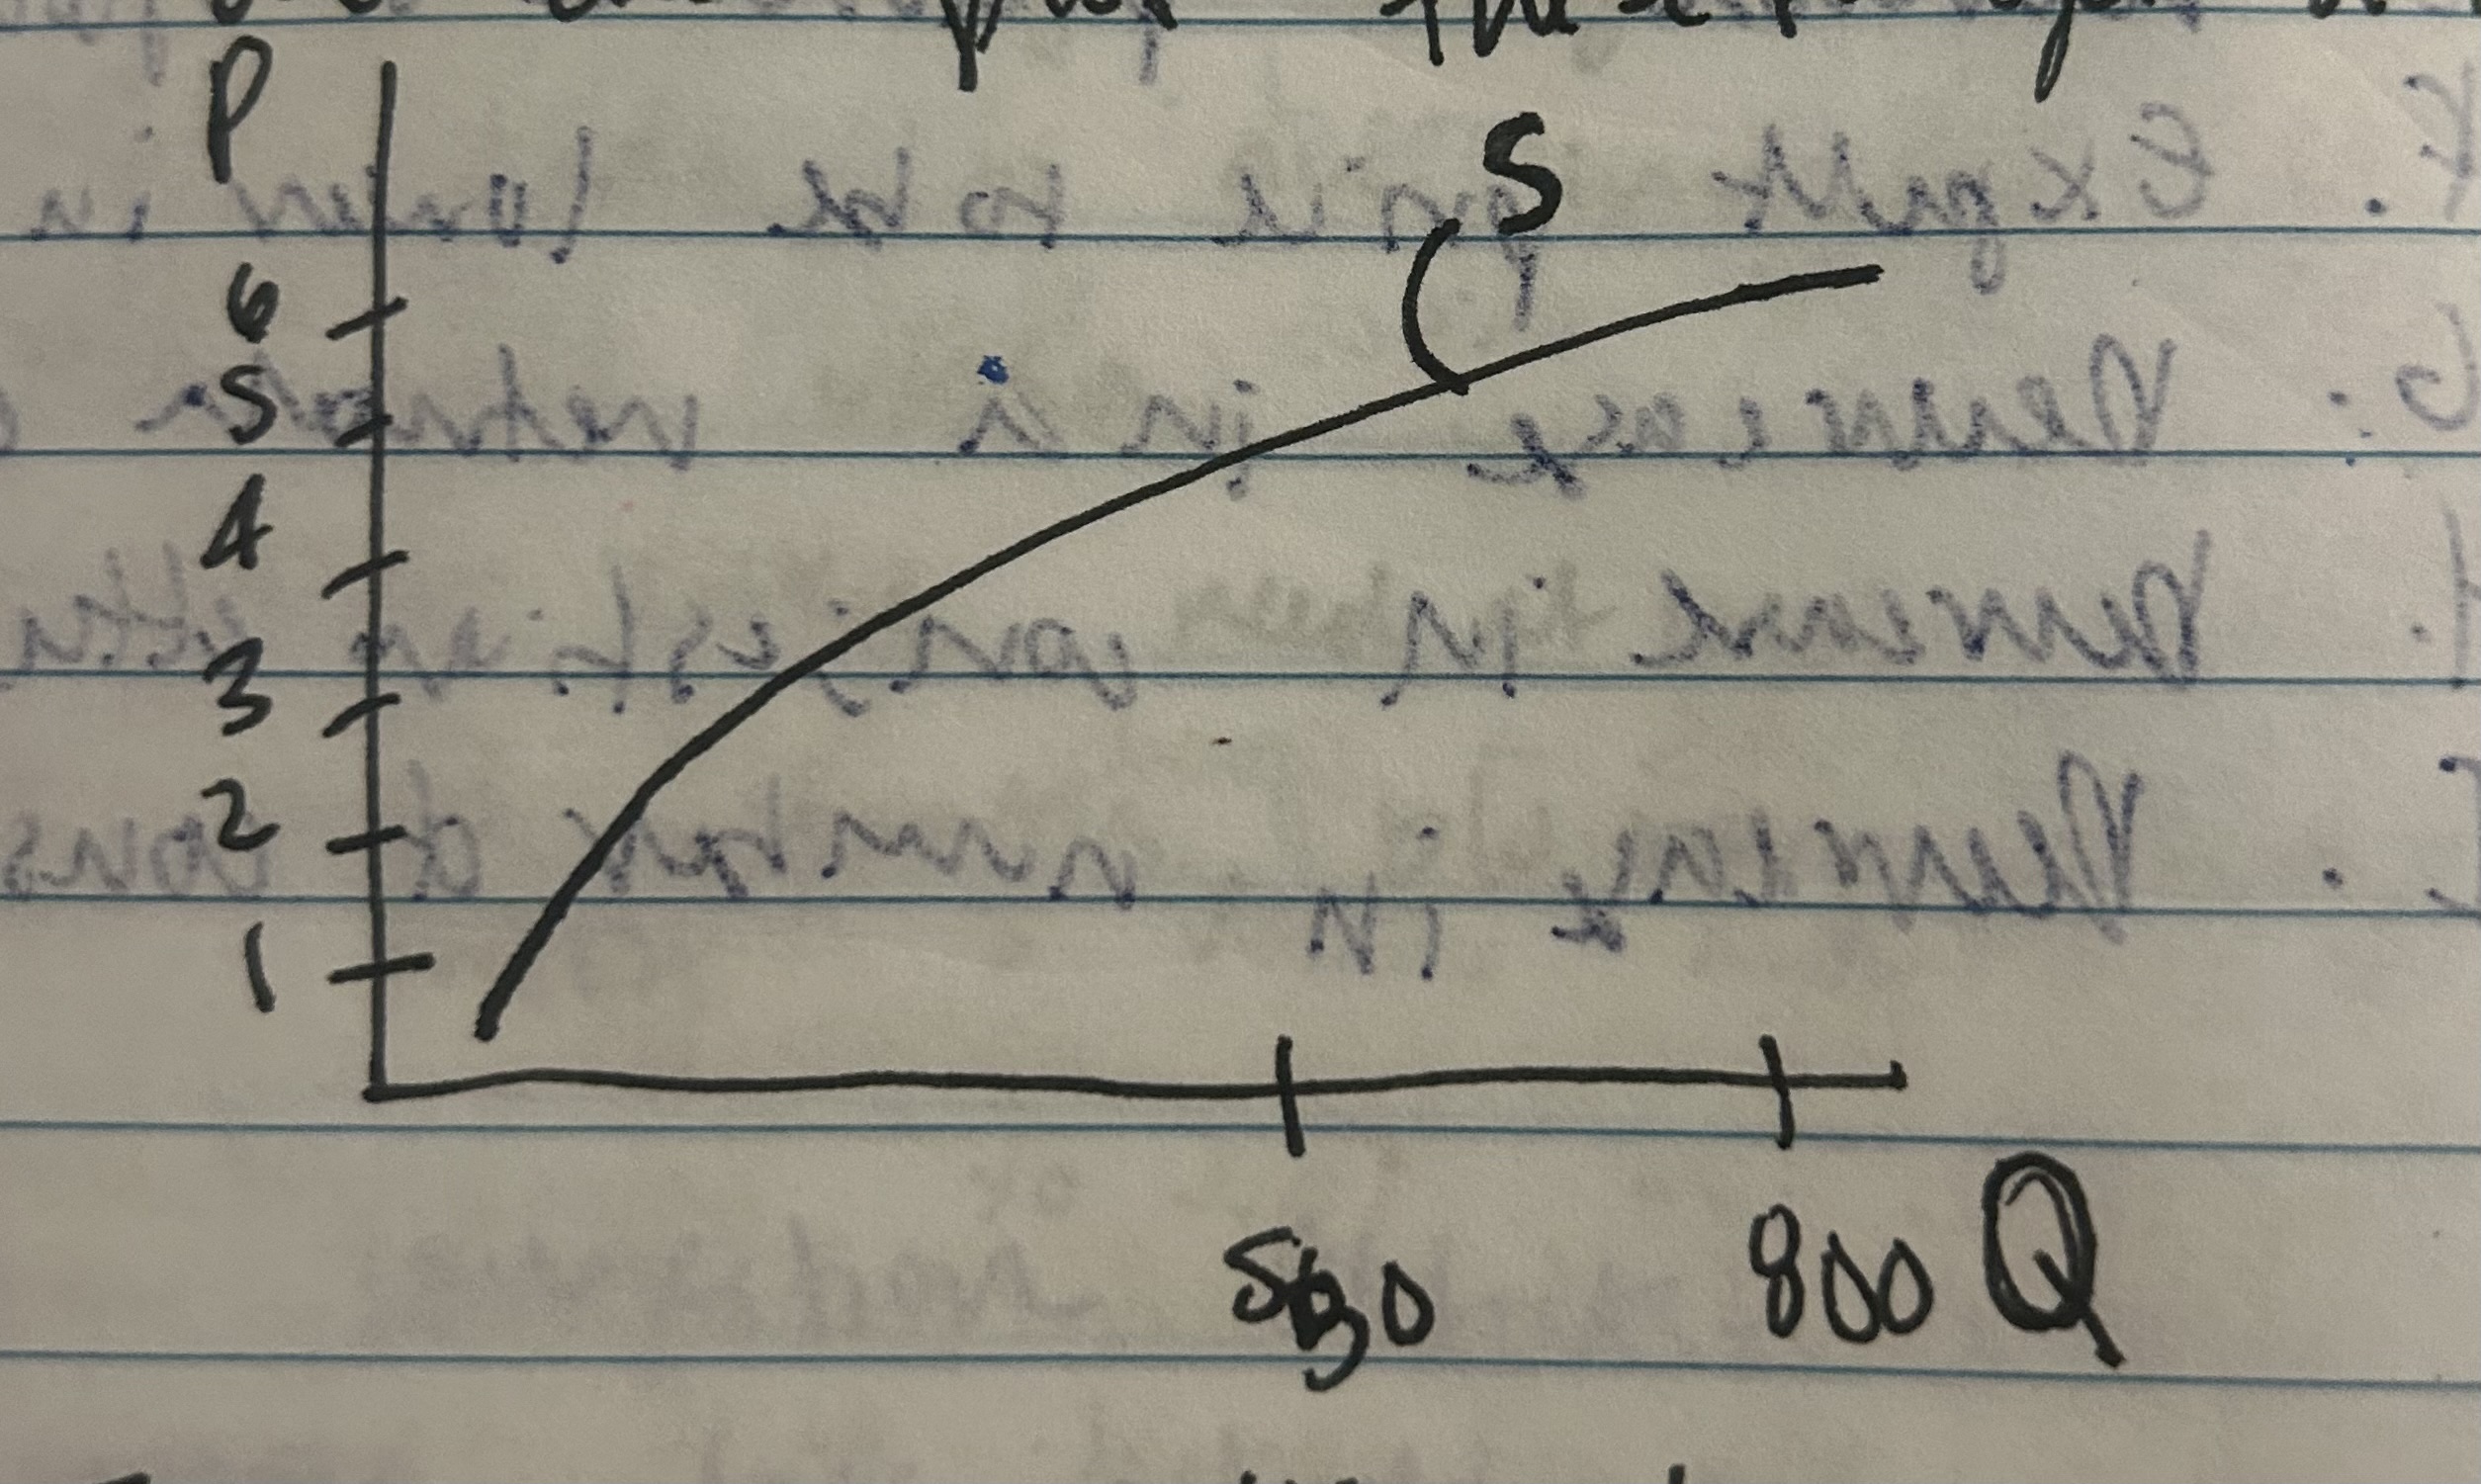
Example of Quantity Supplied
Cups of Hot Chocolate
Price: Quantity:
$6 800
$5 550
$4 350
$3 200
$2 125
$1 50
And can plot a supply curve, this has a positive slope upward => positive relationship between price and quantity.
Characteristics of a perfect competition:
-many buyers and sellers
-all sellers produce an identical good
-these imply that individual firms are price takers
Example:
-stock in a company
-commodities
Ex:oil, gasoline, gold, aluminum (many agricultural products), many agricultural products
Price takers
Individual firms, this means they should only sell at the market price and they can sell as much as they want at the market price
Market Price
given and based on market demand and market supply, Demand curve is downward slope so why can a firm sell as much as they want at market price because each firm is so small in relative of the size of the market, so if they change, quantity to it does not affect the price.
Why will a firm only decide to sell at price equal to market price?
If a firm sets price higher than the market price, they would not be able to sell any quantity. If a firm sets price lower than the market price, they will unnecessarily lose out on money so firms choose to set price = market price.
Variable Costs
costs that vary with amount of output your produce Ex:Cup, straws, cocoa powder Marginal Costs include variable costs but not fixed costs Ex:How many loaves of bread to produce
Fixed Costs
Costs that do NOT vary with amount of output Ex: Rent
Example of Supply and Marginal Costs
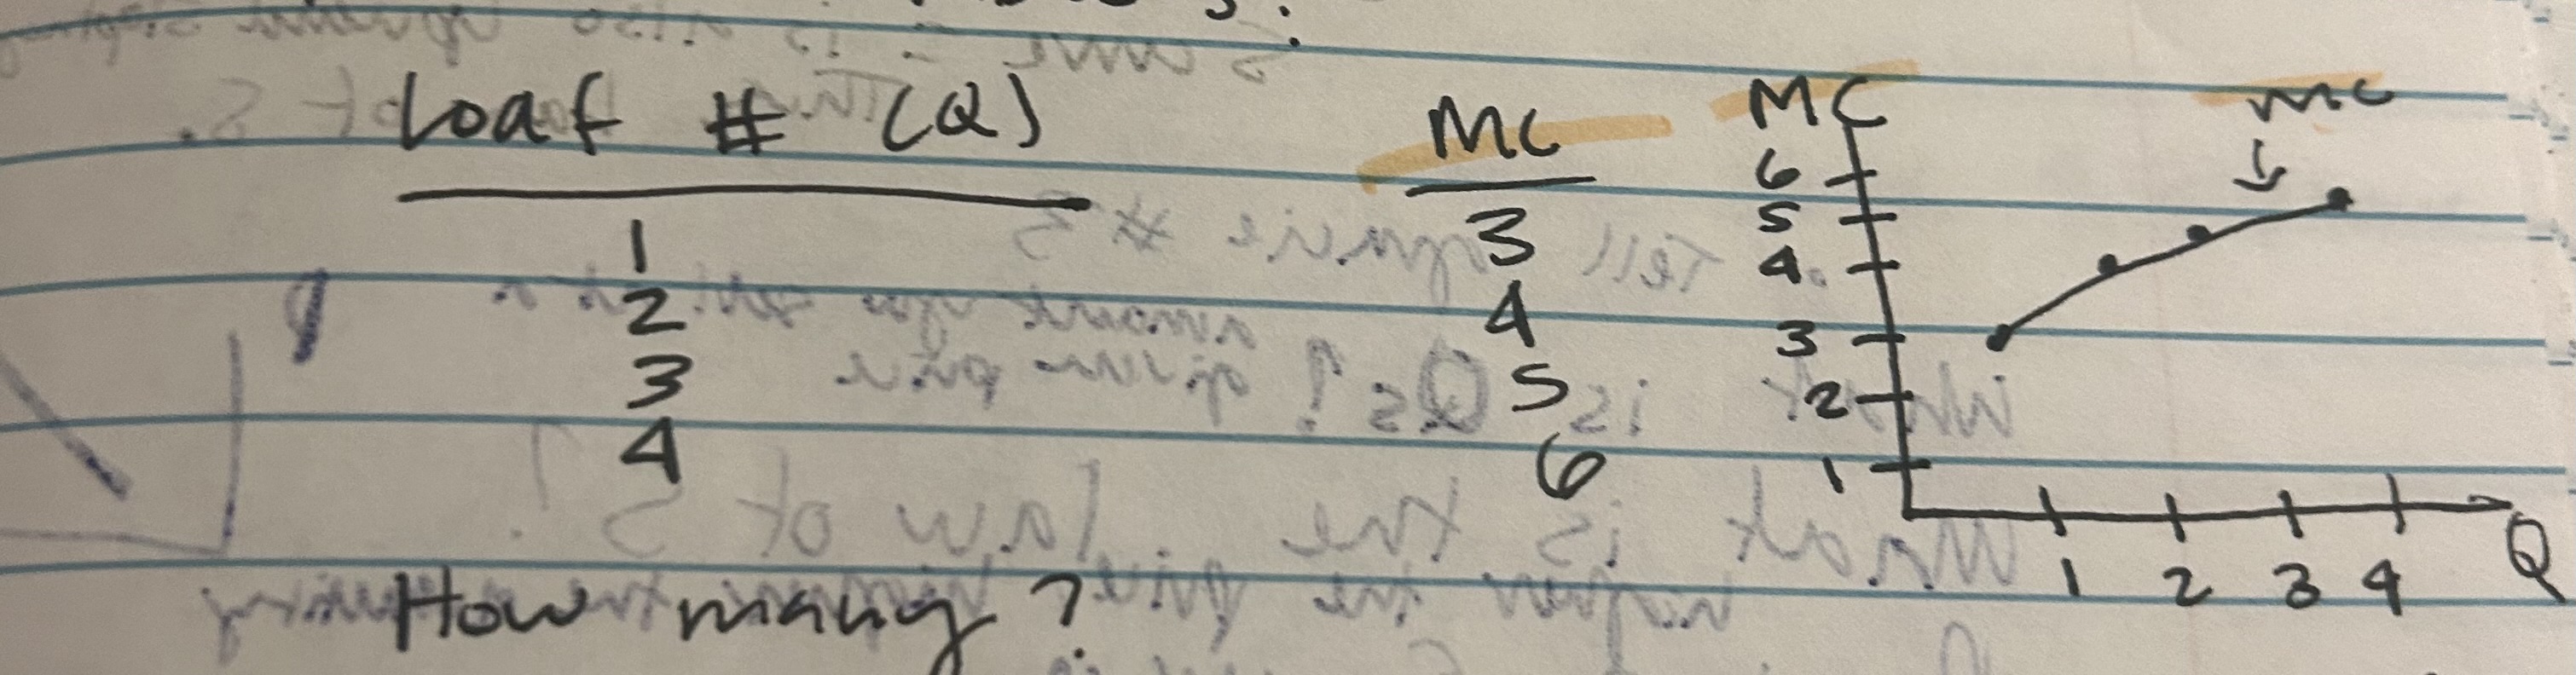
How many loaves of bread to produce?
Firm’s MC table’s:
Loaf #(Q): MC:
1 3
2 4
3 5
4 6
The marginal benefit of an extra loaf to the seller=price
P=MB
For each unit?
1> MB >= MC
P>=MC
Keep producing unit P=MC
Suppose P=$5 Then Qs= 3
This is one point on the demand curve
Repeat with other prices:
If P=3$, Qs=$1
P=$4, Qs= $2
P=$5, Qs= $3
P=$6, Qs =4
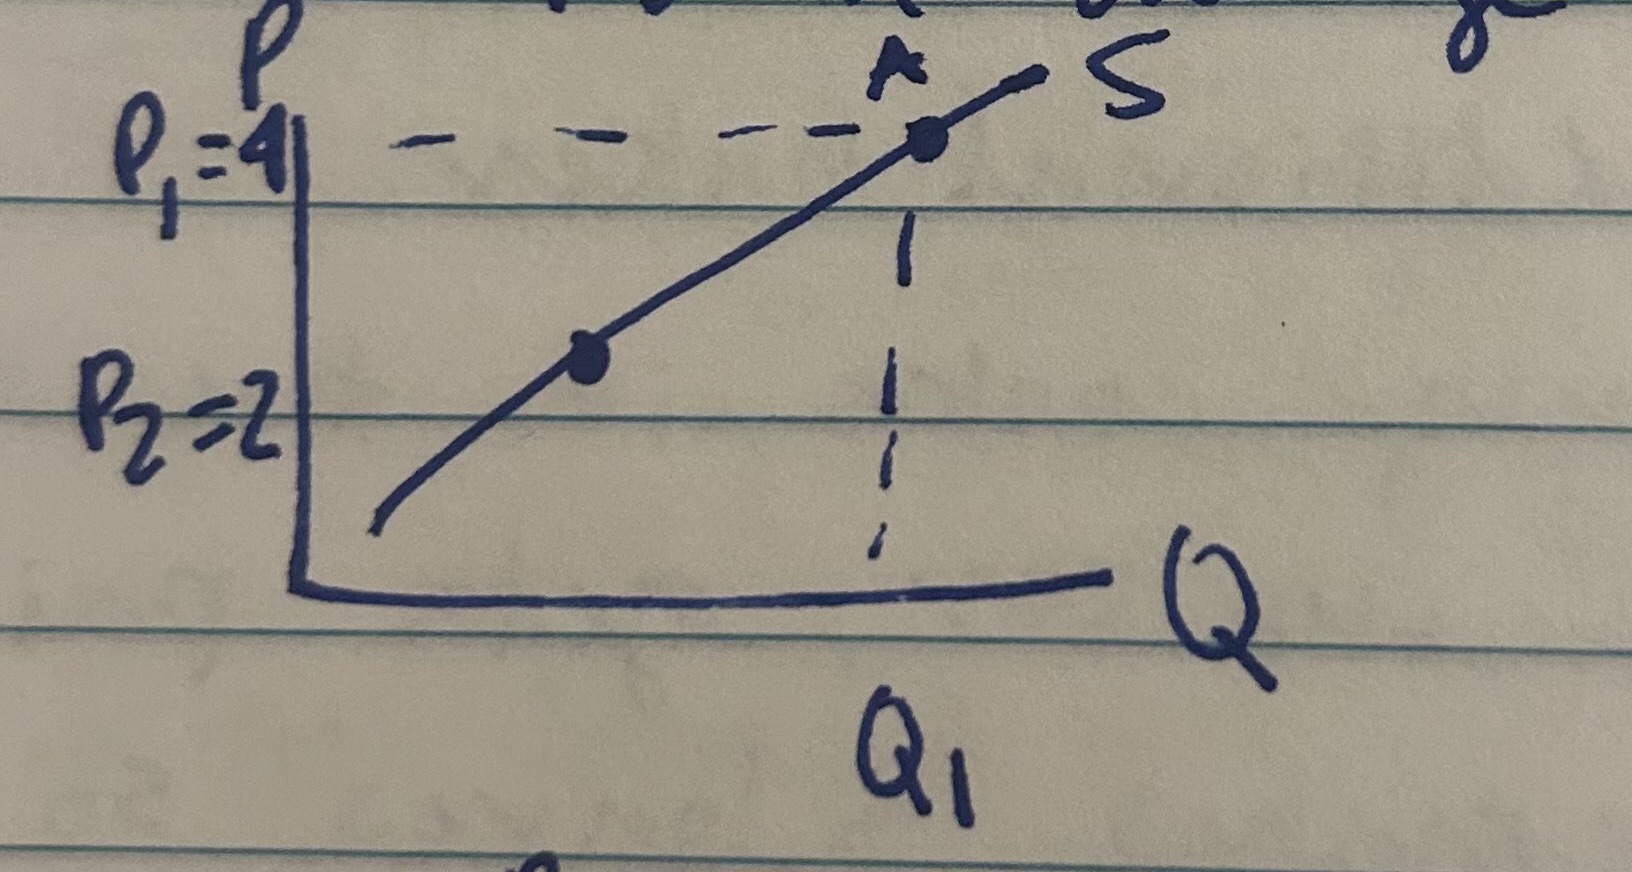
We can plot to get a supply curve and find that marginal cost=supply curve
For a given quantity, the supply curve gives you the least you are willing to accept, the least you are willing to accept is also your marginal costs
Increasing Marginal Costs
MCs rise as we produce more output, so MC is upward sloping, S curve=MC thu, the law of supply
Law of Supply
the higher the price, the higher the quantity
Diminishing marginal product
additional units of an input will add less and less to the output
Input
an input into a production process that produces outputs Ex: Flour is an input into making bread
Example of input and output in Supply
Bread
Output- bread input
First Baker: makes 3 loaves
Second: 2 additional loaves of bread
Third: 1 additional baker
We see to many cooks in the kitchen
Assume each worker, gets paid $30/hour.
First baker makes 3 loaves so 10$/loaf
Second:15$ a loaf
Third:$30/Loaf
Another aspect of why there is increasing marginal costs
may have to pay higher transportation costs to input further away inputs
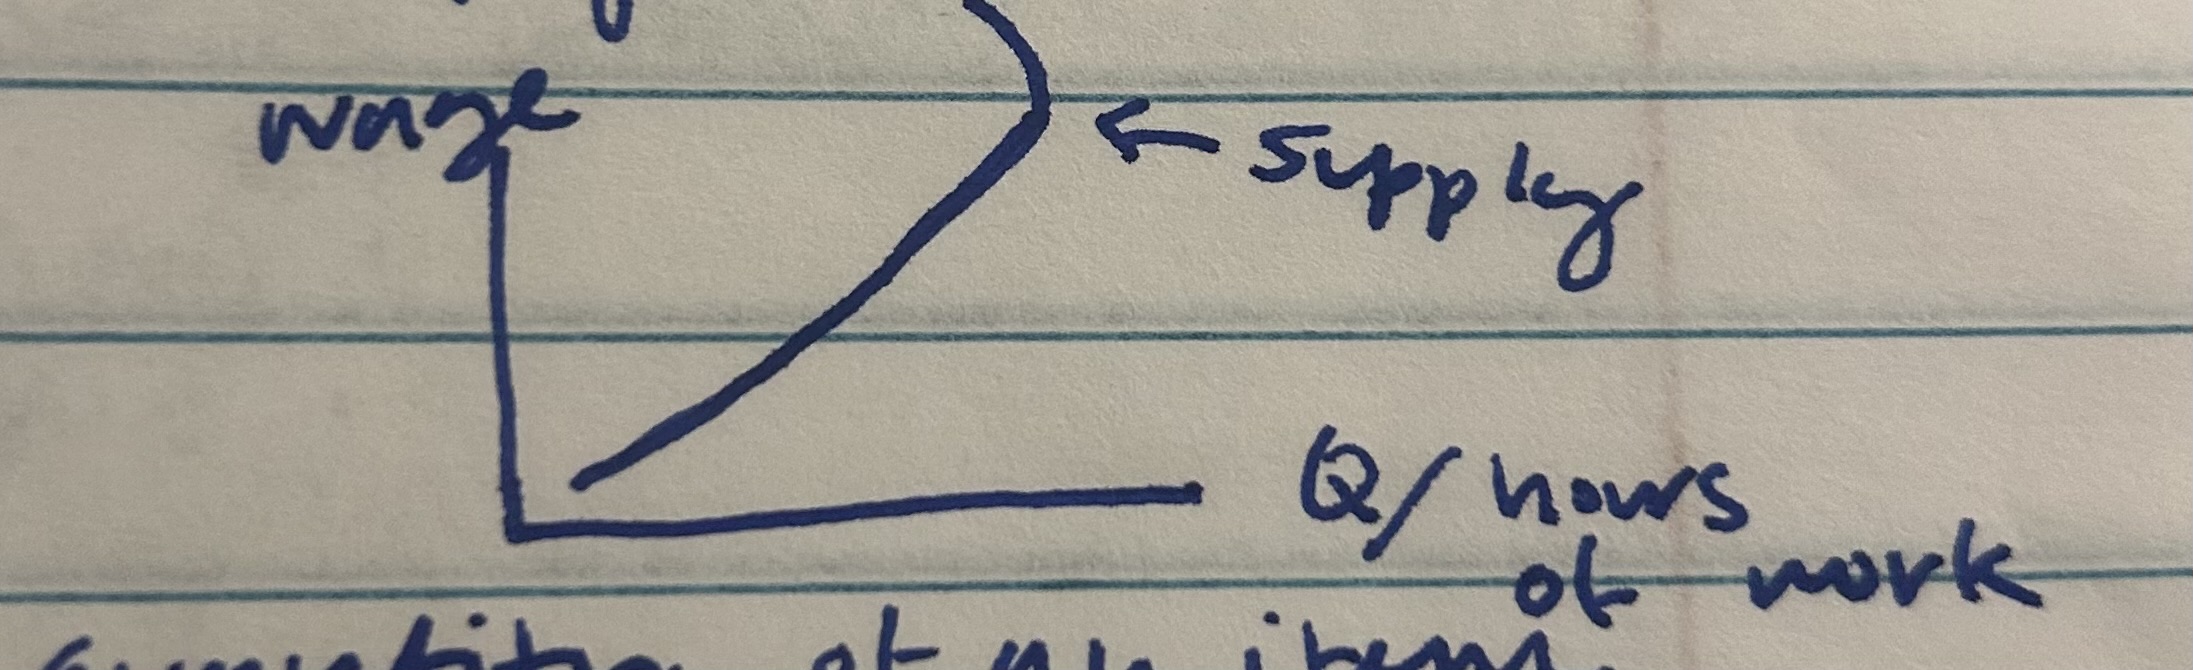
Miscellaneous Point for increasing in marginal costs
when you work, you supply labor, the labor supply curve bends backwards
Market Supply
the total quantity if an item that produces in a market plan to sell at each price, for each price, sum up the Quantity supplied
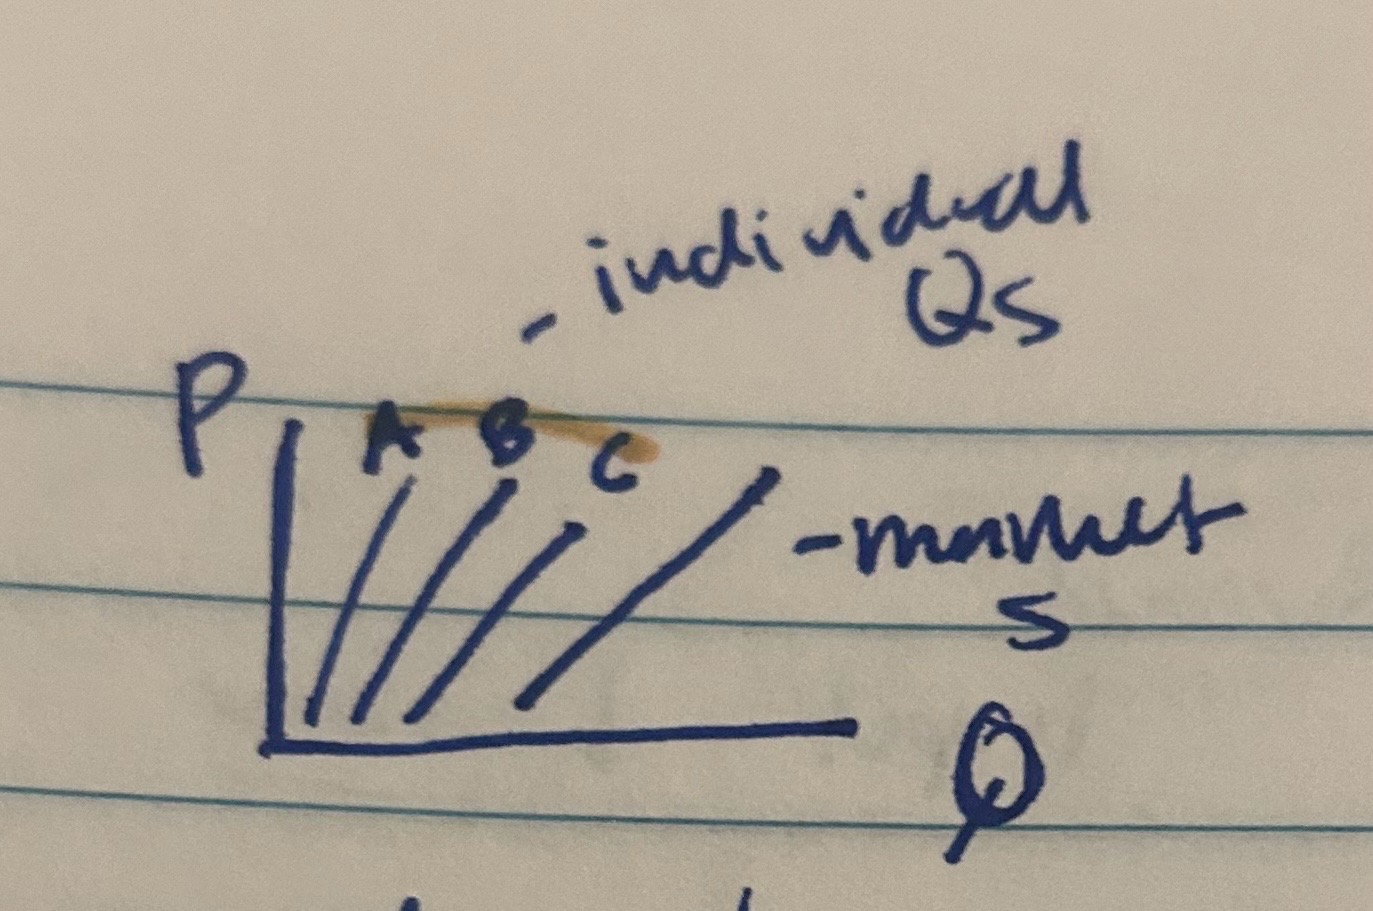
Example of Market Supplied
Price Qs Firm A Qs Firm B Qs Firm C = Market S
6 800 1200 4000 6000
5 550 1000 3500 5050

Movement along the S curve
The only thing that causes movement along the curve is a change in price
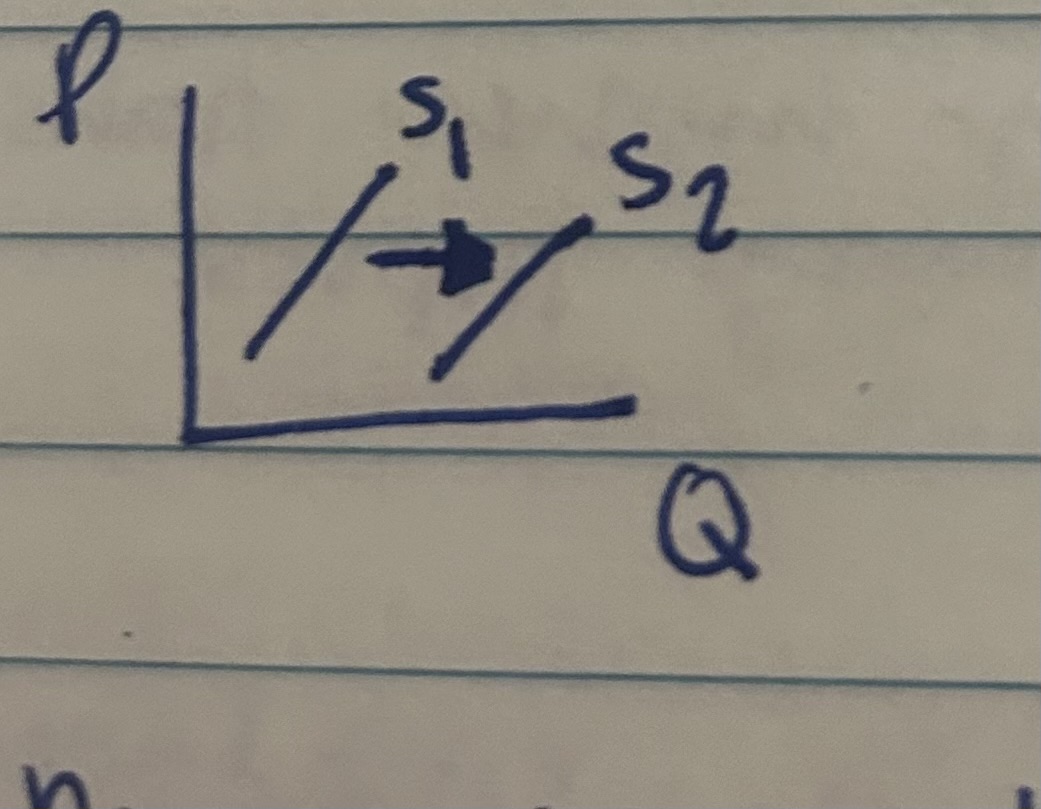
Increase in Supply
S(up arrow), produce more at every price, S curve shifts to the right
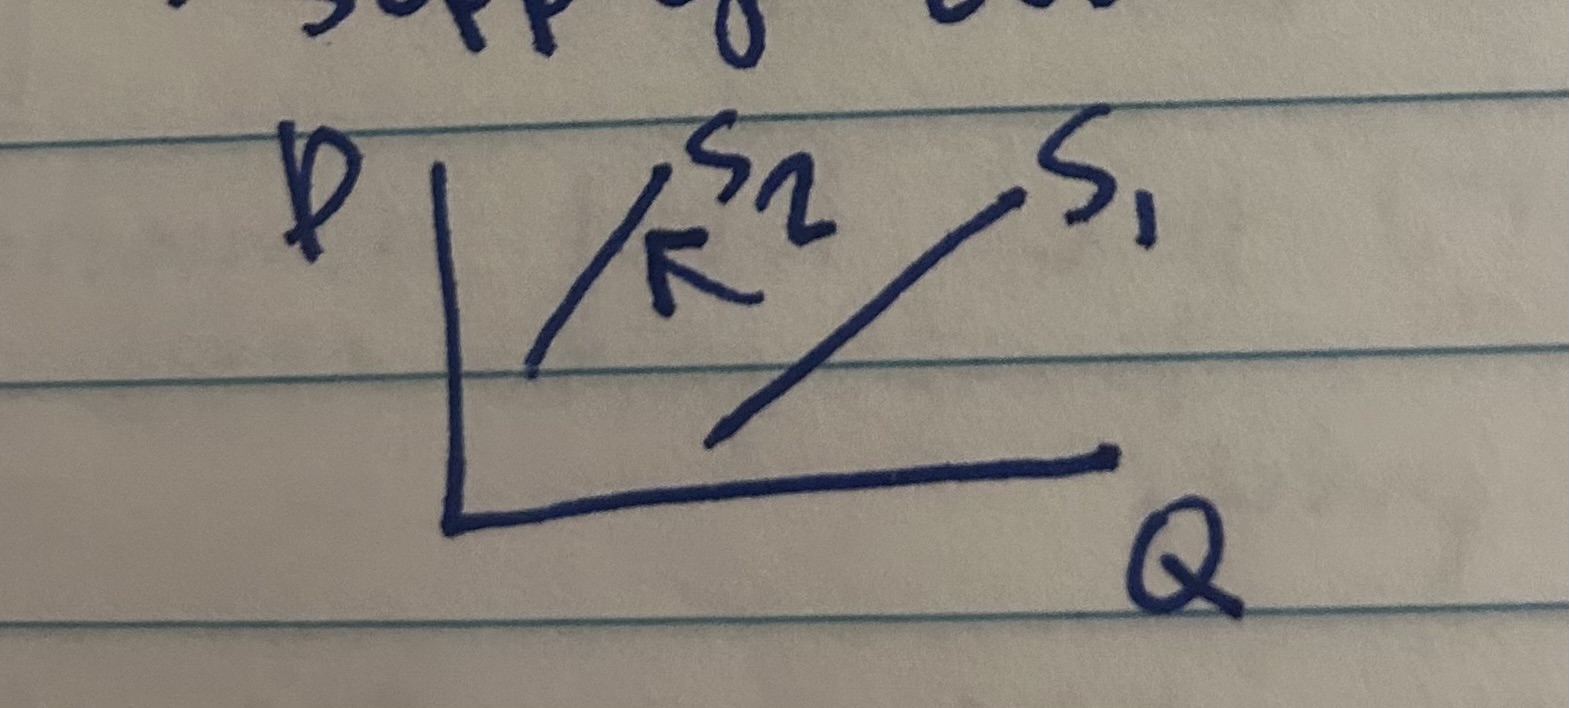
Decrease in Supply
S(down arrow), produce less at every price, supply curve shifts left. When S curve shifts right, it technically shifts downward
What happens when a demand curve shift to the right?
It technically shifts upward because of the slope of the lines
Things that cause Shifts in Supply
Input prices, technology and productivity, prices of related outputs, producer expectations about future prices, type and number of sellers
Input prices
lower input prices lead to lower marginal cost, this means the supply curve shifts to the right and vice versa Ex:oil price falls, supply curve shifts to the right
Technology and Productivity
Better technology and higher productivity, allows films to produce some output with fewer inputs(or more output with some inputs), this lowers the MC of production so supply curve shifts to the right Productivity- if bad weather or pest infestation farmers crop production is less productive so curve shifts to the left
prices of related outputs
A. Substitutes in Production B. Compliments in Production
producer expectation about future prices
If producer expects the price they can sell goof to increase in the future, they will decrease in the supply today, Supply curve shifts to the left.
Type and number of Sellers
(market supply) more sellers in the market→ Supply curve shifts to the right
Miscellaneous shifts in the supply curve
war, natural disasters, government (something is banned, supply goes to zero)