bio iq final prep - exam 1 (biodiversity to stats)
1/47
There's no tags or description
Looks like no tags are added yet.
Name | Mastery | Learn | Test | Matching | Spaced | Call with Kai |
|---|
No analytics yet
Send a link to your students to track their progress
48 Terms
biodiversity
total number of species in an environment
where do you find high diversity?
tropical areas
where do you find low diversity?
polar environments
ecology
the study of how individuals interact with others of their own species
how they interact with individuals of different species
how these interactions can change depending on the physical and biotic environment
intraspecific interaction
interactions between individuals of the same species
they compete, cooperate, reproduce
intraspecific competition is more intense, they are fighting for the same resources
interspecific interactions
interactions between individuals of different species
compete, mutualism, predation, parasitism
geographic range
the geographic boundaries occupied by a species
habitat
the array of physical and biological factors present in an area that permit a specific species to live there
niche
the ecological role of a species
generalist
can live in a variety of settings or eat a broad range of foods
more likely to shift their geographical range to keep up with climate change
specialist
can live only in a limited set of conditions or has a restricted diet
more sensitive to habitat loss
organismal
individuals that are capable of breeding with one another
population
individual of the same species living and interacting with each other
species
individuals that are capable of breeding with one another and are reproductively isolated from other groups
adaptation
how well-suited an individual is to its environment
fitness
how successful an individual is in passing genes on to the next generation
genotype
an individual’s genetic makeup
phenotype
an individual’s observable characteristics resulting from the interaction of its genotype with the environment
a better adapted phenotype will have higher fitness
evolution by natural selection
a change in genotype frequencies in a population over generations because of differences in the survivorship and/or reproduction of their phenotypes
not all populations experience selective pressure
not all species have the same length of time per generation
sexual reproduction creates new combinations of genes and mutation creates new alleles
agents of natural selection
typically, an external force or event that effects survival and/or reproduction
drought and aridification
change in precipitation regime
change in water pH or temp
presence of a parasite or disease
change in soil chemistry
requirements for evolution by natural selection
there must be variation in the population
that variation must be heritable (genetically-based)
that variation must affect fitness
constraints on adaptive evolution
mutations are random with respect to fitness—just because a mutation would be very advantageous or maladaptive does not make it more or less likely to appear
tradeoffs are too costly
physical or chemical constraints
selection is too rapid relative to generation time…or selection is too variable
what are species going to do in response to a rapidly (and erratically) changing climate?
adjust: a flexible change in behavior or phenology that is not genetically based
adapt: evolve to be better suited to the new conditions
migrate: move with their preferred climate
extinct: die
phenology
period of activity, timing of life’s major events (growing, reproducing, surviving)
phenological shift
a temporal shift in phenology
phenological match
the alignment of penologies of two interacting species
phenological mismatch
the misalignment of phenologies of two interacting species
sensitivity of populations to phenological mismatch depends on
the importance of the interaction: depends on how sensitive the species’ demography is to the vital rate affected by the interaction
the details of shift in the phenologies:
the temporal breadth of overlap in the interaction
the amount of shift by one (or both) species
tip of the proverbial iceberg in terms of how phenological shifts can alter ecological interactions and outcomes
apex predators
meso predators
herbivores and pollinators
plants
mutualism
reciprocal exploitation between species in which the net effect is beneficial for both despite costs
goals of all analyses
to see if there is a relationship between two measurable things
normal distribution
a probability distribution that is symmetric about the mean
data near the mean are more frequent in occurrence then data far from the mean
most statistical test assume that the data are distributed in this way
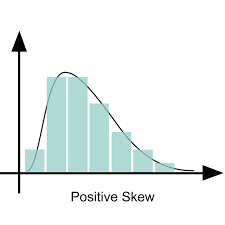
positive skew
skewed to the right
negative skew
skewed to the left

variance
measures the average degree to which each point differs from the mean and is calculated as the average of the squared difference of each data point from the mean
standard deviation (SD)
the spread of a group of numbers from the mean and is calculated as the square root of the variance
standard error of the mean (SEM)
is the SD divided by the square root of the sample size (n)
the t-test
tests whether the means of 2 populations are significantly different from each other
what does the test statistic tell us?
the magnitude of the effect
what does the p-value tell us?
whether the effect/difference is real, aka “statistically significant”…the likelihood we committed a type 1 error
type 1 error
reject the null hypothesis when in fact there are no differences between groups…false positive
type 2 error
fail to detect a significant difference when one does in fact exist…false negative
2 factor ANOVA
what if two independent factors are suspected of affecting your response variable?
R2
the coefficient of determination
statistical measure in a regression model that explains the variation in a dependent variable based on the independent variable
a higher R2 = better fit to the data
perfect fit = 1.00
same letter
no difference
correlation (C)
two measurements vary in tandem; no causal relationship; both responding to the same underlying driver
regression (R2)
two measurements vary in tandem; necessarily implies causal relationship
both may vary in a positive or negative fashion; linear or nonlinear response
what does R2 mean?
it is the proportion of variation in Y that is explained by X
bounded by 0 and 1 (0.0 - 1.0)