exam 3- ATTR 425
1/33
There's no tags or description
Looks like no tags are added yet.
Name | Mastery | Learn | Test | Matching | Spaced | Call with Kai |
|---|
No analytics yet
Send a link to your students to track their progress
34 Terms
nominal
weakest and most basic level, provides a name, no order or rank, no quantitative data, frequency only
ex: polls- relating to sex, ethnicity, state, political party, employment status
typically demonstrated in visual graphs such as bar graphs, pie charts, etc,
common mistake with nominal data
running mean, median, or mode- frequency data. you shouldnt be able to compute this
ordinal
uses labels, has order, value between labels is meaningless
frequency, mode, median, range
ex: pain scale, borg scale, likert scale, age range groups,education level
we do not know the value or distance between the order, only know the order.
with age groups- age range groups are ordinal, age is alone- this will be ratio level data
interval level
higher level of measurement, provides labels, has order, values between labels is consistent, no absolute zero, can calculate MCT, range, stdev, variance
no absolute zero- zero should mean the absence of that thing.
ex: temperature, range of motion, time (within 12 hr clock)
ratio level
highest level of data, provides all info of nominal , ordinal, and interval
has a zero that can be meaningful
ex: weight, height, length of time, length
parametric data
fall within a normal distribution, allow researchers to draw conclusions mathematically; a normal distribution is symmetric around its mean
think parameter- allows us to draw conclusions or parameters about a group of things
INTERVAL AND RATIO
non parametric data
nominal and ordinal data
measures of central tendency
revolve around mean, median, and mode- what they are
these values cluster around the center of normal distribution
arthimetic mean
average of all scores, can be skewed by extreme scores- or outliers
median score
falls in middle of a distribution, not as easily skewed by extreme scores
can be a better data indicator if u have large groups with outliers
mode
most commonly occuring value in a distribution of numeric data
goal of quantitative research designs
to establish relationships between measures of interest
Quasi- Experimental
attempts to establish a cause and effect between variables
lacks random assignment
often very clinical research
the IV is not manipulated to change the DV
fails to control for all variables
Sampling: what is generalizability
It asks whether the reported measure or outcome can be reproduced
the reader needs to know if the results reported are reproducible with particular patient
it is influenced by sample size and population representation
Internal validity
design of study is measuring what it is intended to measure
interpreting the data for cause and effect
External Validity
ability to generalize results to sample population
generazibility of findings and conclusions
parameter
characteristic of an entire population
ex: VO2, FIIT principles, etc.
1- test samples using statistics
statisitc
characteristic of sample - used to establish a parameter
a priori
from the earlier
a posterior
the later
descriptive statisitcs
condense large amts of data into easy to interpret fashions
T- test
compares two groups with a single measure
ex: before and after treatment
limited to one dimensional comparisons: usually do not want to run multple T- tests on the same data
ANOVA
allows to compare more than one set of means at a time
decreases the fear of committing a family wise error
Independent Samples t-test
used when independent variable has 2 levels
one way ANOVA
used when independent variable has three or more levels
regression
used to predict the balue of a DV based on known relations between independent variables
null hypothesis
result of your study that will have no effect on what you are studying
Treatment A= Treatment B (no effect)
treatments have the same idea, usually in research you do not want this to happen
Type I error
Null hypothesis is true and the researcher rejects the null hypothesis
False positive - more common in research
When you say there is a difference but there is not
You usually do not want to start a research study saying there is no difference- which is why it happens more commonly
Type II error
Researcher fails to reject the null and the null hypothesis is false
False negative
statistical power
probability that we will reject the null hypothesis when that hypothesis is true
probability you will get it right when that difference is true
ways to influence power
increase sample size, increase effect size, less variance in subjects, raise P-value
P- value
The likelihood you will commit a type I error at the end of your study - when you say there is a difference when there is actually no difference
typically set .05 but can be set at any level
does not denote effect size - it only gives the indication that difference between groups is likely not due to chance/ error
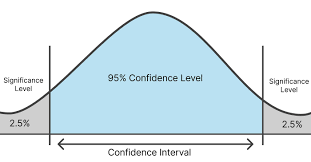
95% confidence interval
95 % of data falls between upper and lower bounds of a bell curve