APES Unit 1-5 AP Classroom Q
1/113
There's no tags or description
Looks like no tags are added yet.
Name | Mastery | Learn | Test | Matching | Spaced |
|---|
No study sessions yet.
114 Terms

What processes is illustrated by the downward arrows from the atmosphere that show the conversion of nitrogen gas into usable forms available to producers?
Nitrogen Fixation
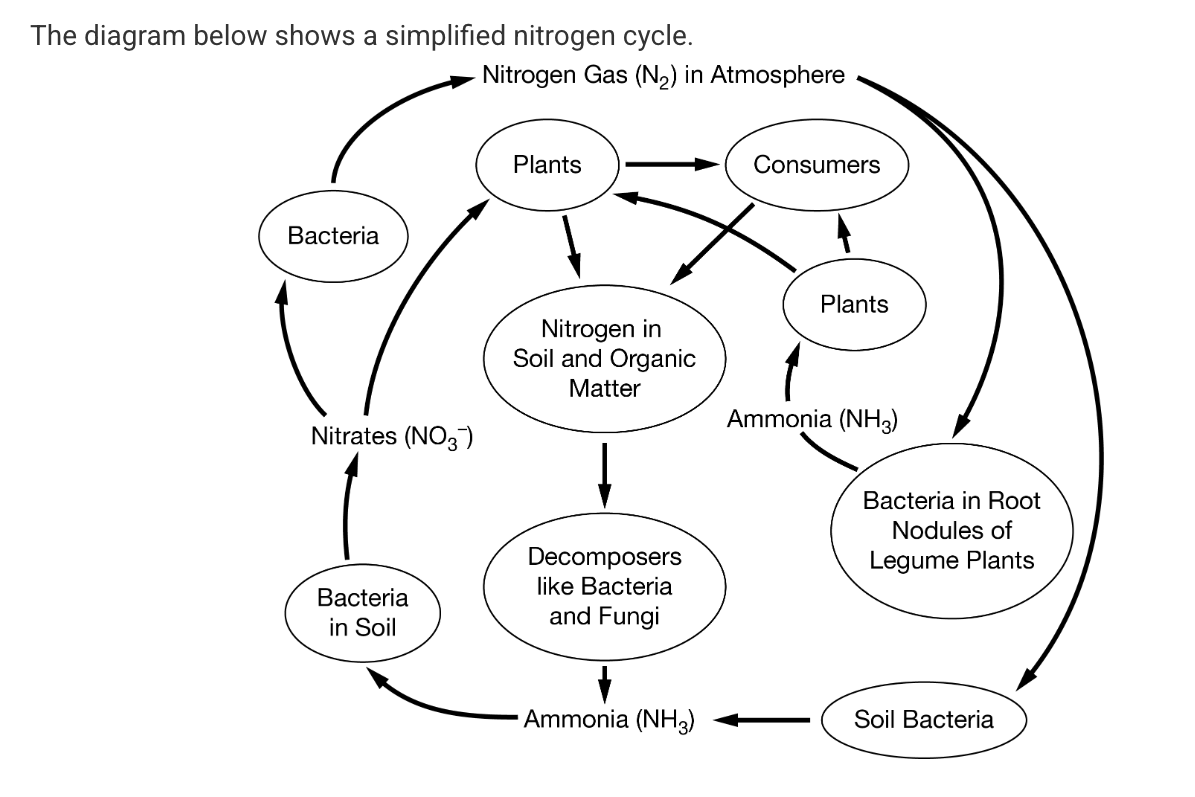
What types of organisms are required to complete the nitrogen cycle, including the process of denitrification?
Bacteria

The majority of the nitrogen on Earth can be found in what reservoirs?
The atmosphere
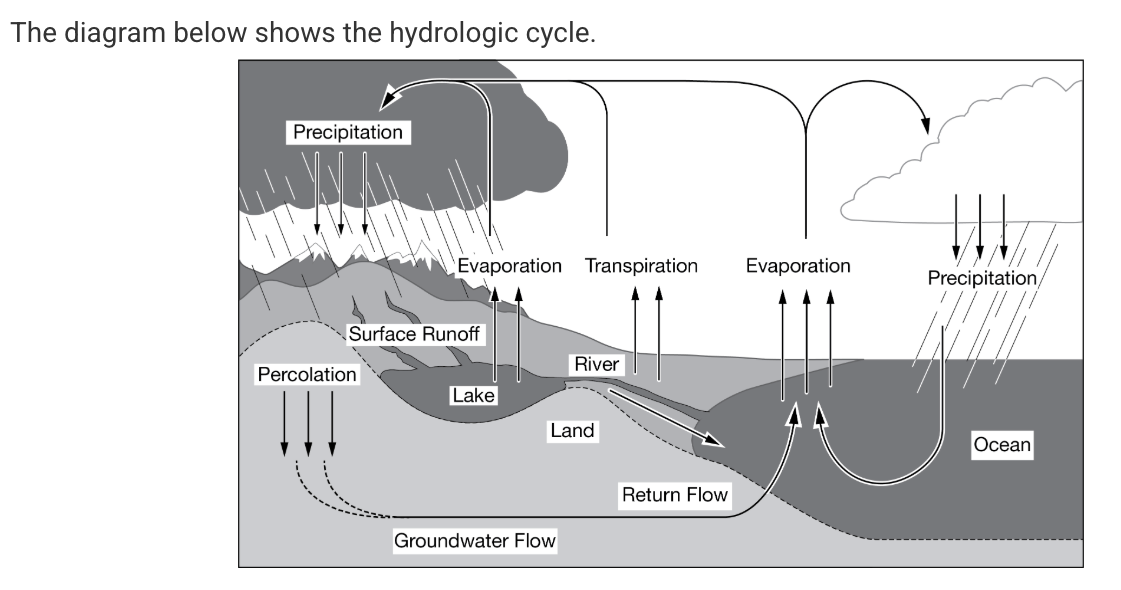
What best identifies a key component of the hydrologic cycle that powers the movement of water and is missing from the diagram?
The Sun

What major reservoirs of freshwater are missing from the diagram?
ice caps
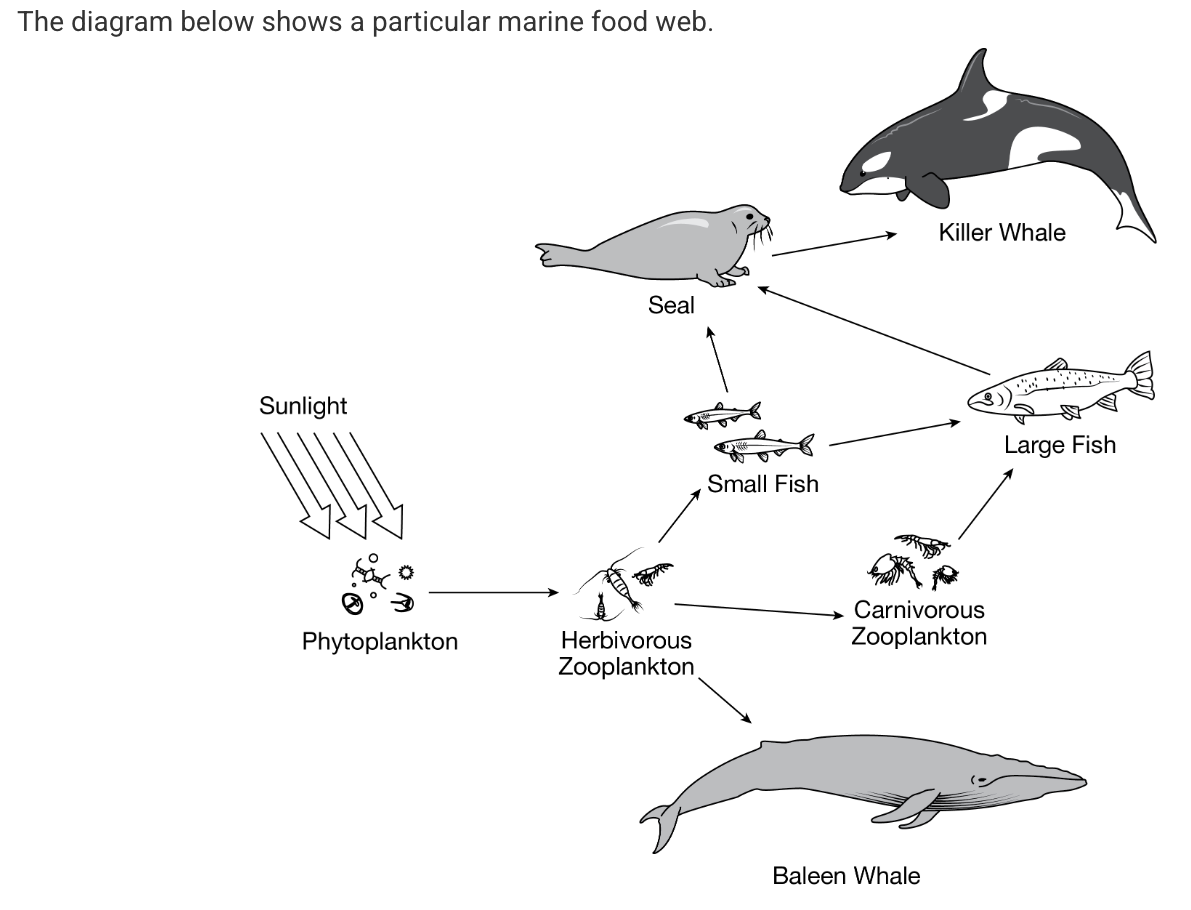
What best describes what is represented by the arrows in the food web?
The flow of energy

Which trophic level has the least available energy in kilojoules in this food web?
killer whale
Based on the second law of thermodynamics, how much biomass of phytoplankton would be needed to produce 1 kilogram (kg) of large fish in this food web?
1000kg
Six white-tailed deer and six sika deer were enclosed in a pasture for observation during an eight-year study in central Texas. White-tailed deer are a native species to central Texas, while sika deer are a nonnative species to central Texas. White-tailed deer feed on flowering plants and the tips of trees and shrubs but do not eat grass. Sika deer feed on flowering plants, the tips of trees and shrubs, and grass. All other grazing animals were kept out of the pasture during the study. The number of sika deer more than doubled after the eight years, while the population of white-tailed deer decreased by 50 percent.
What best supports the results from the study?
The sika deer out competed the white-tailed deer in consuming flowering plants and shrubs.
In reef ecosystems, corals often have microalgae living inside them. The algae supply the corals with nutrients, and the coral give shelter to the algae. What interactions best describes the relationship between the corals and the algae?
mutualism
What best describes an example of resource partitioning in an ecosystem?
Two different bird species feed from the same oak tree; one eats acorns, and the other eats insects in the bark.
What describes the most likely change to terrestrial biomes resulting from warmer average global temperatures?
The global distribution of midlatitude biomes, such as grasslands and temperate rain forests, would increase.
Which terrestrial biomes has the highest net primary productivity
Tropical rain forest
What terrestrial biomes has the highest primary productivity per unit area?
Tropical rain forest
This biome contains a nutrient-rich environment created by falling leaves and trapped organic materials from the large trees, and it provides the ecosystem service of filtering pollutants from water.
Freshwater wetlands
This biome is found in shallow waters off the coastline and is Earth’s most biologically diverse marine biome.
coral reefs
This freshwater biome is characterized by fast-flowing water that can originate from underground springs or runoff, which carries sediment and organic material.
rivers
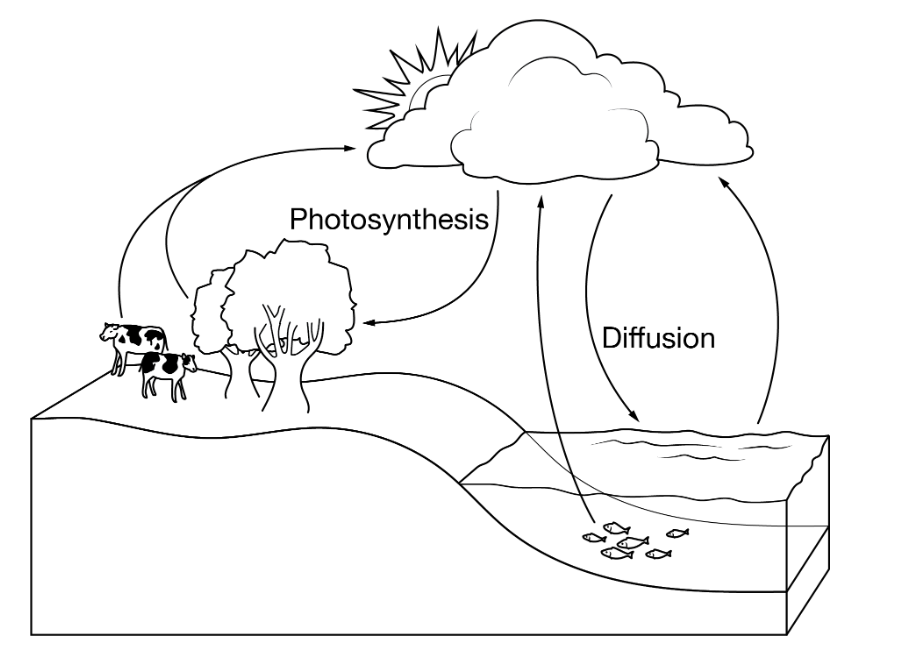
What biogeochemical cycles includes the processes of buffering ocean and photosynthesis, as shown in the diagram?
the carbon cycle
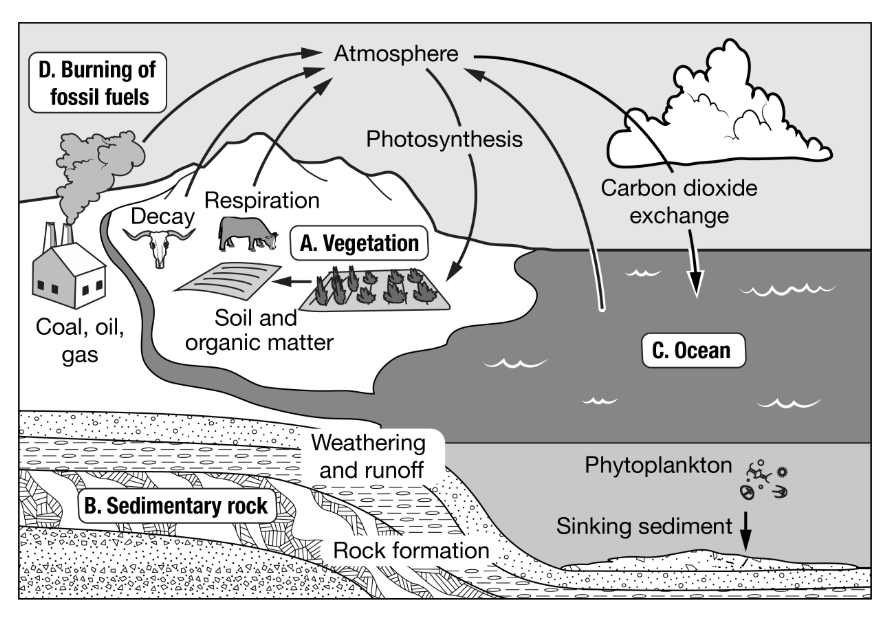
Which of the boxes represents a carbon source?
D

Which box represents a carbon sink that holds carbon compounds for the shortest period of time?
A
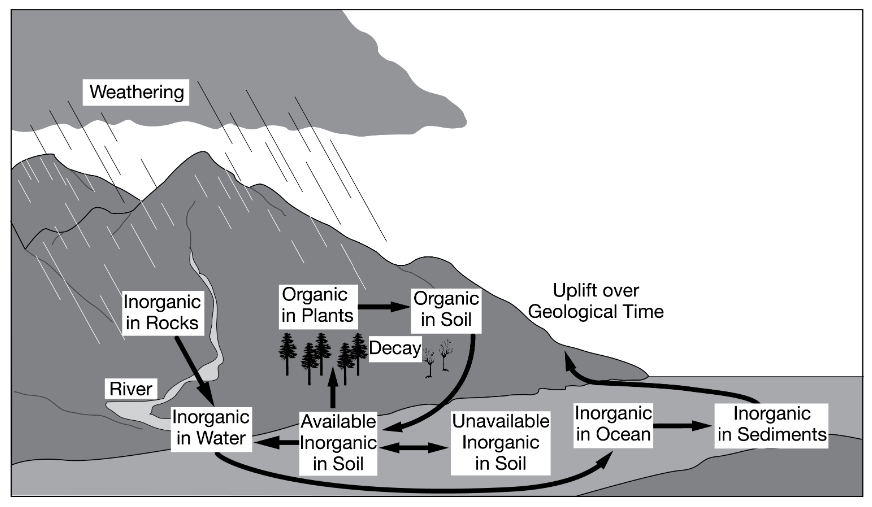
The diagram above best illustrates major processes in which of the following biogeochemical cycles?
The phosphorus cycle
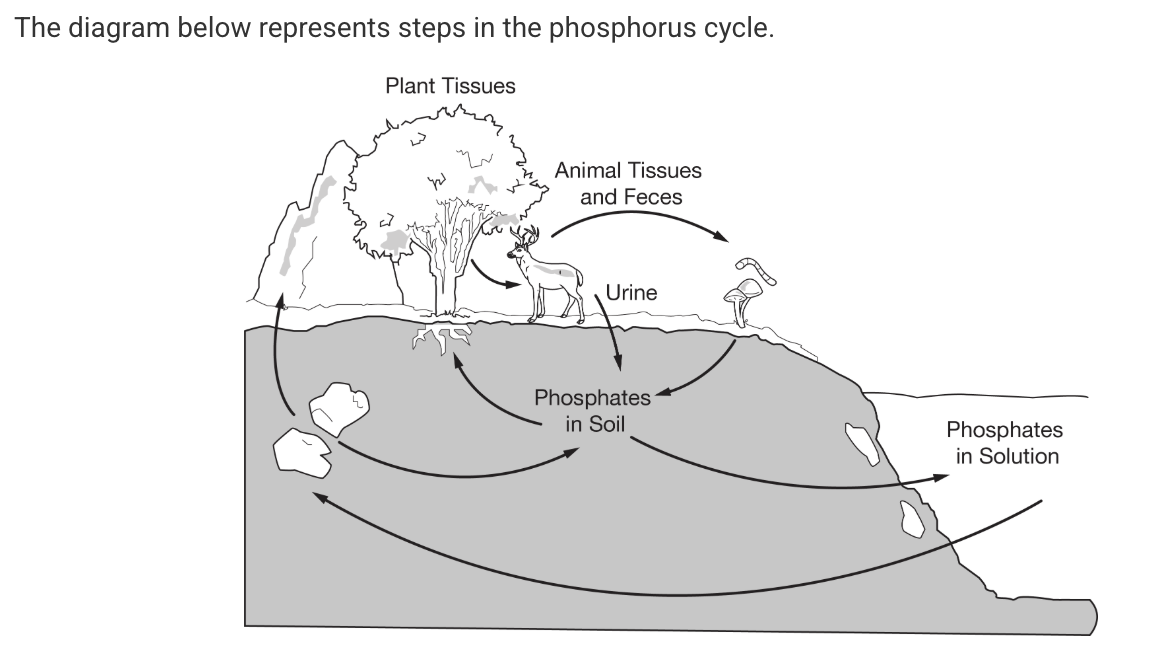
Which of the following statements is best supported by the diagram of the phosphorus cycle?
The phosphates absorbed by animal tissue through consumption eventually return to the soil.
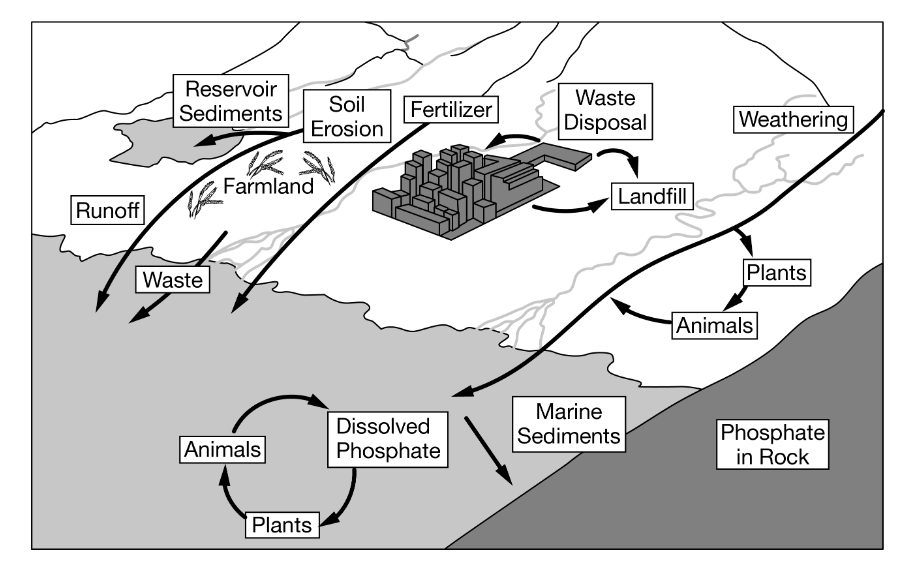
Farmers in a suburban coastal town started using no-till agriculture, a practice that reduces soil erosion from their farmland. Use the image above to determine which of the following long-term effects no-till agriculture will have on the ecosystem surrounding the farmland.
There will be less algal growth in the nearby ocean
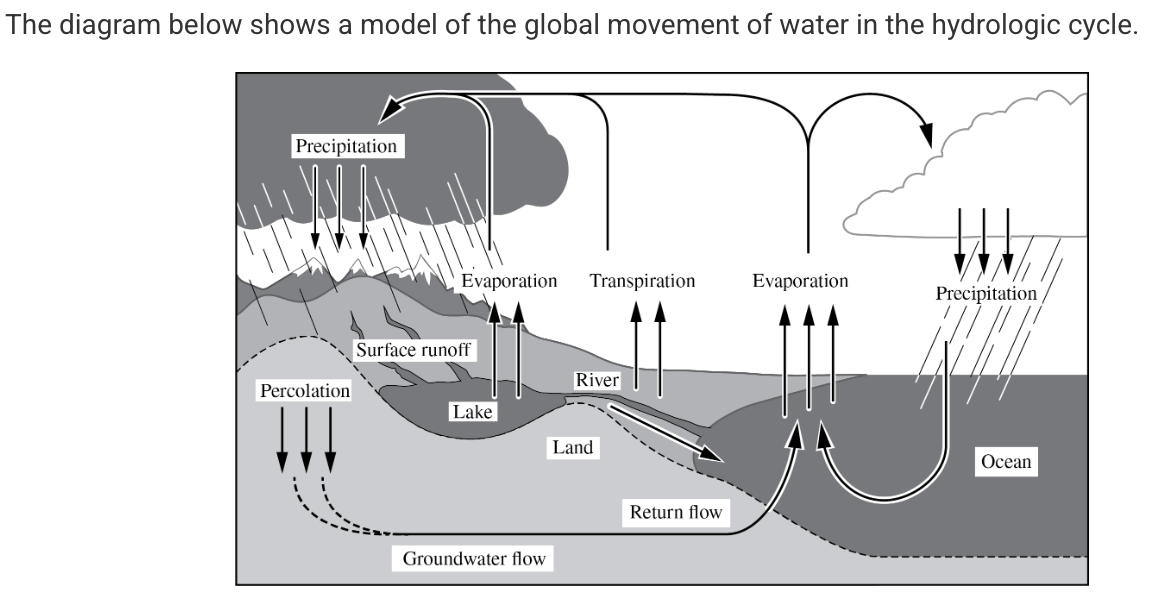
Based on the diagram, which of the following statements about the hydrologic cycle is true?
Water from the ocean evaporates and condenses in the atmosphere.
The total rate of photosynthesis in a given area.
gross primary productivity
This rate of reaction can be measured in the dark by determining the amount of oxygen gas consumed in a period of time.
cellular respiration
The energy available to consumers determined by subtracting the energy used by plants from the total energy transformed by the process of photosynthesis.
Net primary productivity
What best describes the flow of energy in most terrestrial and near-surface marine ecosystems?
Producers use energy from the sun to make organic matter, such as sugars, from carbon dioxide and water and are then consumed by organisms higher in the food chain.
What best describes a terrestrial ecosystem that will have the highest net primary productivity?
Warm temperatures, high rainfall, and consistent sunlight
What trophic levels represents a primary producer in an aquatic food chain?
phytoplankton
A temperate grassland biome has a gross primary productivity of 3480 kilocalories/meter²/year and a net primary productivity of 2000 kilocalories/meter²/year. What is the approximate number of kilocalories/meter²/year available to herbivores in that biome?
200 kilocalories/meter²/year
Take 10% through the trophic levels
Energy is transferred along food chains from one stage to the next. What best explains how the energy is transferred?
If a primary producer stores 10000 kcal of energy, then a tertiary consumer will have 10kcal of energy available.
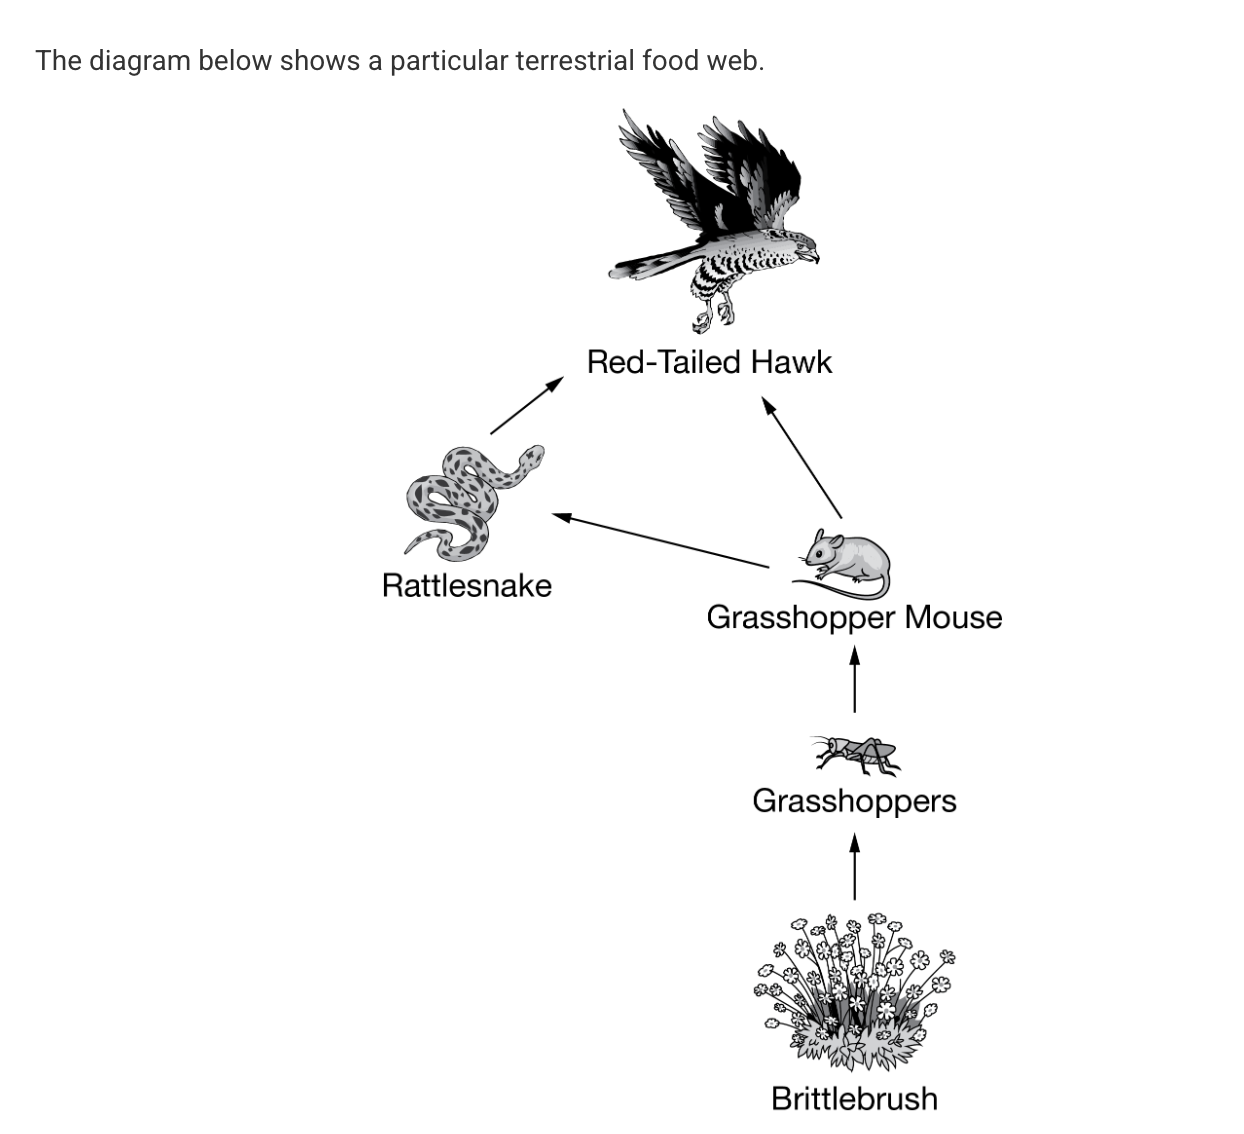
Based on the food web shown above, what correctly describes the flow of energy through the trophic levels from producers to quaternary consumers?
Brittlebrush, grasshopper, grasshopper mouse, rattlesnake, red-tailed hawk

Based on the information above, which ecosystem would most likely recover the fastest from a natural disruption?
Ecosystem B

Based on the information above, which ecosystem most likely experienced a recent population bottleneck?
Ecosystem A, because its low genetic diversity could have resulted from an event that reduced the variation in the gene pool.
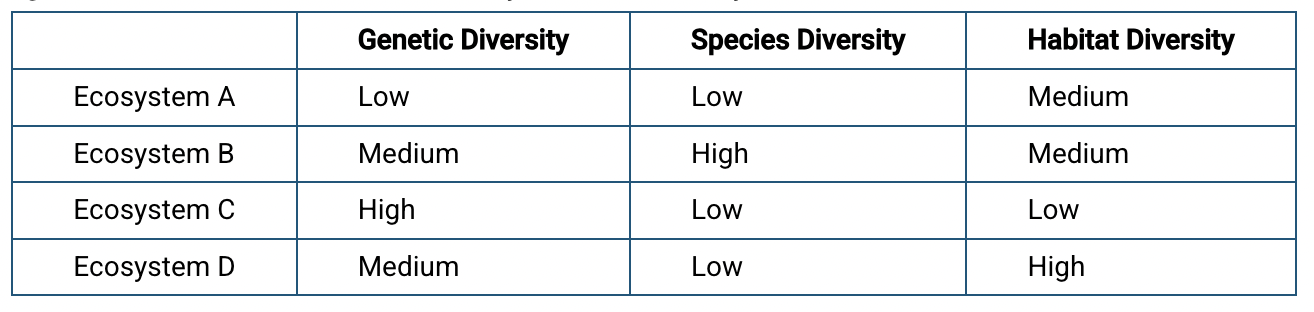
Based on the information above, which of the following best describes Ecosystem C?
Its low habitat diversity indicates that Ecosystem C most likely has a low number of specialist species and few species that utilize large territories.
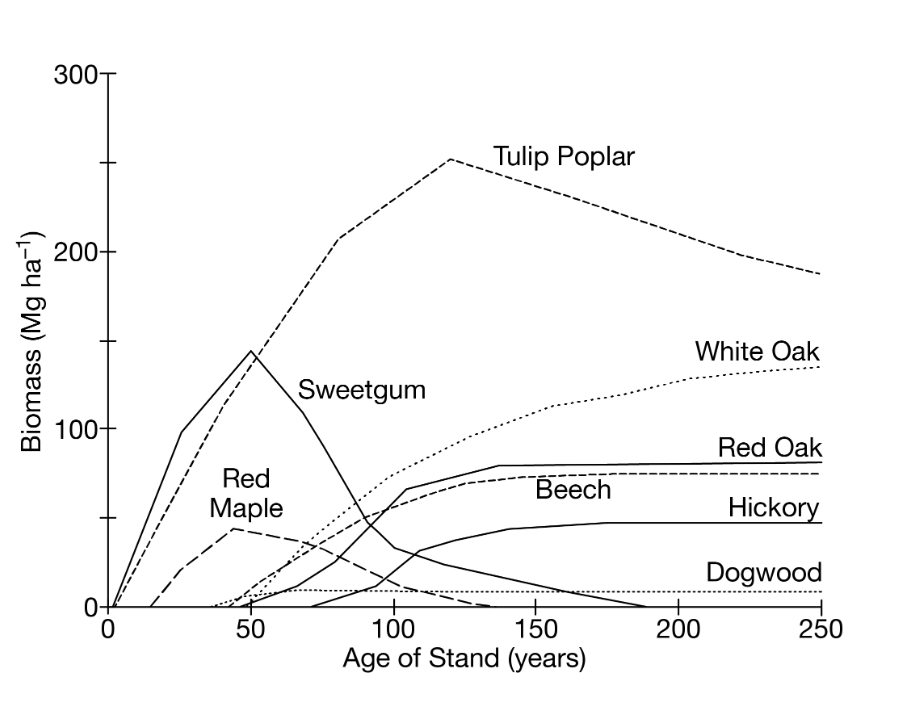
Based on the graph above, which of the following tree species would be the predominant species found during the intermediate stage of succession?
Tulip Poplar

Based on the graph above, which of the following years postdisturbance did sweetgum experience the greatest biomass?
50

Based on the graph above, which of the following years postdisturbance had the greatest species richness?
100
What is an example of an ecosystem that provides ecosystem services including protection from hurricane storm surges?
An intact coastal wetland
What ecosystem service is categorized as regulating?
Pollination, decomposition, and water purification
What economic consequences to a provisioning ecosystem service will most likely result from increased global warming?
The collapse of local fisheries, because of the damage to coral reefs from ocean acidification
Based on the theory of island biogeography, what kind of island would most likely have the highest number of species living on it?
One that’s close to the mainland and big
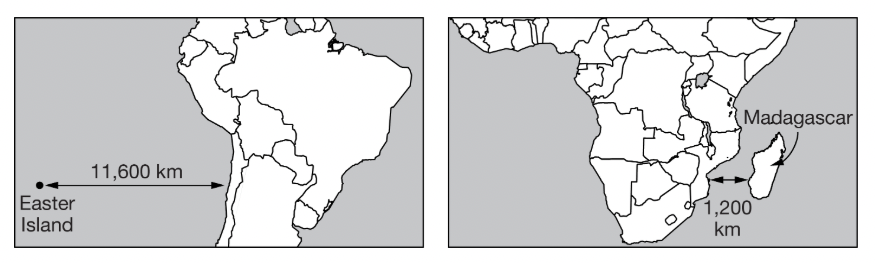
The image shows two different islands and the relative distance to the nearest mainland. Based on the theory of island biogeography, what best predicts the effect of the introduction of an invasive species on Easter Island compared to Madagascar?
The native species on Madagascar are more likely to survive because the island is larger and provides a greater diversity of habitats and resources.
An island off the coast of Africa contains a larger percentage of specialist species than generalist species. What describes the most immediate effect if an invasive generalist species is introduced to the island?
As competition for resources increases, the population size of the island’s specialist species will decrease.
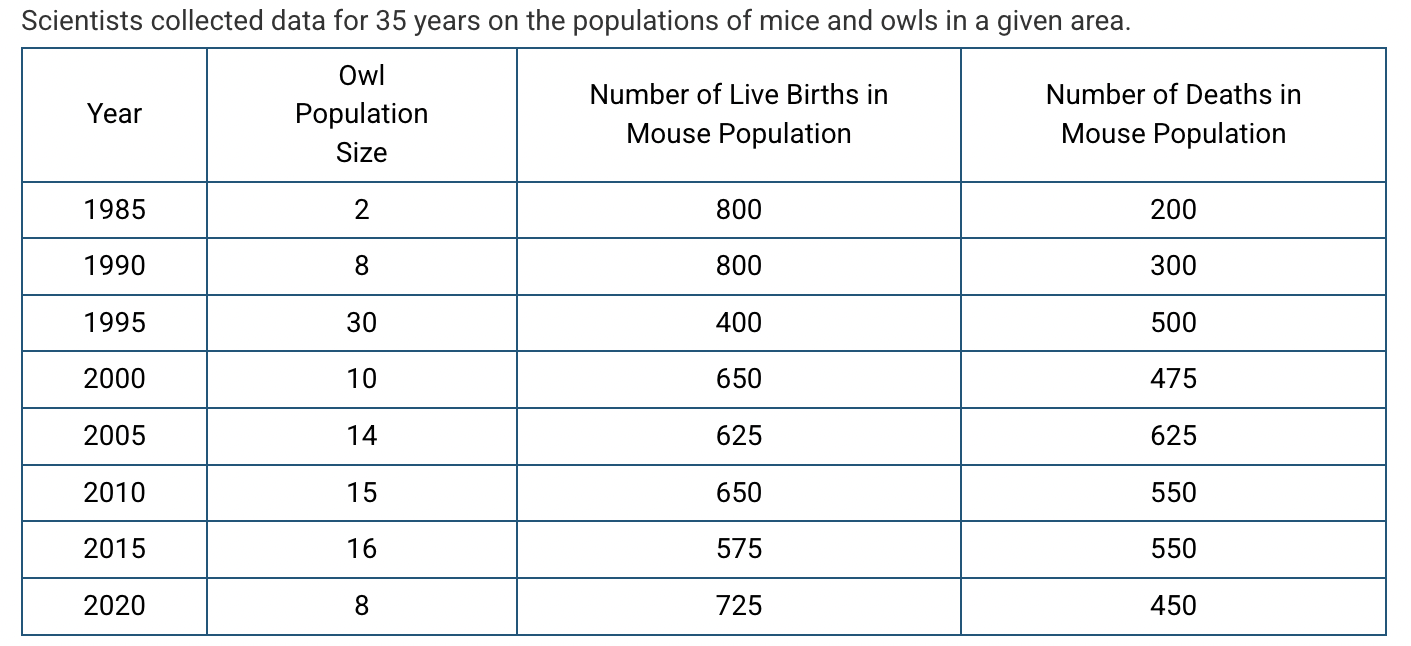
Based on the trends shown in the table, in which of the following years was the owl population at carrying capacity?
2015

Which of the following claims is best supported by the data shown in the table above?
The owl population experienced population overshoot between 1995 and 2000 because of increased competition for resources.
In a given county, the population size is decreasing because there are fewer prereproductive-aged individuals in the population. Which of the age structure diagrams best illustrates the population of this county?
Responses
Age structure diagram with a lot of adults and few kids
Which of the age structure diagrams best illustrates a county that has a stable population size and slow or no population growth?
one that has a relatively equal amount of kids and adults
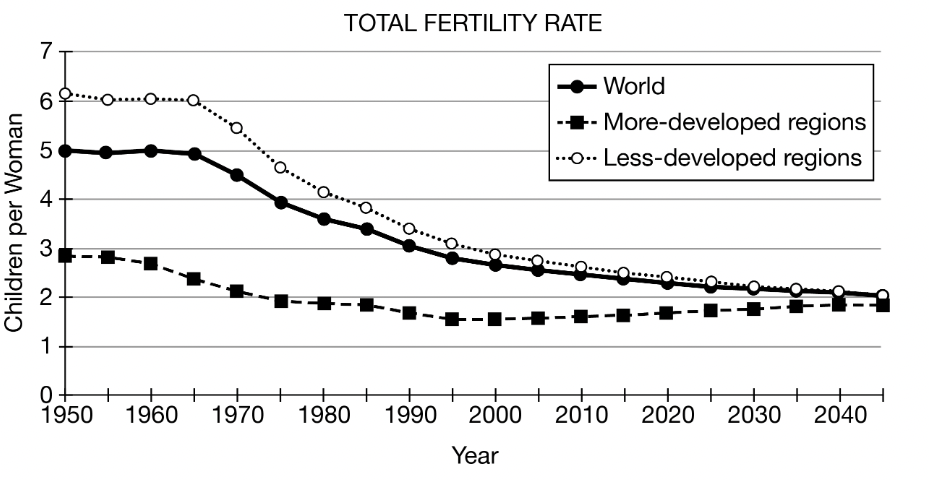
Which of the following best describes the trends seen in the total fertility rates for the world population from 1950 to the projected rates in 2040 ?
Total fertility rates declined rapidly from 1960 to 2000 because women had children later in life as a result of increased educational opportunities.

Based on the data in the graph, what was the average number of children born per woman in less-developed regions in 1975 ?
4.7

Based on the data in the graph, when did more-developed regions first reach replacement level fertility?
1970
A scientist is studying a biome that experiences large seasonal fluctuations in both temperature and precipitation patterns.
What would best characterize the organisms that inhabit the biome?
Generalists would be most abundant, because the resources available would be constantly changing.
What best describes a difference between generalist species and specialist species?
Generalists use a large range of resources, while specialists have a limited range of resources they use to survive.
A variety of plants and animals inhabit a forest ecosystem. What would explain why certain organisms would be more likely to survive than others if a forest fire burned the area?
Generalist species are more likely to survive because they can thrive in a wide variety of environmental conditions and can make use of a variety of different resources.
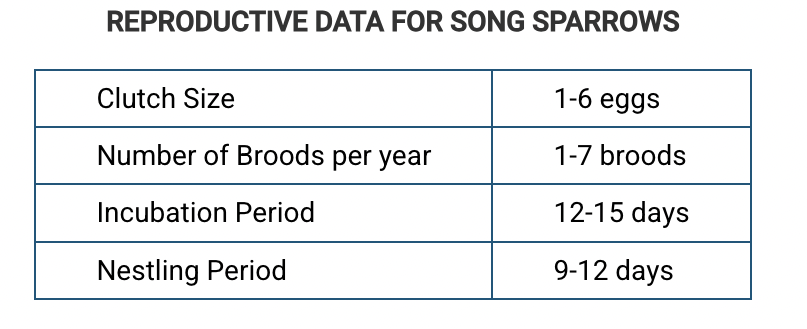
Song sparrows are found in a variety of habitats, including marshes, grasslands, agricultural fields, and suburban areas. They feed on a variety of organisms, including beetles, caterpillars, snails, and earthworms. They also consume plants, including different types of grains and berries. The table below summarizes the reproductive data for song sparrows.
Based on the description and the data table above, which of the following combinations best classifies the song sparrow?
r-strategist and generalist
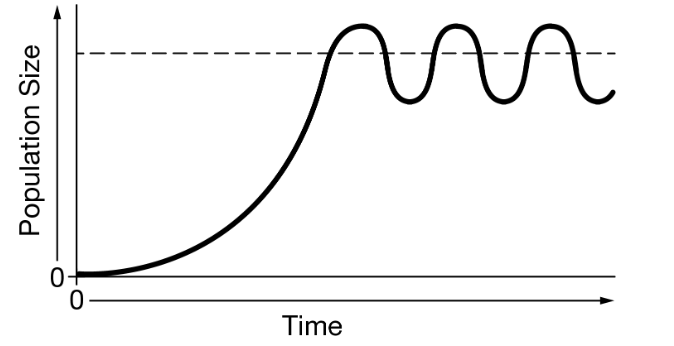
What kind of graphs best shows the population size of a K-selected species over time in a stable environment?
One that reaches K-capacity and then stabilizes
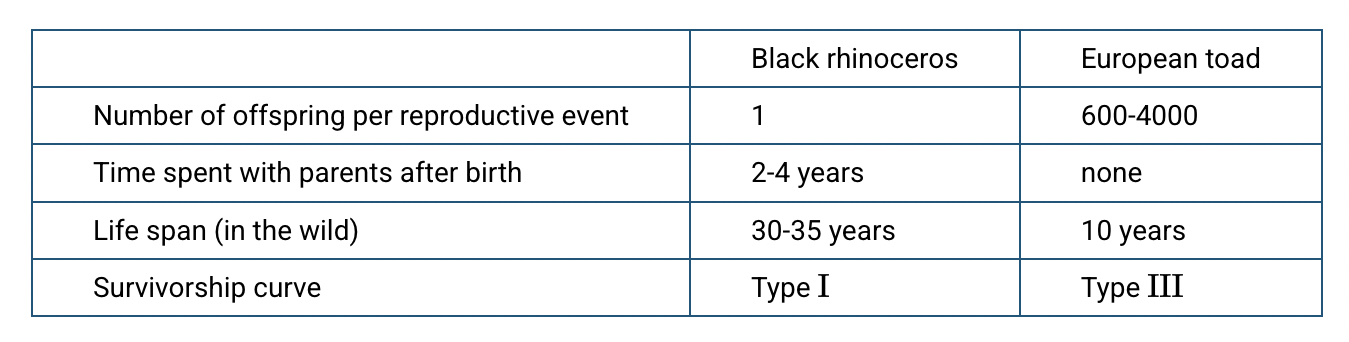
Which of the following claims is best supported by the data in the table?
The black rhino is a K-selected species because it has a low number of offspring per reproductive event.
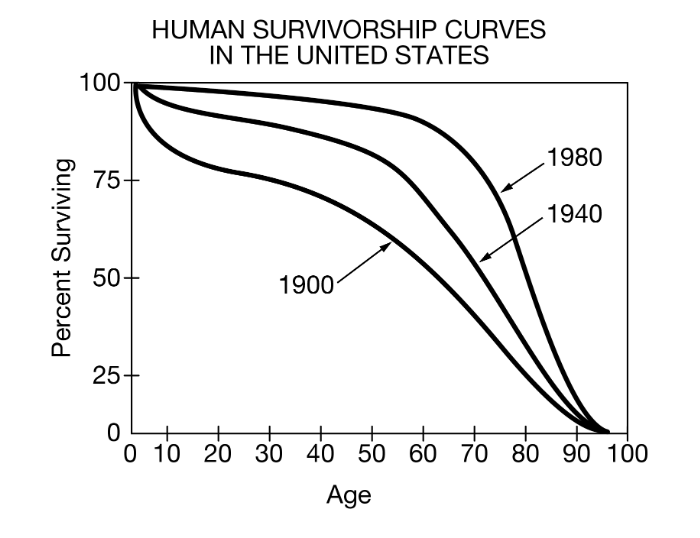
Based on the survivorship curves shown below, which of the following is a possible reason for the change in the shape of the curve from 1900 to 1980?
Improvements in health-care services and medical research
What is a characteristic of an organism that displays a Type III survivorship curve,
The organism produces large numbers of offspring every time it reproduces.
What best supports the classification of bees as an organism that displays a Type II survivorship curve
Away from the colony, bees experience a constant probability of death per unit time as a foraging species.
The rule of 70 can be used to determine a population’s doubling time. Doubling time is a measure of the
population growth rate
What is a density independent factor that can affect the size of a human population?
Heat waves, storms, natural disasters
What best describes why birth and death rates are changing in a country that is in Phase 2 of the demographic transition?
Individuals have better sanitation and access to clean drinking water.
The demographic transition model describes population change over time as a country becomes more developed. Age-structure diagrams describe how populations are distributed across age ranges. Which age-structure diagrams best displays the age ranges in a country that is in stage 2 of the demographic transition?
An expansive base pyramid age-structure diagram
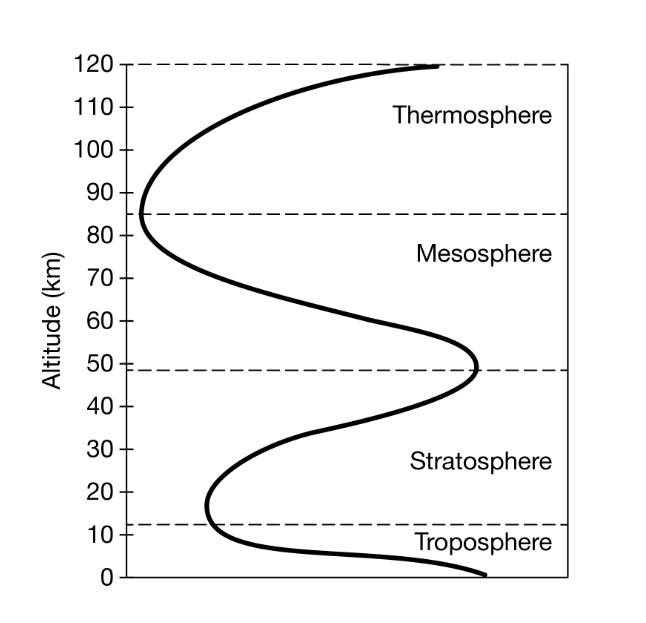
What abiotic factors, when graphed on the x-axis, leads to the curved line in the graph due to variation in the different layers of the atmosphere?
Temperature Gradients
The vast majority of ozone is found in a thin layer due to a lack of circulation in which atmospheric layers?
Responses
stratosphere
Which layers of the atmosphere contains charged gas molecules that glow and produce light when hit by solar energy, leading to glowing gases such as the northern lights, found over 90 kilometers above Earth's surface?
thermosphere

What is the best explanation for the formation of Hadley cells in the tropics, as seen in the diagram, between 30 degrees N and 30 degrees S latitude?
The Sun warms the moist air at the equator and causes it to rise because of its lower density. As the warm air moves away from the equator, it cools, becomes denser, and then sinks.
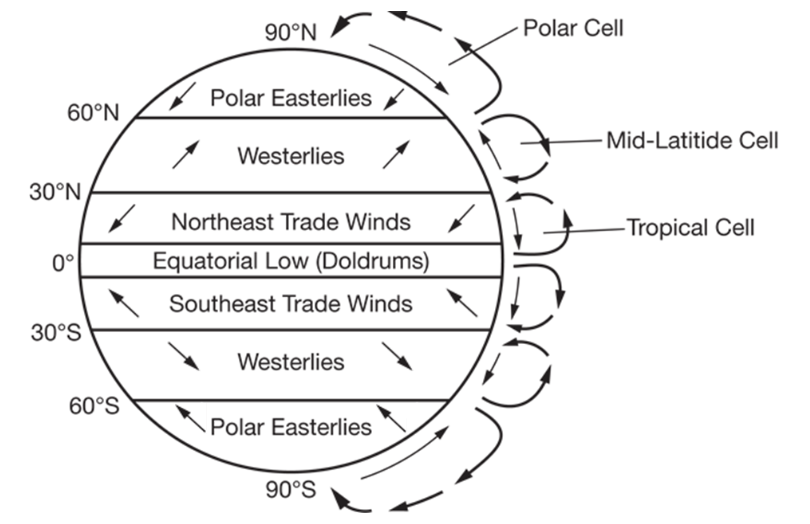
What is the best explanation for the deflection of the trade winds in both hemispheres, as seen in the diagram above?
The wind is deflected west because of Earth’s rotation.
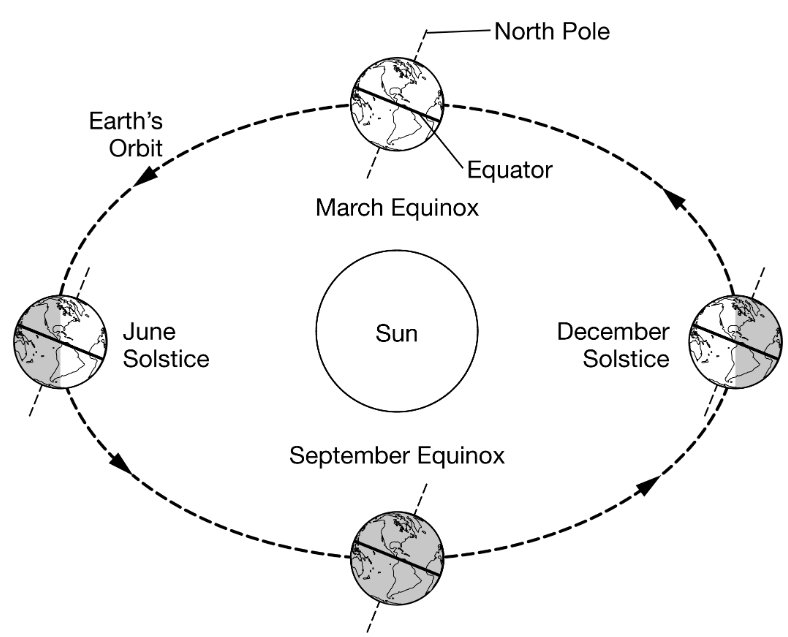
Based on the diagram, which of the following days in Earth’s yearly orbit would have the longest period of daylight in the Northern Hemisphere?
June Solstice

Based on the diagram, what best describes why the summer solstice in Australia occurs in December and not in June?
At this time of year, the tilt of Earth causes Australia to be closer to the Sun.
The Atacama Desert lies to the west of the Andes Mountains in northern Chile. It is the oldest, most consistently arid place in the world.

Based on the map above, what best explains why the Atacama Desert has a consistently arid climate?
It is in the rain shadow of the Andes Mountains.
The Atacama Desert lies to the west of the Andes Mountains in northern Chile. It is the oldest, most consistently arid place in the world.
Based on the map above, what best identifies and explains the region of South America that would have a more moderate climate?
The east coast would have a more moderate climate because of the Brazil Current.
warm air and currents flowing downward
The Atacama Desert lies to the west of the Andes Mountains in northern Chile. It is the oldest, most consistently arid place in the world.
Based on the map, what best explains the area of the Andes Mountains that would have the greatest number of rivers?
More rivers would be located on the east side of the Andes Mountains because the trade winds are coming from the east.
precipitation before mountains

What best describes the boundary between the two tectonic plates seen in the map?
The map illustrates a transform boundary, where tectonic plates slide past each other as the Pacific Plate moves northwest and the North American Plate moves southeast.
The Atlantic Ocean is expanding as a result of plate tectonics. What explanations best identifies the type of plate boundary and processes occurring at the Mid-Atlantic Ridge, as shown in the diagram below?

A divergent plate boundary exists at the Mid-Atlantic Ridge where plates move away from one another, leading to seafloor spreading.

The map above shows the locations of known volcanoes and earthquakes. What explains what is being illustrated in the enclosed area in the northwest portion of the map?
The enclosed area shows a hot spot in the middle of the Pacific Plate in the Hawaiian Islands.
The diagram below represents how solar radiation strikes the surface of Earth differently, depending on location, during the June solstice.

What correctly identifies and explains the effects of the differences in the distribution of solar radiation on Earth as seen in the diagram above?
Responses
Global wind patterns are created because uneven solar radiation results in warm air at low latitudes and cool air at high latitudes, resulting in density differences between the air masses
The Chesapeake Bay is a watershed that is located in six states and the District of Columbia. What can cause an increase in water pollution in the watershed?
An increase in stormwater runoff in urban areas
Peru’s commercial anchovy industry would most likely be harmed during an El Niño Southern Oscillation (ENSO) event. What is the most likely explanation for the decline in anchovy during an El Niño Southern Oscillation (ENSO) event?
Less nutrient-rich water reaches surface waters, disrupting the food web.
During an El Niño event, farmers in the southwestern United Stated often benefit from what changes?
Wetter and warmer weather that increases soil moisture
During a La Niña event, what environmental changes would the tropical Pacific Ocean and its surrounding landmasses most likely experience?
Increased upwelling off the coast of South America resulting in increased productivity of fisheries

Which latitude shown on the diagram above experiences 24 hours of daylight on December 21?
E
This layer of Earth’s atmosphere contains the ozone layer that absorbs the sun's ultraviolet rays.
Stratosphere

Which of the following is a biome found at 30 degrees N and 30 degrees S as seen in the diagram?
Deserts
Which of the following is the source of energy driving the circulation pattern labeled C in the diagram?
Solar Radiation
What is the approximate concentration of CO2 , N2 , and O2 in dry air?
CO2 = <1%
N2 = 78%
O2 = 21%

At which of the following sites does seafloor spreading result in rifts and possible volcanoes?
A
What properties is most likely associated with soils that contain more sand-sized particles than soils that contain more clay-sized particles?
High permeability
Industrial logging threatens many forested ecosystems. What environmental consequences will most likely result from clear-cutting deciduous forests for logging?
More carbon dioxide will be added to the atmosphere and increase anthropogenic climate change.
+erosion
What best describes the advantages and disadvantages of drip irrigation?
This method most efficiently delivers water directly to plant roots compared with other methods, and wastes less water, but it may be too costly for farmers in developing countries to use.
What best exemplifies how an action within the fishing industry could lead to a tragedy of the commons?
Overfishing of threatened fish species leading to the eventual depletion of the resource
What is a good example of the concept of tragedy of the commons?
Using tropical rainforests for economic gain, rather than sustainability. As a resulr shared resources are depleted.
what is an unintended consequence associated with waterlogging caused by flood irrigation?
higher water tables
This type of irrigation, often used in orchards growing tree crops, distributes water to plants through small parallel channels between crop rows but often leads to increased soil erosion in the field.
Furrow irrigation
What best represents the percent of water that is used for various purposes worldwide?
Agriculture = 70%
Industrial = 20%
Residential and Commercial = 10%

An insect population in an agricultural field is affected by monthly applications of a pesticide, as shown in the graph above. A likely cause of the overall increase in the insect population over time is…
the survival of increasing numbers of resistant insects
What describes an unintended consequence that results from large-scale agricultural use of water from an aquifer?
The rate of water use likely exceeds the rate of recharge, leading to lowering the water table.