PM 510 Biostatistics
1/51
There's no tags or description
Looks like no tags are added yet.
Name | Mastery | Learn | Test | Matching | Spaced |
|---|
No study sessions yet.
52 Terms
A variable
a measurable characteristic, attribute, or quality of a person, object, or event that can vary or change over time.
Data
are the measurement(s) or observation(s) made on the sampled subjects
Sample
A subset of individuals or observations selected from a larger population to represent the population in analysis.
Parameter
Whole Set, The totality of subjects under study.
Sample Variables are
Roman Letters
Parameter Variables
Greek Letters
What is the best order of Sampling
Simple Random > Stratified > Cluster > Systematic > Voluntary > Convenience
Standard Four Characteristics
Central Tendency(mean, median, mode)
Kurtosis(Peaked, Tailedness)
Variability (Standard Deviation, Range, Variance)
Skewness (Symmetry/Asymmetry)
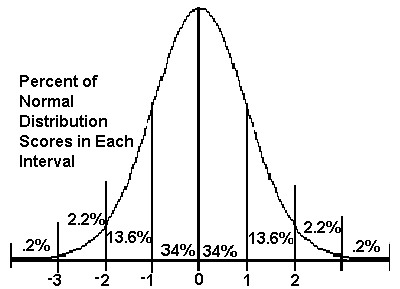
Standard Normal Distribution
Mean = 0 Standard Deviation = 1
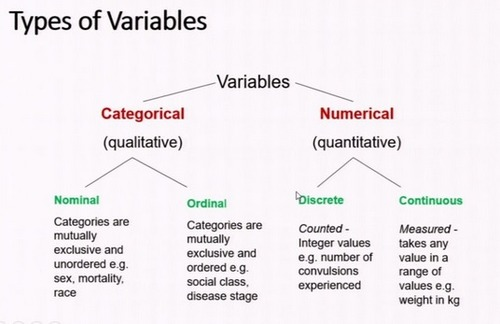
What types of data are Categorical
Nominal and Ordinal
What types of data are Numeric
Discrete and Continuous
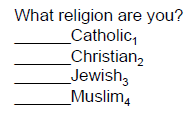
Nominal
Rank does not matter, No Order
Qualitative Categories with no natural order or ranking.
Names, Colors, Jerseys, Labels, Gender
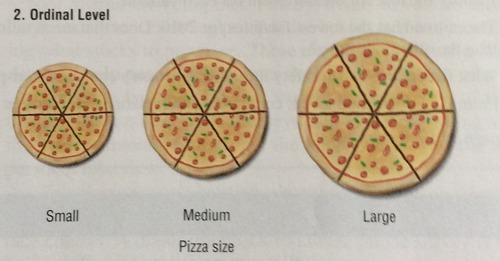
Ordinal
Rank does matter, There is an Order
Categories that have a meaningful order, but the differences between them are not measurable in exact units.
Time Laps, Positions Held, Races
Independent Variables
is the variable that is manipulated, categorized, or used to predict changes in another variable.
Dependent Variables
A variable that represents the outcome or effect being measured in a study.
Which of the following best defines quantitative data in statistics?
numerical data that can be measured or counted.
Qualitative
Data that describe categories, labels, or qualities, such as eye color, jersey number categories, or satisfaction ratings.
Numeric
values that are expressed in numbers. In statistics, this usually means quantitative data (measured or counted).
Discrete Numeric (Mostly Whole Numbers)
Countable, Ordered Numerical Data, Example: Counting Mice or the amount of balls.
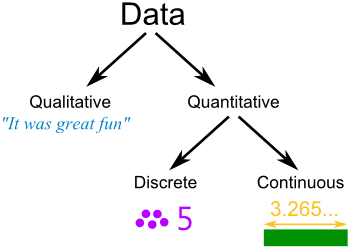
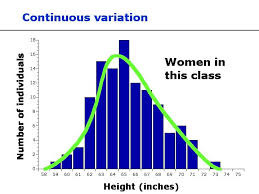
Continuous Data
Ordered Numerical Data, Can take any value. Usually has a decimal with it (Height, Weight, Age)
Which Type of Graph do you want to use for Categorical Data
Bar charts and pie charts
Which Type of Graph do you want to use for Numeric Data
Histograms, box-and-whisker plots, scatter plots, or line graphs
Categorical
are often assigned or stored as numbers (e.g., 1 = female, 2 = male) but the meaning of the numbers is completely arbitrary (e.g., could also use 1 = male, 2 = female, or even 36 = female, 25 = male)
Interval
Order Matters
Differences can be measured
No true “0” Starting Point
Quantitative Data
Allow Mathematical Manipulation; Pemdas)
Numeric
Actual Measurements
Distributions
The distribution of data is a complete description of all values that occur in the population
A chart used for frequencies and proportions of each category circle into slicers
Pie Chart
A chart used to obtain frequencies and proportions for each category, One Variable for each group on the x axis
Bar Graph
Which statement correctly compares pie charts and bar charts?
Pie charts show proportions of categories relative to the whole, while bar charts compare counts or frequencies of categories directly.
Symmetric distribution
distribution has identical halves when folded in half at the midpoint
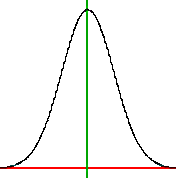
A normal distribution
is symmetric and bell-shaped (Gaussian Distribution)
Ranking of Types of Data
Ratio → Interval → Ordinal → Nominal
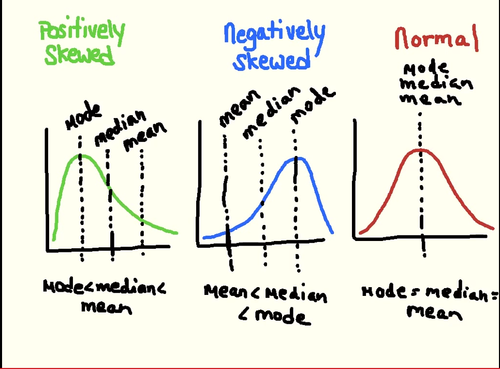
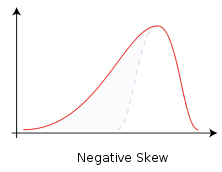
Negatively skewed or left-skewed
left tail is pulled out; the long tail points toward negative or small values
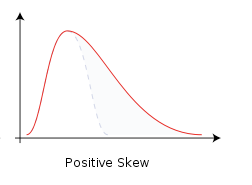
Positively skewed or right-skewed
right tail is pulled out; the long tail points toward positive or large values
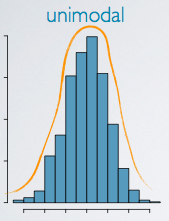
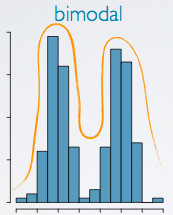
The modality of a distribution describes the number of
modes (peaks) a distribution has
Unimodal
one peak/One mode
Are Histograms Quantitative or Qualitative
Quantitative
Range of Data are broken down into smaller bins of fixed size intervals.
For what Data should Stem-And-Leaf be used
Continuous Data
What is the purpose of the (Stem) in the stem-leaf plot
Used to group data
What is the purpose of the (leaf) in the stem-leaf plot
Used to show individual values
When should we use Line and Scatter Plot
Continuous Data like Time, Data between two variables.
Bimodal
two peaks/Two mode
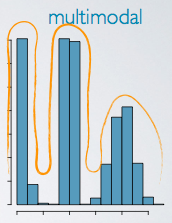
Multimodal
three or more peaks/multimodal
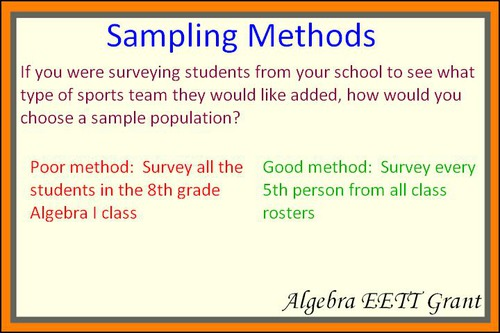
Good Sampling Strategies
Simple Random → Stratified → Cluster → Systematic → Voluntary → Convenience
What 2 Parameters define Normal Distribution (Bell Shaped)
Population mean(mu) and population variance(sd)
Which statement best describes the Student’s t-distribution?
A symmetric, bell-shaped distribution with heavier tails than the normal distribution, used when sample
What central tendency is a normal distribution
Mean = Median = Mode
What central tendency is a right skewed distribution
Mean > Median > Mode
What central tendency is a left skewed distribution
Mean → Median → Mode
According to the Empirical Rule, approximately what percentage of data fall within 2 standard deviations of the mean in a normal distribution?
95%
What percentage of data falls within 1 standard deviation of the mean in a normal distribution?
68%
What percentage of data falls within 3 standard deviations of the mean in a normal distribution?
99.7%