inc Ch 13 AUTOMATED BLOOD CELL ANALYSIS
1/43
There's no tags or description
Looks like no tags are added yet.
Name | Mastery | Learn | Test | Matching | Spaced | Call with Kai |
|---|
No analytics yet
Send a link to your students to track their progress
44 Terms
Electrical impedance/low-voltage direct current
Developed by Coulter in 1950s
● Principle: measurement of changes in electrical resistance produced by cells as they traverse a small aperture.
● Oscilloscope: display pulses that are generated by the cells as they interrupt the current between the external and internal electrode.
● Volume distribution histogram depicts the volume distribution of the cells counted.
● Lytic agents allow separation and quantitation of WBCs into three populations (Lymphocytes, Mononuclear cells, and Granulocytes).
Coulter Principle of Cell Counting
Cells suspended in an electrically conductive diluent are pulled through an aperture in an aperture tube
Low-voltage direct current
_ is applied between an external and internal electrode
Internal electrode
housed inside the aperture tube (+)

External electrode
suspended in the cell dilution in the aperture bath
(-)
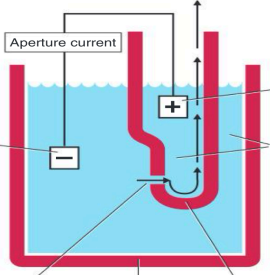
Aperture current
Vacuum
Blood cell suspension
Aperture
Aperture bath
Aperture tube
Excluding internal and external electrode, Identify each pointed parts including arrows (in order

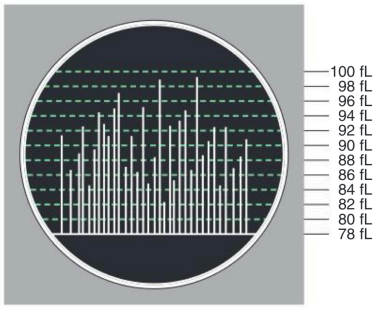
Oscilloscope
display pulses that are generated by the cells as they interrupt the current between the external and internal electrode
shows voltage pulses of RBC
Isotonic saline
electrically conductive diluent like _ are pulled through an aperature tube
Volume distribution histogram
depicts the volume distribution of the cells counted or where the data are plotted on a frequency distribution graph
also used for evaluation of subgroups within a population: WBC, RBC, platelet population based on older Coulter analyzer
X-axis is cell volume
Y-axis is relative number of cells
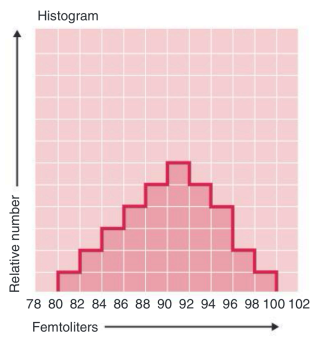
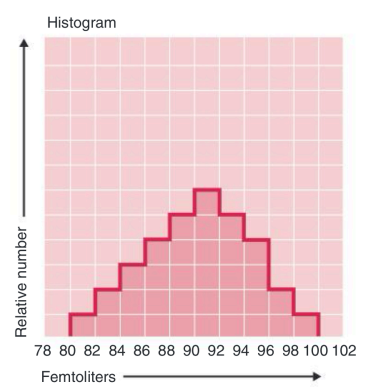
Histogram
A graph shows the average volume of each population, size distribution graph. Can be helpful in diagnosis.
○ A ref that shows the size and relative number of the different types of blood cells.
X-axis: size of cells.
Y-axis: relative number of cells.
2-20 fL
Particles with volumes of _ were counted as platelets
> 36 fL
particles > _ were counted as RBCs
35-90 fL
particles with volumes between _ are lymphocytes
90-160 fL
particles with volumes between _ are mononuclears (monocytes, blasts, immature granulocytes, & reactive lymphocytes)
160-450 fL
particles with volumes between _ are granulocytes
Lytic agents
_ allow separation and quantitation of WBCs into three populations: Lymphocyte, Mononuclear cells, Granulocytes
Lymphocyte, Mononuclear cells, Granulocytes
Lytic agents allow separation and quantitation of WBCs into three populations: ENUMERATE
Coulter Model S
The first multiparameter automated blood cell analyzer that was released in the late 1960s
RF resistance/conductivity
modification by TOA Medical Electronics Company and is used with DC electrical impedance in some analyzers
Optical light scatter
Cytochemistry
introduced by Technicon Instruments Corporation in the 1970s, and ortho clinical diagnostics followed with laser-based optical analyzers.
Protein buildup & Carryover of cells
Sources of error: Coincident passage of more than one cell at a time through the aperture:
■ Causes artificially large pulses, falsely increased cell volumes, falsely decreased cell count
Protein buildup
Source of error: results in lower/falsely decreased cell counts, falsely elevated cell volumes
Burn circuits
Modern analyzers incorporate _ or other internal cleeaning systems to prevent slow protein build up
Carryover of cells
What source of error can be minimized by internal cleaning system from one specimen to the next?
isovolumetric sphering
This can prevent Bending, deforming, misaligning of RBCs without changing their volume
F, must be falsely elevated cell counts instead
T/F: Recirculation of cells back into the sensing zone
Causes: erroneous pulses and falsely decreased cell counts
Prevention: backwash or sweep-flow mechanism
Hydrodynamic focusing
this avoids many potential problems inherent in a rigid aperture system
a process when laminar flow narrows specimen to align in a single file, passing thru aperture one at a time
Coincident passage loss
_ is statistically predictable (and mathematically correctable) because of its direct relationship to cell conc. and effective vol of the aperture
Coincidence correction
_ is completed by the cell analyzer computer before final printout of cell counts
Laminar flow
Minimizes pulse height irregularities with an outer sheath that surrounds & narrows specimen & directs cells to pass thru central axis of aperture.
also narrows specimen stream to align cells in a single file calld hydrodynamic focusing
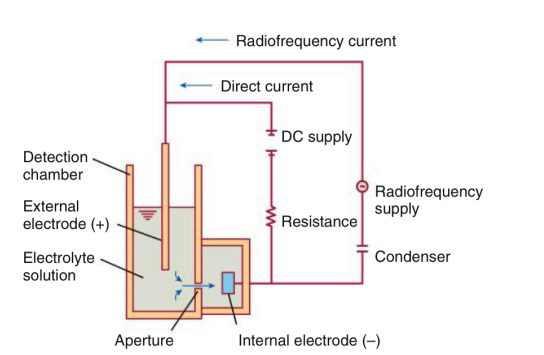
RADIOFREQUENCY CONDUCTIVITY
Low-voltage direct current (DC) impedance with radiofrequency (RF) conductivity to increase discrimination among cells
• Low-voltage DC impedance with radiofrequency (RF) Resistance
The amplitude of the pulse depends on the cell density or internal complexity.
Conductivity is reduced by high NC ratio, nuclear density and cytoplasmic granulation.
When both DC and RF pulse signals are measured = total volume of the cell is proportional to the DC impedance
Cell interior density is proportional to pulse height of change on RF signal.
Conductivity is measured by a high frequency electromagnetic probe.
OPTICAL LIGHT SCATTER
• May be used as the primary methodology or in combination with other methods.
• Optical scatter systems (flow cytometers): a hydrodynamically focused sample stream is directed through a quartz flow cell past a focused light source
Light source can either be tungsten-halogen lamp or helium-neon laser (light amplification by stimulated emission of radiation)
■ Laser light (monochromatic light): emitted at a single wavelength, and it differs from bright-field in its intensity, coherence and low divergence or spread.
May be used to study WBC, RBC, and platelets
Forward-angle light scatter (0°): ○ correlates with cell volume.
Optical scatter systems/flow cytometers
a hydrodynamically focused sample stream is directed through a quartz flow cell past a focused light source
Tungsten-halogen lamp
Helium-neon laser
Enumerate light sources (light amplification by stimulated emission of radiation under optical light scatter)
LASER LIGHT/MONOCHROMATIC LIGHT
emitted at a single wavelength, differs from bright-field in its intensity, its coherence and low divergence/spread
Forward-angle light scatter
0 degrees
correlates with cell volume
Blocker bar
lenses are fitted with this to collect scattered light in the forward direction along the light source path
prevents nonscattered source light from entering the detector
series of filters & mirrors separate diff wavelengths & present them to photodetectors
Orthogonal light scatter/side scatter
90 degrees
correlates with degree of internal complexity
introduced to further characterize blood cells
results from refraction & reflection of light from larger structures inside cell & correlates with degree of internal complexity
allows differentiation of nuclear shape, density, and cytoplasmic granules
Forward low-angle scatter
2-3 degrees
Mie theory: low-angle correlates with cell volume, while high-angle scatter correlates with refractive index of cell
forward-high angle scatter
5-15 degrees
Mie theory
this states that low-angle correlates with cell volume, while high-angle scatter correlates with refractive index of cell
Differential scatter
Combination of low-angle and high-angle forward light scatter
forward low-angle scatter
forward high-angle scatter
correlate with cell vol and refractive index with internal complexity