Alg 2/ Trig --> Graphing Calculator
1/33
Earn XP
Description and Tags
Name | Mastery | Learn | Test | Matching | Spaced | Call with Kai |
|---|
No analytics yet
Send a link to your students to track their progress
34 Terms
Intersections
where 2 or more lines meet
How do you know when to solve for intersections?
When there is a absolute value bars
How do you solve for intersections on a calculator?
1) Press y= button and input y1, y2, etc. values
2) Press 2nd trace
3) Press 5: (Intersect)
4) Scroll to the intersection point with the flasher
5) Press enter 3x to get the intersection coordinates
When solving for intersections what do you input into the y1, y2, etc, values
The different parts of the equation that are separated by the symbols
How do you get to calculate on the calculator
2nd trace
How do you solve for X-intercepts
1) Isolate everything to one side of the equation and make the other side zero
2) Press 2nd trace
3) Press 2: (Zero)
4) Scroll leftbound of the x-int and press enter (makes line with an arrow )
4) Scroll rightbound of the x-int and press enter (makes line with an arrow )
5) Press enter to get answer
X-Intercepts
where the line meets the x-axis
How many ways can you evaluate a function on a calculator
4
When you cannot input a fraction what can you input instead
a decimal
What are the 4 ways you can evaluate a function on a calculator?
1) Manual Calculation
2) Using a Graph
3) Using Y-Vars
4) Using a Table
How do you evaluate a function on a calculator using manual calculation
enter the value that is given in the parentheses into all of the variables in the equation and solve
How can you get cube root on a calculator
Go to math
How to you evaluate a function on a calculator using a graph
1) Go to y= and type in the function
2) Press 2nd → TRACE → VALUE
3) You will see a graph and a prompt for x= in the left corner of the screen; type in the value
How do you evaluate a function on a calculator using a table?
1) Go to y= and type in the function
2) Press 2nd Window
3) Set Indpt to ASK
4) Press 2nd Graph and type in x values as needed
How do you reset the values to see things on a graph
Press window and adjust as needed
When not doing scatter plots what do you need to turn of in the y= area?
Plot 1
Regression
A regression equation in algebra is a mathematical model that represents the relationship between a dependent variable and one or more independent variables. It is typically written in the form of y = mx + b, where y is the dependent variable, x is the independent variable, m is the slope, and b is the y-intercept. The regression equation allows us to predict the value of the dependent variable based on the values of the independent variable(s).
What form is a regressio equation written?
y = mx + b
What is the variable for the correlation coefficient
r
If r is close to 1 or -1 the model is considered…
a good fit
If r is close to 0 the model is considered…
a bad fit
If r = ±1 the model is considered…
a perfect fit
If r = 0,..
there is no linear relationship between the two variables
When is a correlation described as strong
0.8 or higher
When is a correlation described as weak
0.5 and less
How do you get to the table to enter the L1, L2, L3, etc. values
1) Press Stat
2) Press 1: Edit
How do you set up and graph a scatter-plot
1) Press 2nd → y=→Plot 1
2) Press Plot 1 → Enter
Make sure It says on
Make sure XList is L1
Make sure YList is L2
How do you perform a regression
1) Press Stat → CALC → 4:LinReg(ax+b) OR 5:QuadReg
2) Press Enter
How do you find y when given x
1) Press 2nd trace →1: value
2) At the bottom of the screen type on the given value for x
How do you find the line of best fit for a scatter plot
Plug the regression equation into y= and press graph
How do you find x when given y
1) Press y= and go down to y2 and enter the given y value there
2) Press Graph
3) Press 2nd trace → 5:intersect → 3x
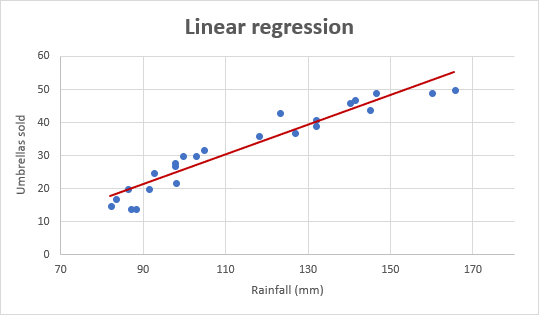
Linear Regresion Equation on a graph

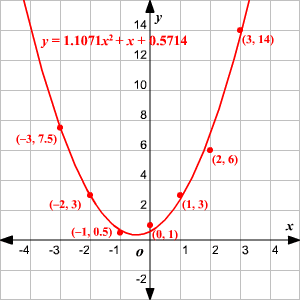
Quadratic Regression Equation on a graph

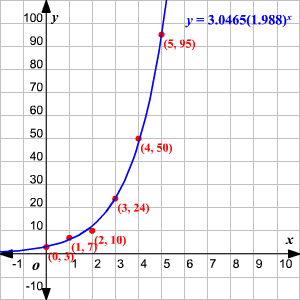
Exponential Regression Equation on a graph
