ANOVA
1/52
There's no tags or description
Looks like no tags are added yet.
Name | Mastery | Learn | Test | Matching | Spaced |
|---|
No study sessions yet.
53 Terms
crucial precondition for any statements of causality is
random assignment in an experiment
Research questions about differences between more than two independent groups (between-subjects design):
• Cannot conduct multiple t-tests (type-I error inflation) • Use analysis of variance = ANOVA
Analysis of variance characteristics:
• DV is interval/ratio scale
• IV is nominal scale (indicates group, AKA factor)
• ANOVA compares 3 (or more) groups
Hypotheses for 3 groups (k = 3):
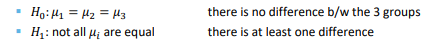
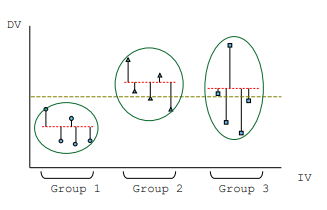
Analysis of variance what does it compare
between-group variation (variance explained by Group) and within-group variation (unexplained/residual variance)
• Test statistic t-test formula
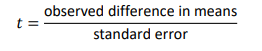
Standard error:
▪ Measure of variation in sample means
▪ = standard deviation of the sampling distribution
▪ = expected/ average difference under the null hypothesis
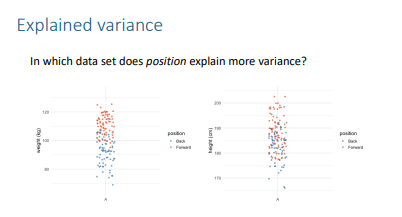
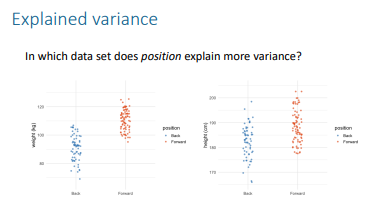
In ANOVA, why don’t we look at mean differences directly when comparing more than 2 groups?
Because we look at variances instead of direct mean differences.
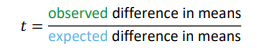
What is the general formula for the ANOVA test statistic?
F = observed variance in means / expected variance in means
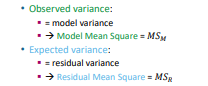
What does "observed variance" refer to in ANOVA?
The variance between the group means, also called model variance. ▪ = variance explained by the differences between the groups
What does "expected variance" refer to in ANOVA?
The variance within the groups, also called residual variance. = variance not explained by the differences between the groups
How is variance measured in ANOVA?
By Mean Squares (MS).
What is the formula for the F-statistic in terms of Mean Squares?
F = MSₘ / MSᵣ, where:
MSₘ = Mean Square for the model (between-group variance)
MSᵣ = Mean Square for the residual (within-group variance)
left
Assumptions of ANOVA
1. Random sample
2. Observations are independent
3. Dependent variable is at least interval scale
4. Dependent variable is normally distributed in each group
5. Homogeneity of variances (equality of within-group variances)
Dependent variable should be normally distributed in each group, no outliers present. How to check
• Check “Raincloud plot” in JASP. This means that the residuals are normally distributed!
• Check Q-Q plots of residuals (similar to regression
Steps in ANOVA
1. Check assumptions (homogeneity of variances, normality)
2. Check significance of the factor
3. Determine effect size for significant factors
4. Check post-hoc tests for significant factors with > 2 levels
5. Report significant results and state conclusions
Homogeneity: Equality of Within-group Variances. What does it check?
Checking the homogeneity of variances assumption:
• We need to check if the spread/ variance/ standard deviation in each group is (roughly) the same
Homogeneity of variances: Step 1
Create side-by-side boxplots: • Check if the IQR in each group is (roughly) the same
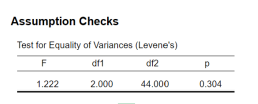
Homogeneity of variances: Step 2
Check Levene’s test for equality of variances in the output:
• If not significant, assume homogeneity
• Since the test is very strict, we use α = .01 instead of α = .05
Note: p-value > .01, hence the null hypothesis is not rejected →Assumption of homogeneity of variances is not violated, F(2, 44) = 1.22, p = .304.
Levene’s test doesn’t always work well • Problems if:
sample sizes differ a lot (between the groups)
▪ samples are all small (Levene’s test may not indicate problems with variances when – in reality – the variances are different)
▪ samples are very large (Levene’s test may indicate problems when there aren’t any)
Levene’s test: Alternatives. If samples are all small…
rely on boxplot
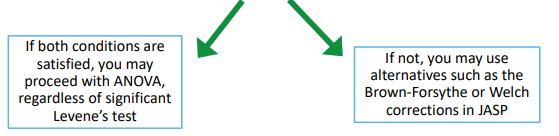
Levene’s test: Alternatives. If Levene’s test is significant and samples are not small:
▪ Check if largest sample < 4× smallest sample
▪ Check if largest variance < 10× smallest variance
example for levenes test check sample size
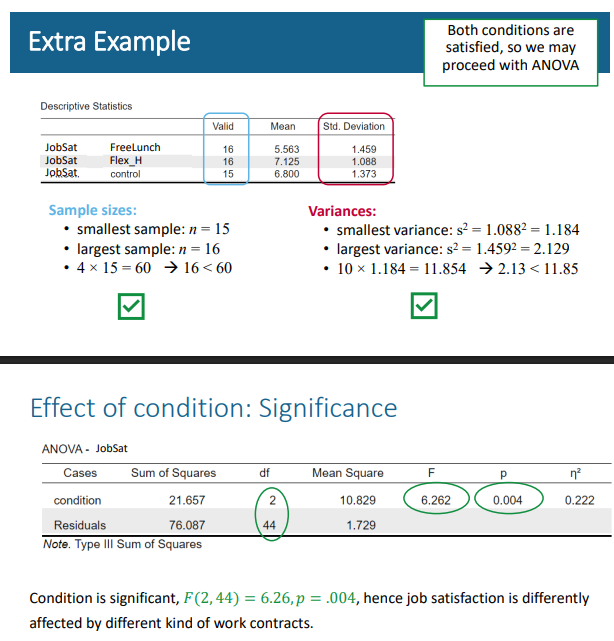

Effect of condition: Significance. When is signfiicant what do I write
Condition is significant, 𝐹(2, 44) = 6.26, 𝑝 = .004, hence job satisfaction is differently affected by different kind of work contracts.
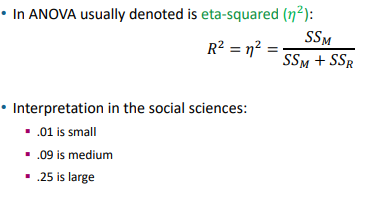
Effect size, normally and in ANova and formula
• Most-used measure of effect size is R-squared • In ANOVA usually denoted is eta-squared (𝜂 2 ):
What is the purpose of post-hoc tests in ANOVA?
To find out which specific groups differ after finding a significant overall effect.
What are post-hoc tests also called?
Pairwise comparisons
What type of statistical test is used in post-hoc comparisons?
t-tests with adjusted p-values
Why do we adjust p-values in post-hoc tests?
To correct for multiple testing and avoid Type I error inflation (false positives).
What is a Type I error (α error
The probability of getting a significant result when the null hypothesis is actually true (false positive).
What is a Type II error (β error)?
The probability of not getting a significant result when the null hypothesis is false (false negative).
What is the relationship between β error and power?
β error = 1 − power, so increasing power reduces the chance of a Type II error.
What is the relationship between power and Type I error (α)?
Power is not directly related to Type I error, but both depend on the significance level (α):
Power = the probability of correctly rejecting a false null (1 − β)
α (Type I error) = the probability of incorrectly rejecting a true null
Lowering α reduces the risk of Type I error, but also tends to lower power, increasing the chance of a Type II error.
- Raising α increases power but also increases the risk of a Type I error.
What happens to the overall Type I error rate as the number of tests increases?
The overall α increases, meaning the chance of making at least one false positive increases with more tests.
What is the overall α for 1, 2, and 3 tests with α = .05 per test?
1 test → overall α = .05
2 tests → overall α ≈ .0975
3 tests → overall α ≈ .1426
What is the probability of making at least one incorrect decision across 3 tests if H₀ is true?
1 − (.95³) = .1426
Why do we need post-hoc correction in ANOVA?
To control the overall Type I error rate when making multiple comparisons.
What are three types of post-hoc corrections?
Bonferroni: for small number of groups
Tukey’s HSD: for large number of groups
LSD: no correction (only when comparing two groups)
What is the trade-off of controlling Type I error in post-hoc testing?
Reducing Type I error also reduces statistical power, making it harder to detect true effects.
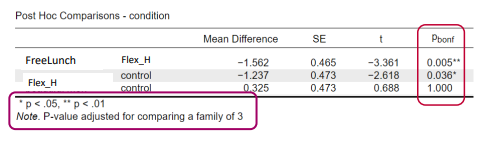
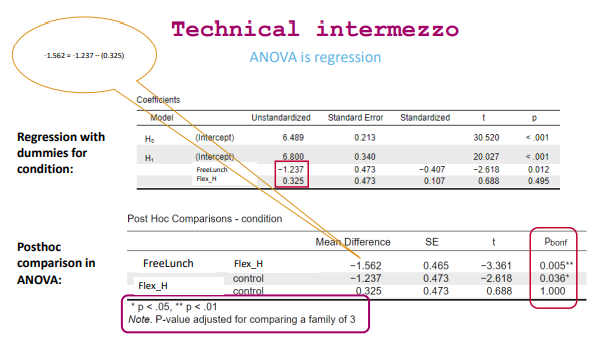
interpret this
On average, employes that receive free lunch but work every day from the office rate their job satisfaction 1.56 point lower employees with flexible home days. This mean difference is significant (𝑝 = .005) • On average, employees that receive free lunch but work every day from the office rate their job satisfaction 1.24 point lower than those with a regular contract (1-home day and 4 at office). This mean difference is significant (𝑝 = .036)
What are post-hoc tests used for in ANOVA?
They are used to compare all possible pairs of groups after finding a significant effect. They use adjusted p-values to correct for multiple testing and reduce Type I error risk.
What are contrasts used for in ANOVA?
They are used to test specific hypotheses about group differences defined before the analysis.
Why are contrasts often more powerful than post-hoc tests? When should you use contrasts instead of post-hoc tests?
Because they involve fewer comparisons and usually don’t require correction for multiple testing.
When you have theoretical expectations or specific comparisons you want to test.
How can ANOVA be interpreted in terms of regression?
ANOVA can be seen as a regression model with dummy variables for categorical predictors.
In the regression model 𝑦̂ = b₀ + b₁FL + b₂FH, what does b₀ represent? and b1?
b₀ is the intercept, representing the mean of the control group (reference category). b1 is The difference in mean between the Free Lunch (FL) condition and the control group.
How to interpret Bayes factor?
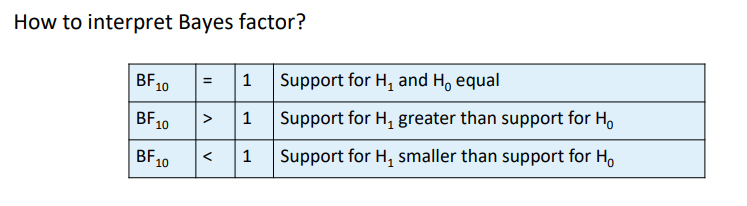
interpret
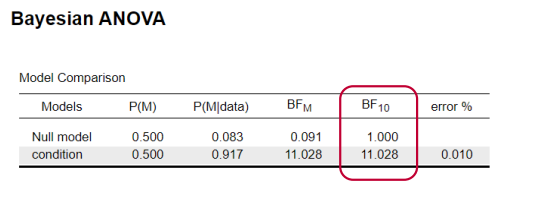
The data are 11 times more likely under the alternative hypothesis than under the null hypothesis
• Support for “effect of condition” much larger than for “no effect”
• Post-hoc testing needed to see which conditions differ from each other
What does it mean if Posterior Odds < Prior Odds?
The data provides support for the null hypothesis (H₀) → Bayes Factor (BF) < 1.
What does the "U" in BF₁₀, U mean?
It stands for uncorrected Bayes Factor — not adjusted for multiple comparisons.
How is multiple testing handled in Bayesian post-hoc analysis?
Posterior odds are corrected by fixing the prior probability that H₀ is true across all comparisons.
Odds: bf
Odds = 1: Chance of H0 and H1 are equal
▪ Odds > 1: Chance of H1 larger than H0
▪ Odds < 1: Chance of H1 smaller than H
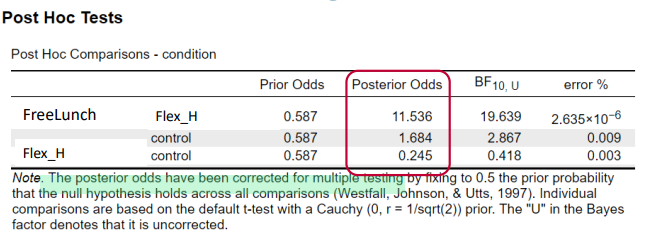
interpret
The data strongly supports the idea of a difference between FL and FH ▪ The data supports the idea of a difference between FL and C ▪ The data does not support the idea of a difference between FH and C