ECON 101: Supply and Demand
1/31
There's no tags or description
Looks like no tags are added yet.
Name | Mastery | Learn | Test | Matching | Spaced |
|---|
No study sessions yet.
32 Terms
model
a highly simplified representation of a more complicated reality. Assumptions simplify the complex world making it easier to understand.
Market
a group of buyers and sellers of a particular product. For now we assume all markets are perfectly competitive.
In a perfectly competitive market what are the assumptions being made? [4]
All goods are exactly the same (i.e. homogenous) (ex: apples, gasoline)
Buyers & Sellers so numerous that no one can affect the market price- each is a “price taker.” (on a big scale, planting one additional acre of land won’t affect market price.)
There is perfect information (you can easily access the price of goods)
There are no barriers to entry/exit (the diamond market has many barriers to entry.)
Demand (quantity demanded, demand schedule, demand curve.)
quantity demand- is the amount of the good that the buyers are willing in able to purchase at a particular price (a point on a chart)
demand schedule: a table that shows the relationship between the price of a good and the quantity demanded (the chart)
demand curve- a curve connecting each point within the demand schedule (the line.)
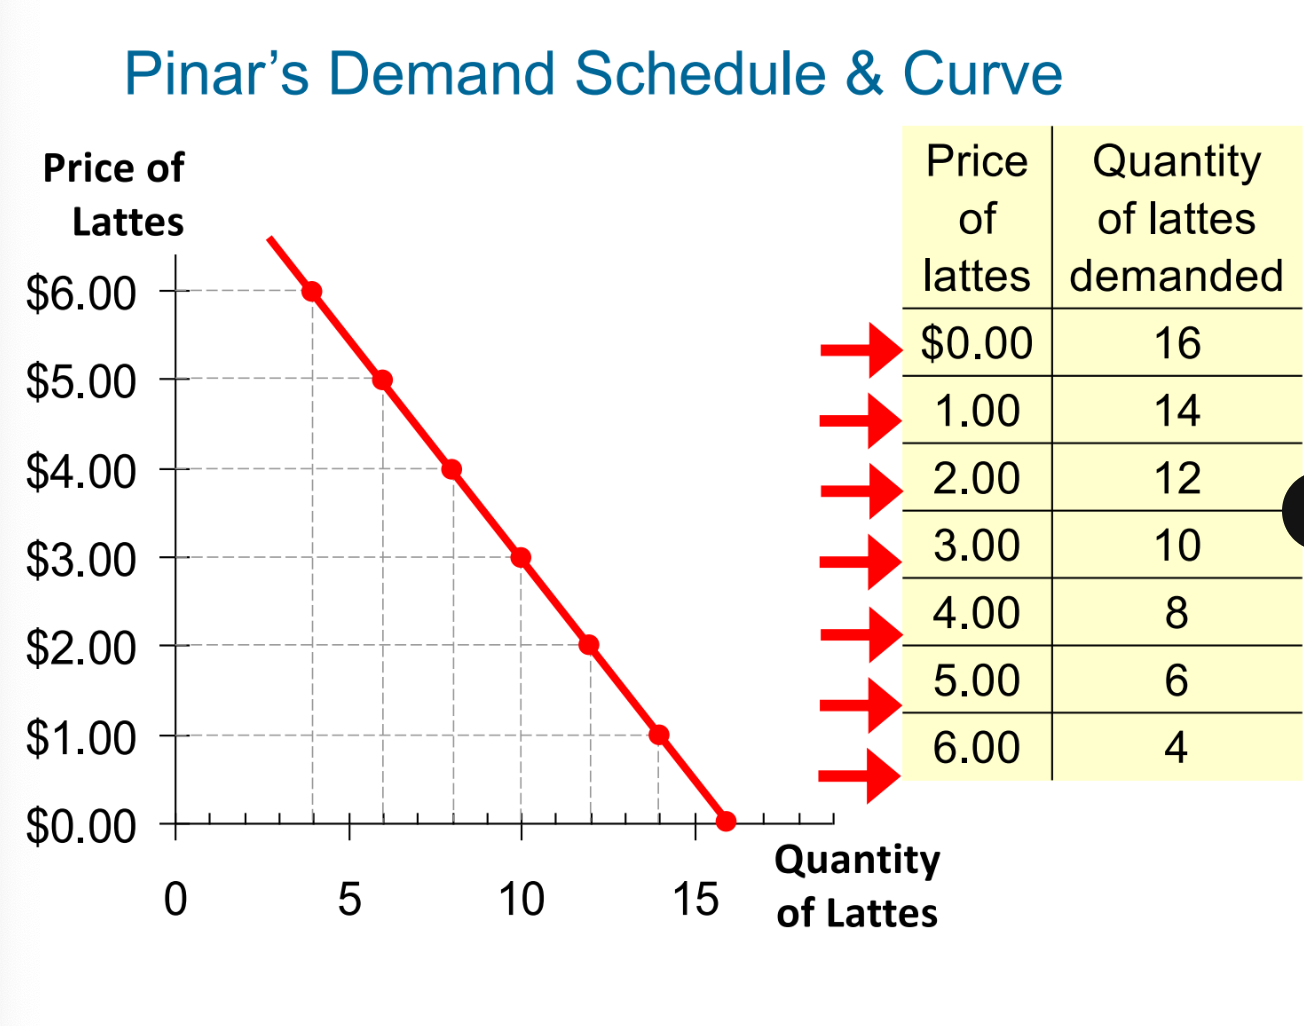
Law of demand
The quantity demanded of a good falls when the price of the good rises. The higher the price, the lower the quantity demanded. given other factors are equal.
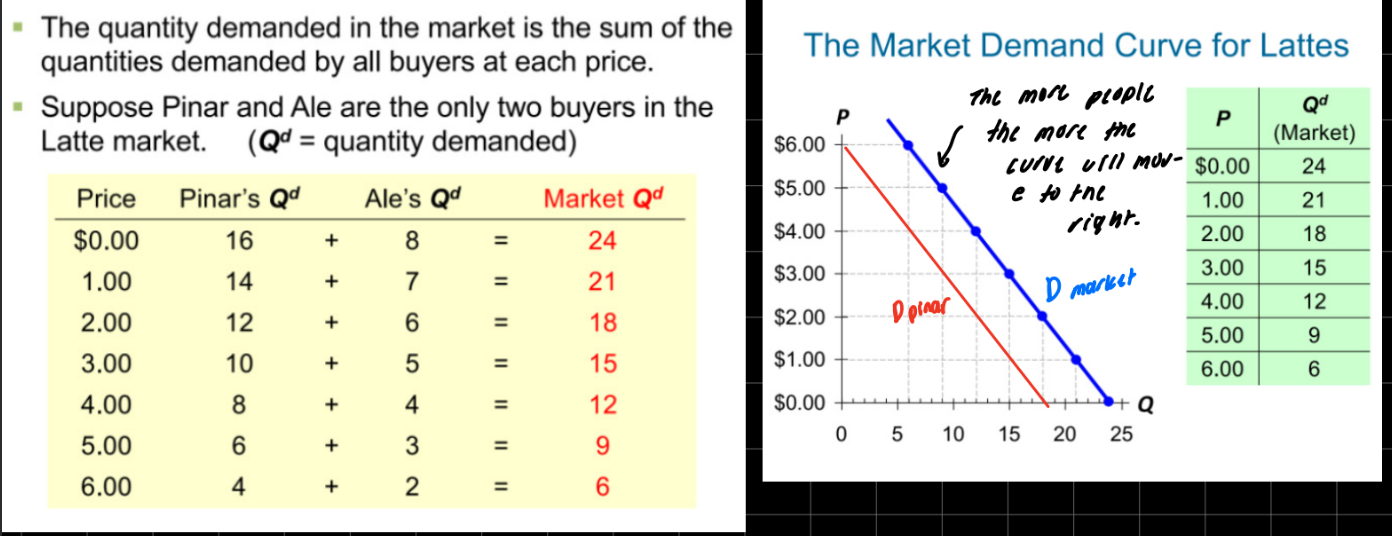
market demand versus individual demand
market demand- sum of quantities demanded by all buyers at each price.
individual demand- a single persons quantity demanded
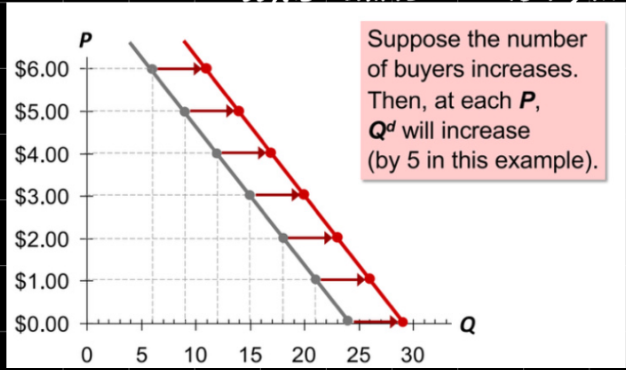
demand curve shifters
1) # of buyers
2) Income
3) Price of Related goods (subsitutes, and compliments)
4) Tastes
5) Expectation
1) # of buyers.
increase in buyers shifts D to the rights, decrease in buyers shifts d to the left.
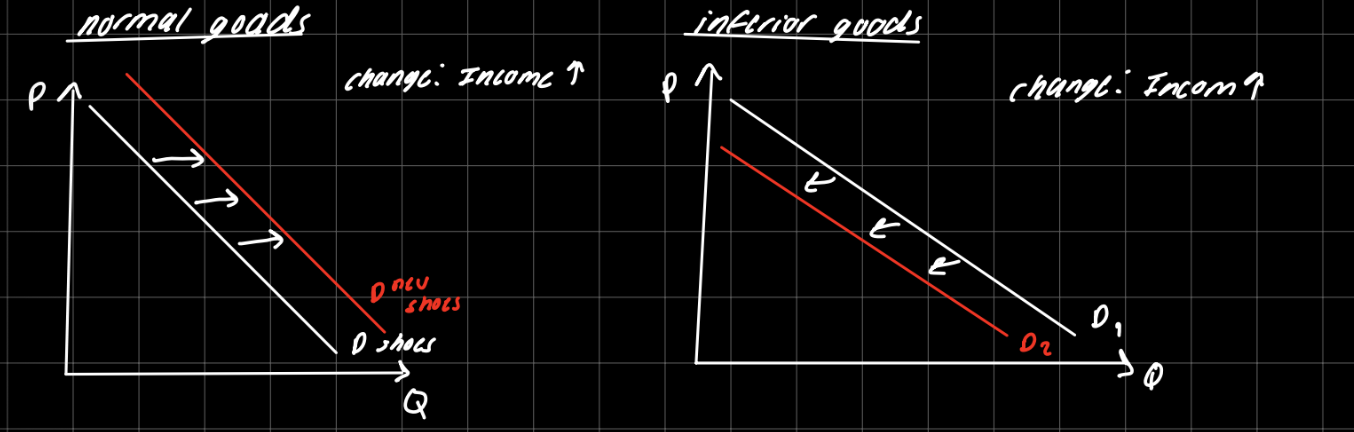
2) income
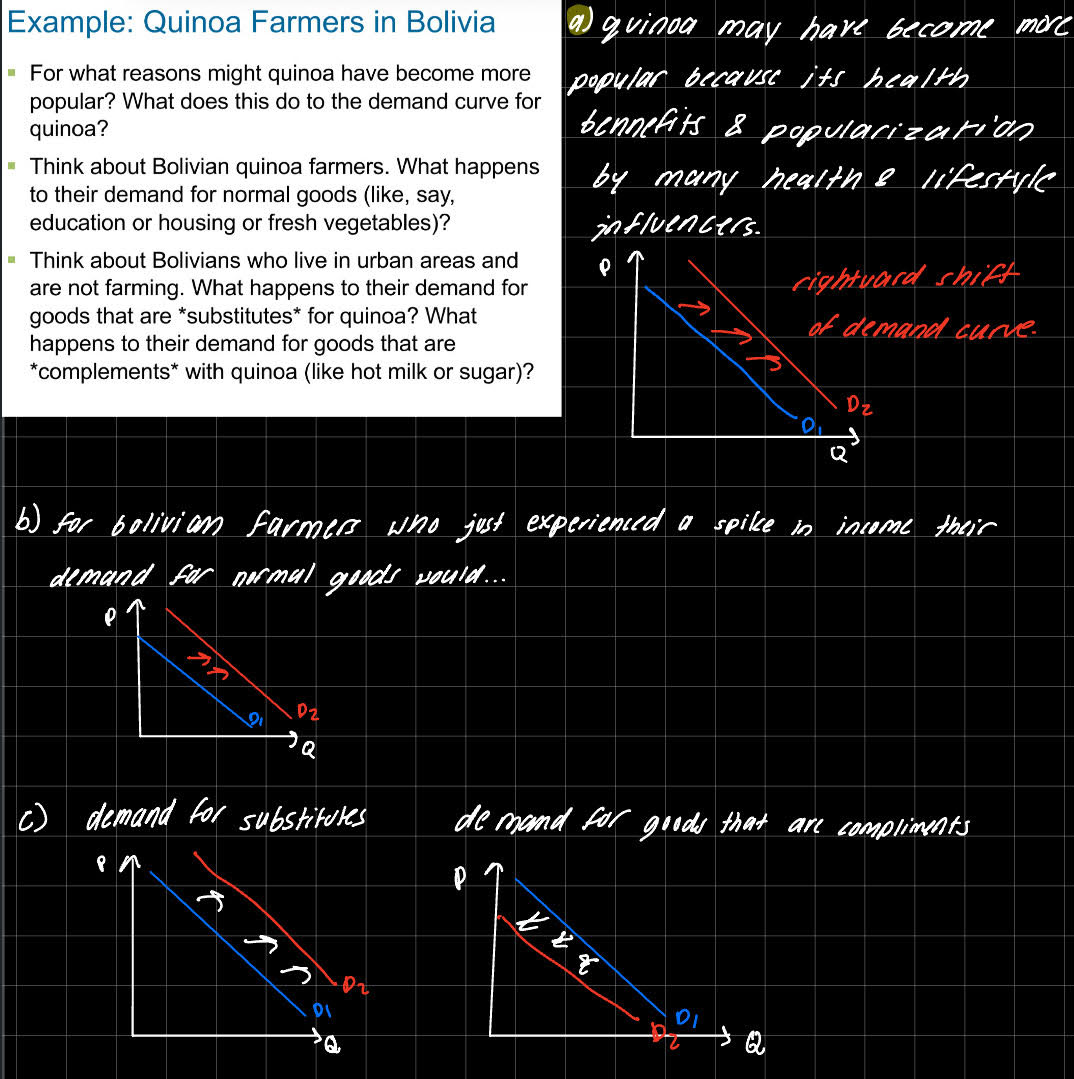
Demand for a normal good shifts to the right if income increases. (positively related)
Demand for an inferior good godes shifts to the left if income increases. (negatively related.
3) Prices of related goods.
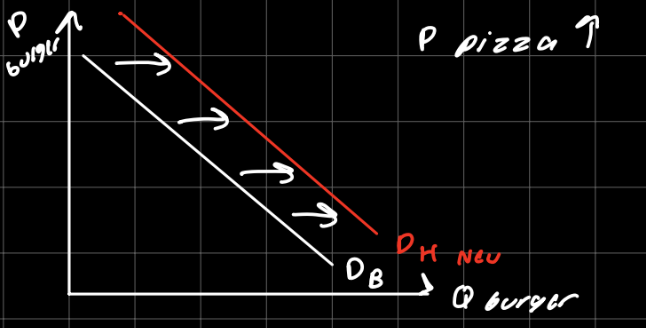
If 2 goods are substitutes, a price increase in one good causes a demand increase in the alternative good.
If 2 goods are complements, an increase in the price of noe causes a fall in the demand for the other.
Ex: if the price of computers rises, people buy fewer computers and therefore less software. Software’s demand curve shifts left.
4) Tastes
anything that causes a shift in tastes towards a good will increase demand for that good, d curve shifts to the right.
5) Expectation
expectations affect consumers buying decisions.
Ex: if people expect their income to rise, their demand of food from expensive restraunts will increase.
what variables shift the D curve?
numbers of buyers
income
price of related goods
tastes
expectation
what causes movement ALONG the D curve
price
Assume Leo buys coffee beans in a competitive market. It follows that:*
1/1
a. Leo has a limited number of sellers from which to buy coffee beans.
b. Leo will negotiate with sellers whenever he buys coffee beans.
c. Leo can influence the price of coffee beans if he buys a large quantity of them.
d. None of the above is correct.
d
a. Leo has a limited number of sellers from which to buy coffee beans. This is incorrect. In a competitive market, there are a large number of sellers.
b. Leo will negotiate with sellers whenever he buys coffee beans. This is incorrect. As a price taker, Leo has no leverage to negotiate the price. He must buy at the prevailing market price.
c. Leo can influence the price of coffee beans if he buys a large quantity of them. This is incorrect. Because there are so many buyers and sellers, Leo's individual purchases, no matter how large, are a tiny fraction of the total market demand and will not influence the overall price.
Which of the following changes would not shift the demand curve for a good or service?*
1/1
a. a change in income
b. a change in the price of the good or service
c. a change in expectations about the future price of the good or service
d. a change in the price of a related good or service
b
You lose your job and, as a result, you buy more frozen pizzas. For you, frozen pizza are a(n):*
1/1
a. luxury good.
b. inferior good.
c. normal good.
d. complementary good.
b
Quantity Supplied (Qs)
the ammount of a good/service that sellers are willing and able to sell at a given price
supply schedule
a table that show the relationship between the price of a good and the quanitity supplied.
Law of supply
quantities supplies of a good increase as the price of that good increases.
Market supply vs individual supply
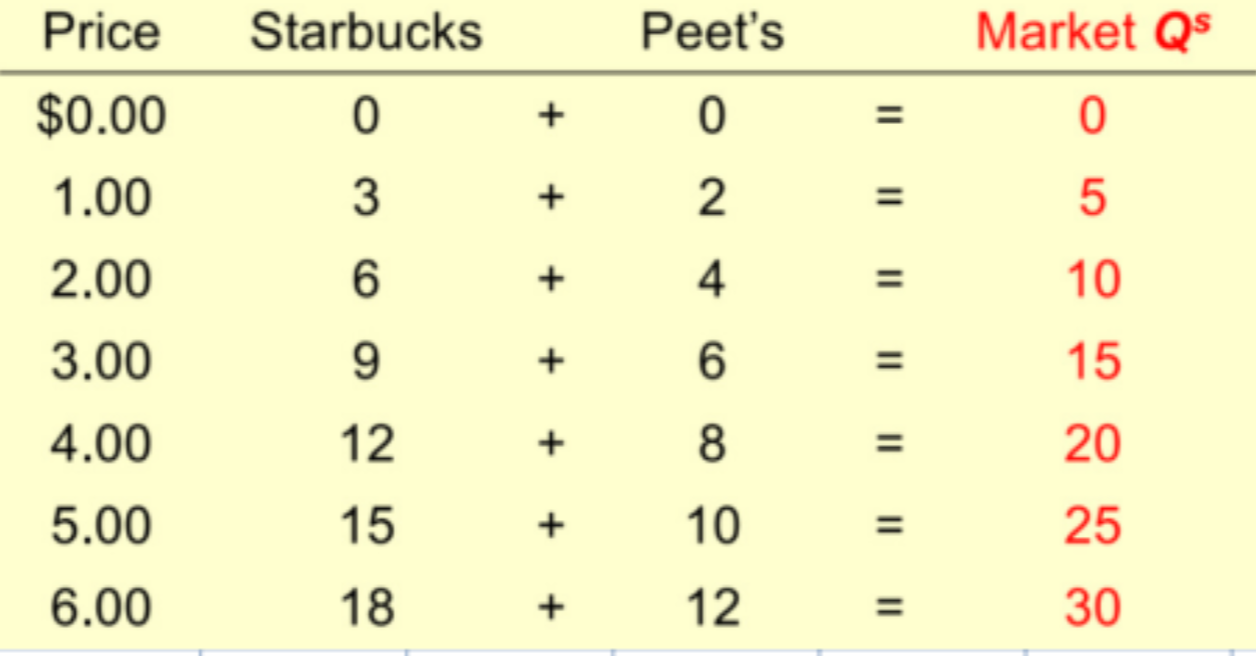
the quantity supplied in the market is the sum of quantities supplied by all sellers at each price.
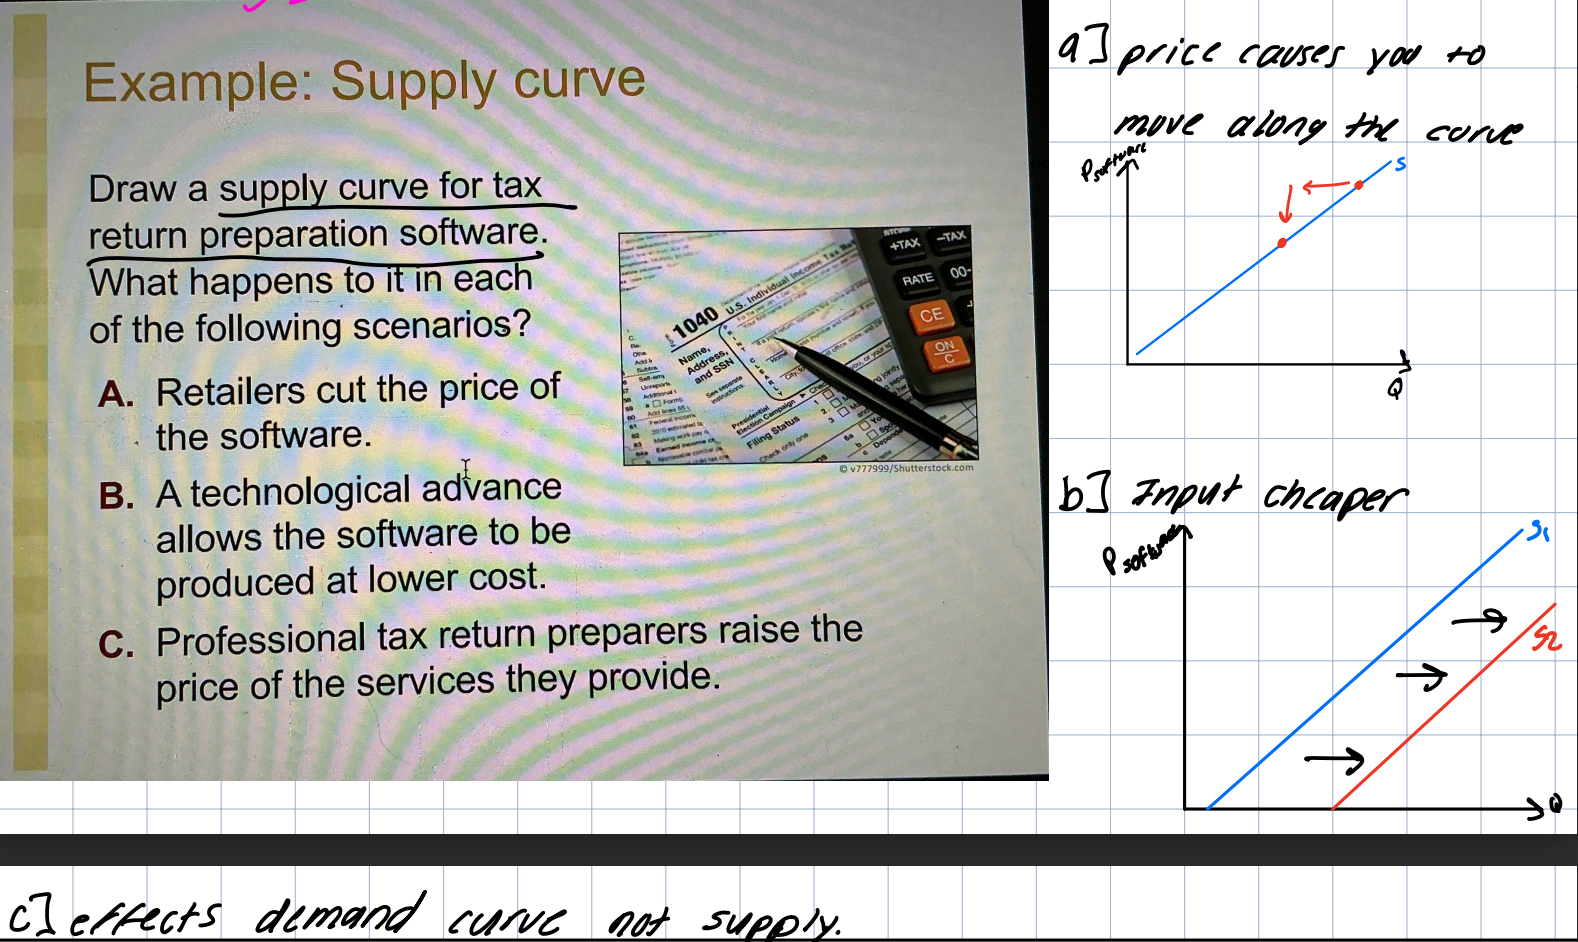
supply curve shifters
-input price
-technology
-related goods
-# of sellers
-expectations
*price causes movement along s curve.
input price
The cost of things used to create a good. A fall in input price makes production more profitable so the supply curve shifts right.
Technology
A cost saving technology has the same effect as a fall in input prices.
related goods
compliments- donut holes and the donut.
Substitutes- pancakes or waffles.
number of sellers
increases in the number of sellers causes a shift to the right.
expectation
sellers may adjust supply when their expectations of future prices change (withholding selling oil because of upcoming sanctions.)
Which of the following would cause a movement along the supply curve for cupcakes?*
1 point
a. an improvement in technology for commercial mixers
b. a decrease in the price of cupcakes
c. an increase in the price of cake flour
d. All of the above are correct.
b
Which of the following would shift the supply of Green Bay Packers football jerseys to the left?*
1 point
a. The Green Bay Packers make it to the Super Bowl.
b. The price of the jerseys increases by $15.
c. The technology of sewing machines use to make the jerseys improves.
d. The cost of the fabric used to make the jerseys increases.
d
Which of the following might cause the supply curve for an inferior good to shift to the right?*
1 point
a. an increase in input prices
b. a decrease in consumer income
c. an improvement in production technology that makes production of the good more profitable
d. a decrease in the number of sellers in the market
c