Graphing and Stats AP Bio
1/36
There's no tags or description
Looks like no tags are added yet.
Name | Mastery | Learn | Test | Matching | Spaced |
|---|
No study sessions yet.
37 Terms
Scientific Method
An orderly pattern of gathering and analyzing information
Inductive Reasoning
Form of reasoning based purely on what is observed at a given point in time (without prior knowledge)
Inductive reasoning = hypothesis based on observations
Deductive Reasoning
based on prior knowledge, this type of reasoning allows you to assume certain facts in order to predict what and why something happened
deductive reasoning = formulate conclusions based on data
Steps in the scientific method
-Make observation
-Form hypothesis
-Designing an experiment
-Performing experiment
-gathering results
-drawing conclusions
Observation
act of noting or percieving objects or events using the senses.
Hypothesis is/is not in if/then format and hypothesis is in present/future tense
is not in if/then format, is in future tense
Hypothesis must include tested group/species true or false
true
Hypothesis
explanation that might be true (must have the ability to be tested by observations and/or experimentation)
Inference
logical outcome of a test based
Prediction
Expected outcome of a test, assuming the hypothesis is correct
Experimental group
planned procedure that tests a hypothesis. minimum 3 experimental groups
Control group
group in an experiment that recieves no experimental treatment, and is thus necessary for comparing the results of an experiment. Control group used to find null hypothesis, not used in experiments usually.
Independent variable
factor that is changed in an experiment
Science uses quantitiative/qualitative data
quantitative: data is in numbers and facts
Dependent variable
factor that is measured in an experiment. The outcome of the dependent variable depends on what is done to the independent variable.
Control variables
factors that are NOT changed in an experiment; applied to all groups
2 variables that are always control?
amount of time, same species/sample size
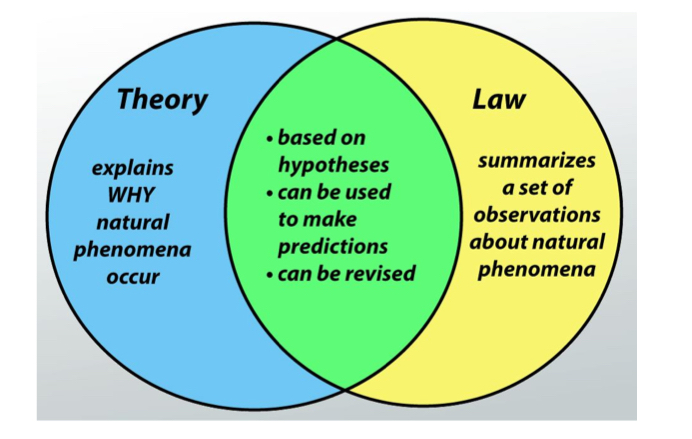
Theory
Provides an explanation of observed facts and a basis for future discussion or investigation.
Explains why phenomena occur
needs evidence
Law
A theoretical principle deduced from particular facts
Typically mathematical expressions representing how nature will behave under certain conditions.
Explain how nature behaves
Contrary to common understanding, scientific theories DO NOT become laws if proven/believed
Undertstood
Basic traits of a good graph
a good title
numbered axes
axes should have labels including units.
the independent variable is on the x axis
the dependent variable is shown on the y axis
Extrapolation
A prediction of what the graph might look like beyond the measured set of data. A broken line is used, indicating this is a prediction and not data actually collected. Never asked to use extrapolation on ap exam. Don’t make up numbers when saying the extrapolation in words. Ex: say “I would assume that the trend would decrease” not “at 5 hours, A would be at 0 milligrams”.
Line graphs
used when data on the x and y axes are continous. Points on the line incidate measurements that were actually made. Over time = line graph. Only use key when there are 2+ lines.
Bar Graphs
Visually compare two samples of categorical or count data. Also used to visually compare the calculated means with error bars of normal data. use key with 2+ bars per group. Never shade in bars.
Scatterplots
Used when comparing one measured variable against another. Used when looking for trends. Bar graph, but don’t know what the independent variable is? Its a scatter plot.
Error Bars
Capital “I”s at the top of each bar in a bar graph that shows the standard error of the mean (calculated using 2+- average).
What is a null hypothesis?
States that there is no relationship between two variables. The finding that prompted the experiment was probably coincidental. If a null hypothesis is hypothesized to be true, then the experiment is done to gather the data to determine if the null hypothesis is accepted or rejected.
What is an alternative hypothesis?
states that there is a relationship between two variables. the finding has a scientific reason for itself and didnt occur by chance.
What is the chi-square test used for?
used to examine the difference between an actual sample and a hypothetical sample that would be expected due to chance. The goal of it is to find out if the null hypothesis is accepted or rejected.
What are observed results?
what you actually observed in your experiment.
what are expected results?
A prediction of what the data would look like if the experimental results are due only to chance.
Three types of expected results?
Genetics: determined by looking at genotypic/phenotypic ratio of monohybrid/dihybrid crosses (ex: if looking at birth rate of flies with a heterozygous genotype, refer to monohybrid genotype ratio (1:2:1) to get your expected results)
Preference: Expected results are equal among every group since the organism doesnt prefer any variable over the other.
Law: given to you
How do you get expected results
use punnet square ratio for genetics problem, use probability for other types of problem.
What is the chi-square equation?
(sum of all) x (observed - expected)²/expected
What is the function of a chi-square table?
If your chi-square is over a critical value demonstrated by the table, the null hypothesis is rejected. the opposite if it is under the critical value.
How do you calculate degrees of freedom for the chi-square table?
Degrees of freedom = # of categories - 1
Overall steps to figure out if null hypothesis is accepted or rejected
determine if a null hypothesis is possible
Calculate expected results
Solve chi square
Find degree of freedom
find column of chi square table that aligns with the degree of freedom
Determine if null hypothesis is accepted or rejected by seeing if critical value is less or greater than the x².