Data Mining (TU Delft Exam + general knowledge)
1/11
There's no tags or description
Looks like no tags are added yet.
Name | Mastery | Learn | Test | Matching | Spaced |
|---|
No study sessions yet.
12 Terms
What are (in anomaly detection)
point anomalies
contextual anomalies
collective anomalies
Point anomalies = an individual strange data point
Contextual anomalies = a data point that is only strange given a set of other data points as context
Collective anomalies = a set of data points that together are strange
——————
source: https://hackernoon.com/3-types-of-anomalies-in-anomaly-detection
From the following categories, name some models and techniques that identify points anomalies.
Unsupervised models
Distance-based techniques
Data reconstruction techniques
Unsupervised models - they identify isolated data points
isolation forest (IF)
one-class SVM
Distance-based - they identify points that are far apart from others
K-NN
DBSCAN
LOF
Data reconstruction
PCA
Autoencoders
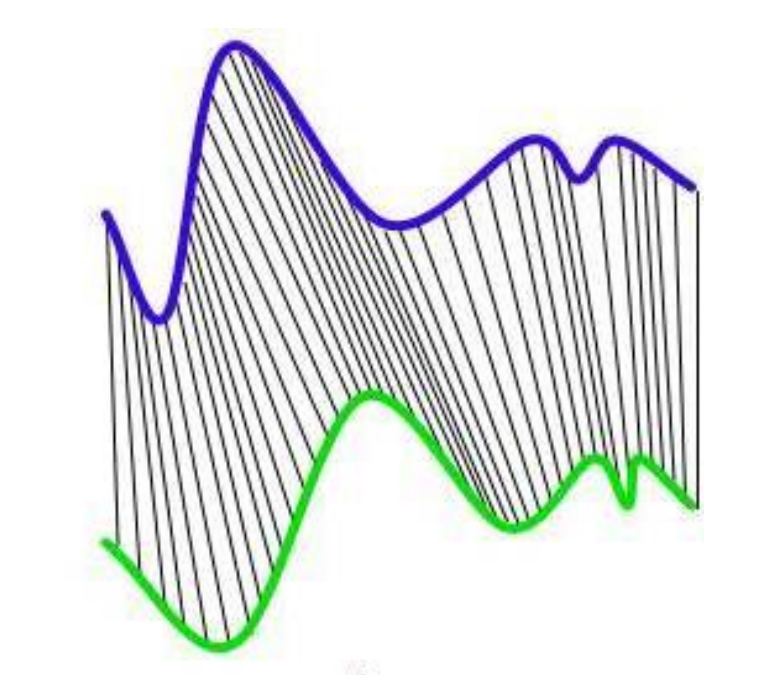
What is the goal of DTW ?
To align time-series non-linearly in time, trying to find the best match
What are the steps of PCA ? (if you were to implement it from scratch in code)
Data Matrix X: n × d, (n data points, d dimensions)
Normalize the data
mean-shift the data: xi = xi - μx
turn each point into its z-score: xi = (xi - μx)/σx
Calculate the Covariance Matrix
Compute the eigenvectors of the covariance matrix
Order the EVs by the size of their eigenvalues
Use the transformation matrix K (matrix K = the eigenvectors, put together as columns, forming a matrix) to project the original data matrix into “component space”
Compute the explained variance for each principle
component.
Reproject the data from component space back to raw
data space. Compute pointwise distance to raw data
(reprojection error).
What is the explained variance in PCA ?
Explained variance = The variance in the original data that is explained by each Principle Component = the value of the eigenvalue for that principle component, divided by the sum of all eigenvalues
What is z-score (aka standard score) ?
The z-score, also known as the standard score is a statistical measure that tells you exactly how many standard deviations a data point is from the mean of its dataset.
In PCA, what is Cumulative Explained Variance ?
Why do we need data normalization in PCA ?
How do you actually compute the matrix for DTW if you were to write it in code ?
What is the difference between normal hashing and LSH (locality sensitive hashing) ?
Normal hash functions try to minimize the probability of collision.
LSH hash functions try to maximize probability of similar items colliding.
If in LSH 2 distant points are hashed in the same bucket, how can you fix this and make LSH more reliable ?
use more hash functions in combination with AND constructions: 2 points are similar if they occur in all query bins
If in LSH 2 nearby points are hashed in different buckets, how can you fix this and make LSH more reliable ?
OR-constructions: Points are candidate neighbors if they can be found together in any of the bins