Central Tendency
1/18
There's no tags or description
Looks like no tags are added yet.
Name | Mastery | Learn | Test | Matching | Spaced | Call with Kai |
|---|
No analytics yet
Send a link to your students to track their progress
19 Terms
Central Tendency
A statistical measure that describes a single score that is the center of a distribution
Goal is to find the single score that is most typical or most representative of the entire group
Characterised in 3 ways:
The point of which a distribution would balance
The value who’s average absolute deviation from all other values is minimised
The value who’s squared deviation from all other value is minimised
Measures of Central Tendency
MEAN: X̄ = ∑X / N
MEDIAN: The point at or below which 50% of the scores fall when the data are arranged in numerical order
MODE: The most common score; also can be identified as the highest point in a distribution
Mean
The amount of X each individual would get if the total (∑X) were divided equally among all the individuals (N)
FORMULA) X̄ = ∑X / N
Computed by adding all the scores (the sum ∑X/∑fX) and dividing by the number of scores (N)
Population mean: μ
Sample mean: X̄ or M
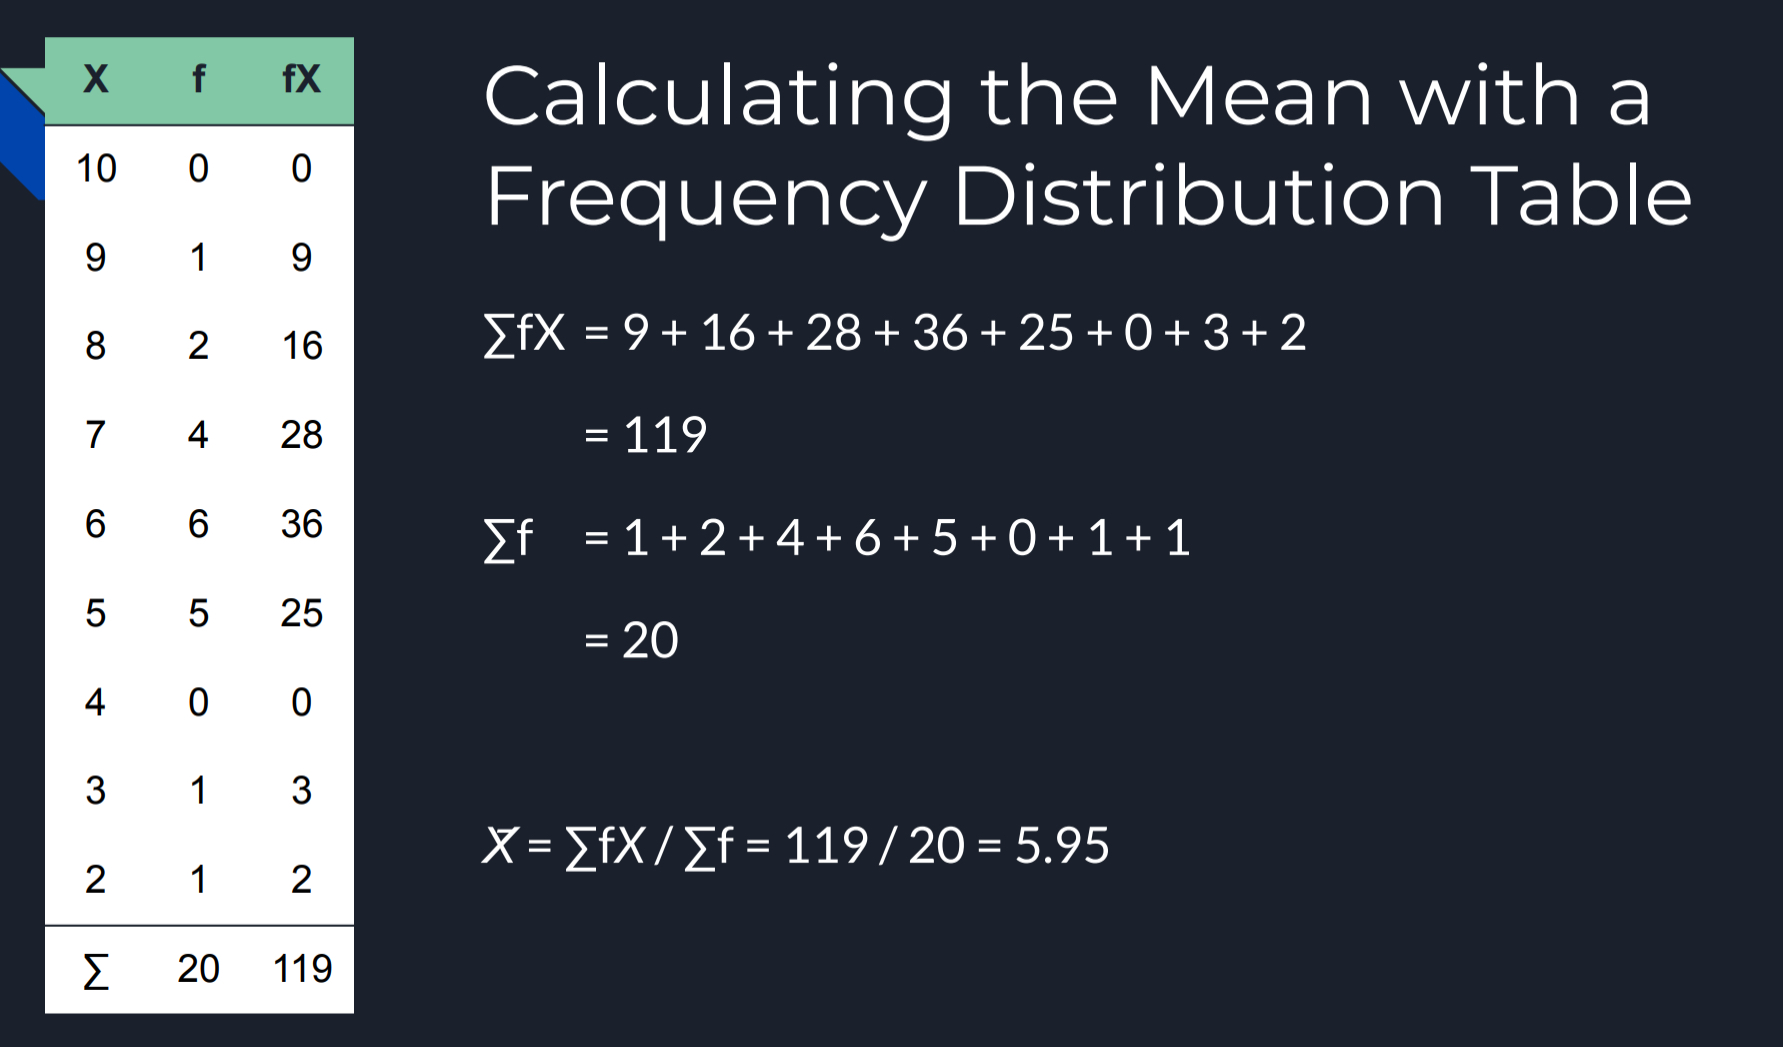
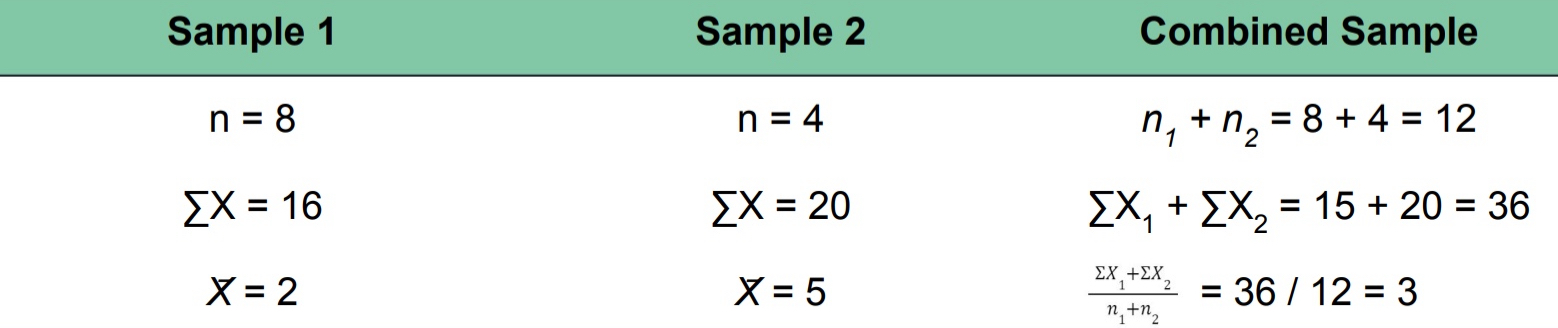
Weighted Mean (Calculating the Overall Mean)
Overall mean
X̄ = ∑X (Overall sum for the combined group) / N (Total number of scores for the combined group)
Characteristics of the Mean
Changing a score
Changes the mean
Introducing or Removing a score
Usually changes the mean
Adding or Subtracting a constant from each score
Same constant is added/subtracted to/from the mean
Multiplying or Dividing each score by a constant
Mean changes the same way
Common way to change the unit of measurements
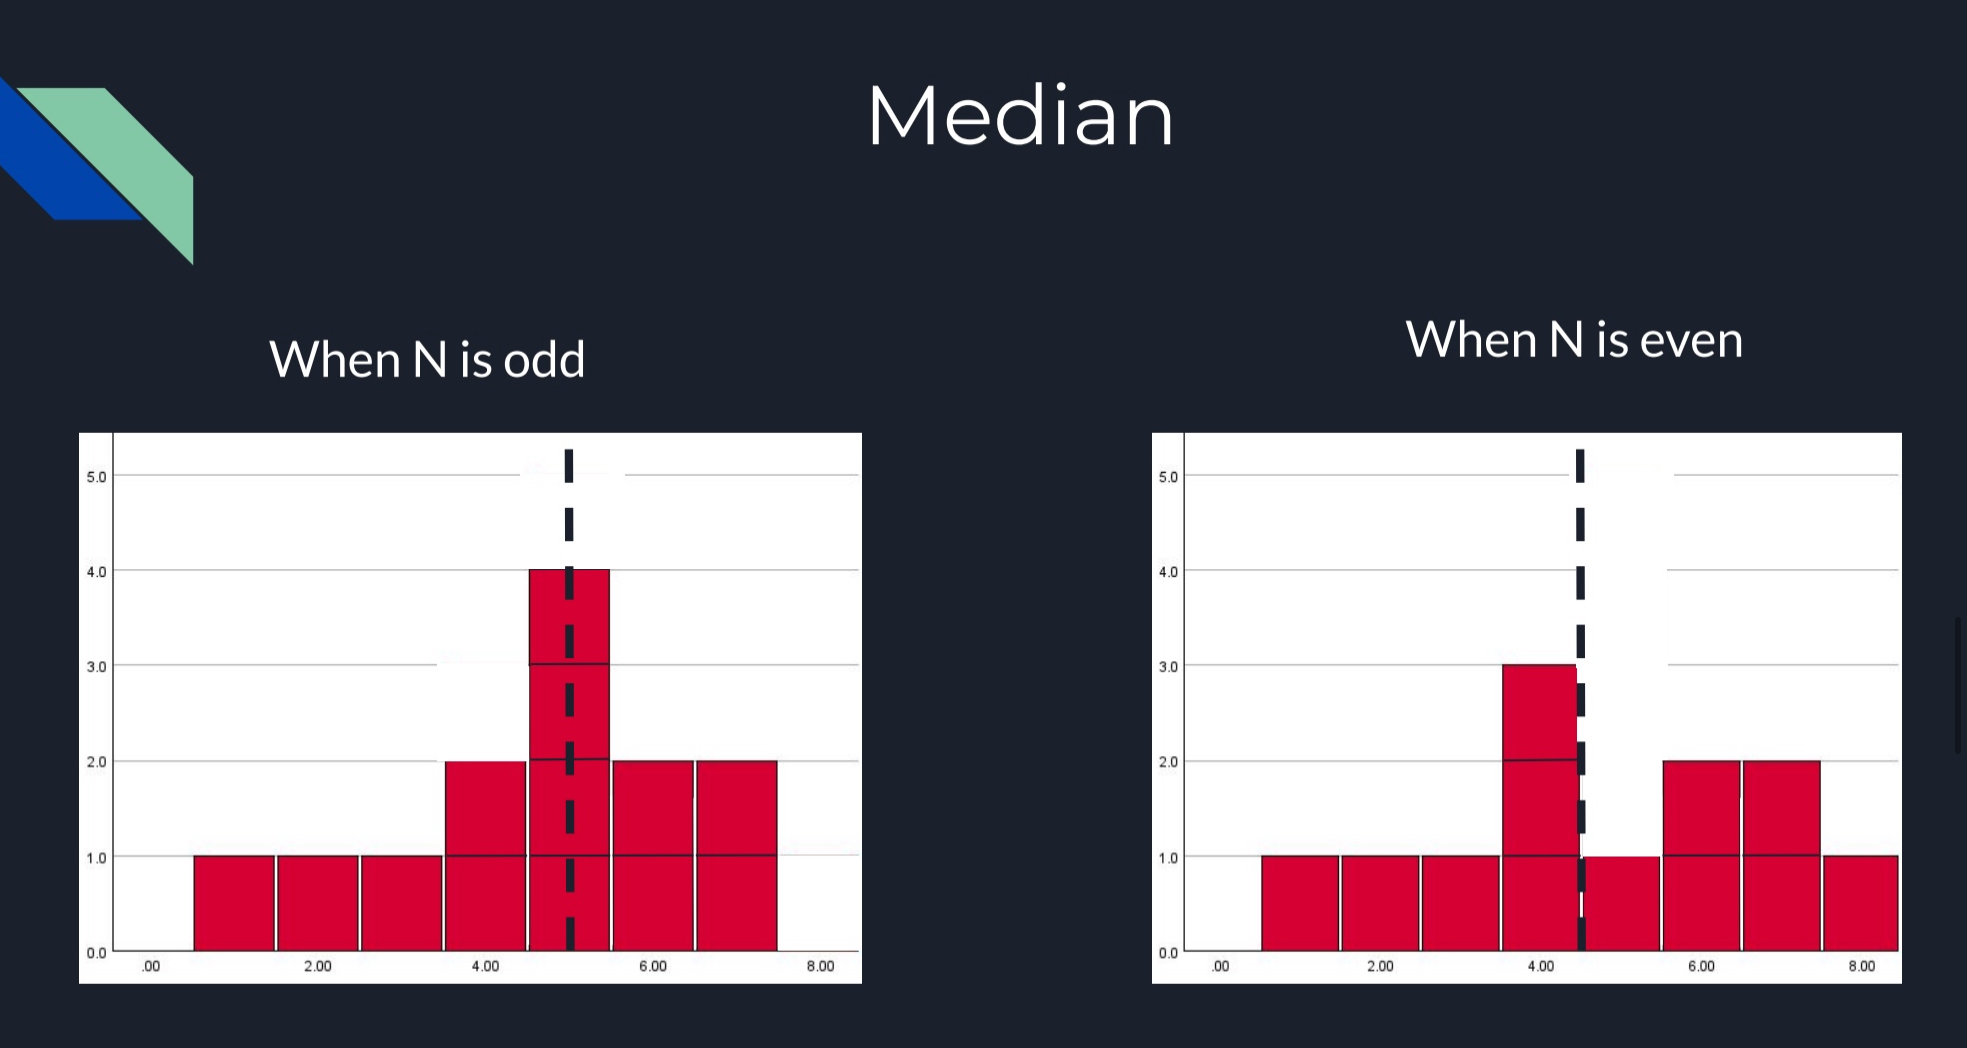
Median
The score that divides the distribution in half so that 50% of the individuals in a distribution have scores at or below the median
The scores are divided into equal-sized groups
EXAMPLE)
N (population) ODD: 1, 2, 4, 5, 6
N (population) EVEN: 1, 2, 4, 4, 5, 6
Mode
The score or category that has the greatest frequency
Can be used with any scale of measurement

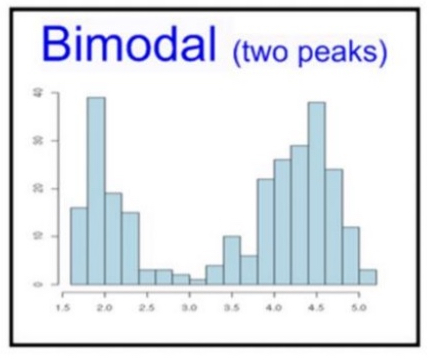
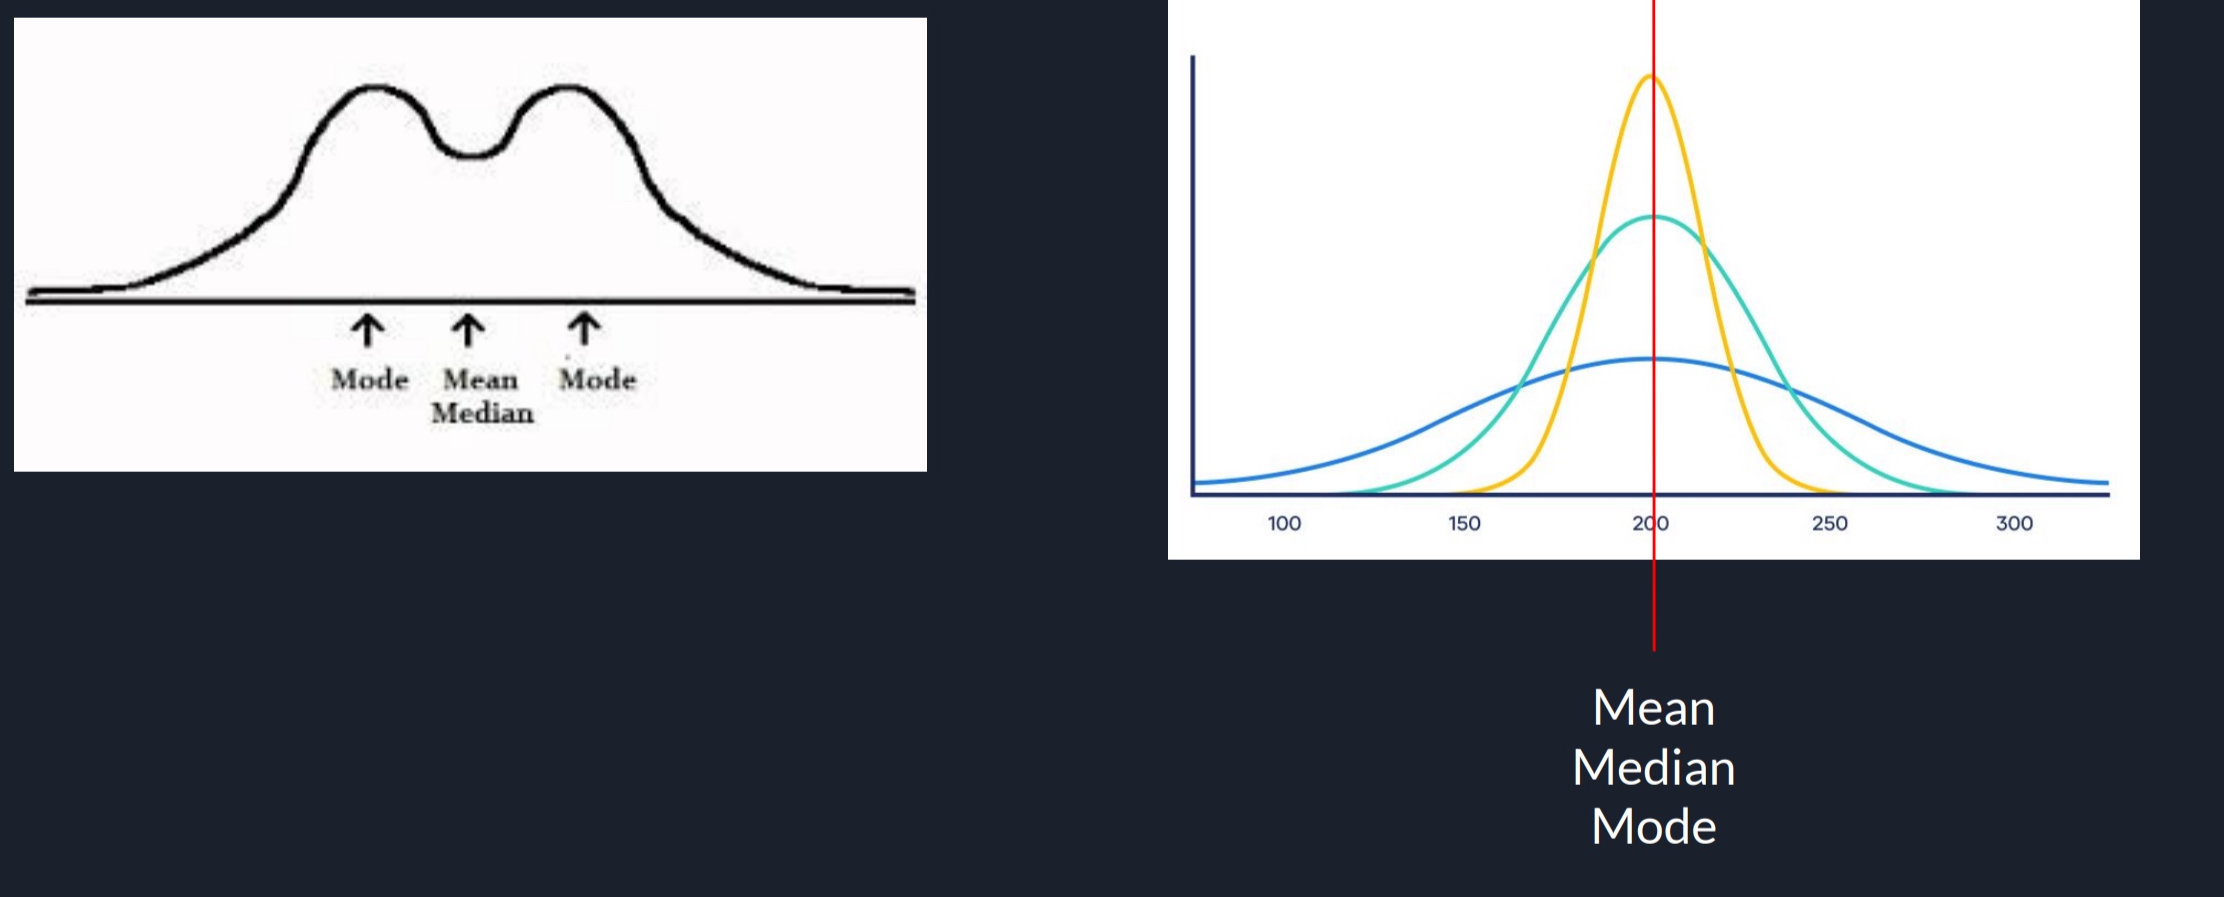
Bimodal
Has two peaks
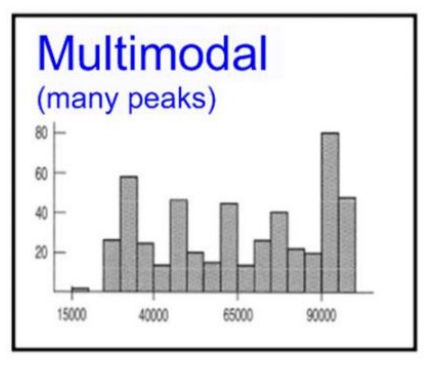
Multimodal
Has many peaks
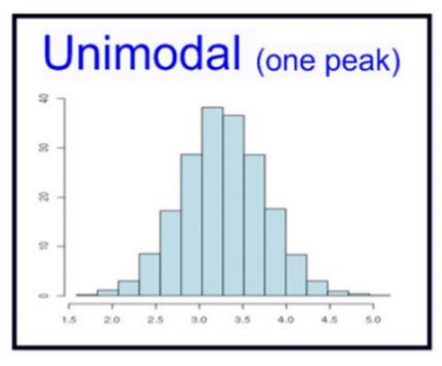
Unimodal
Has one peak
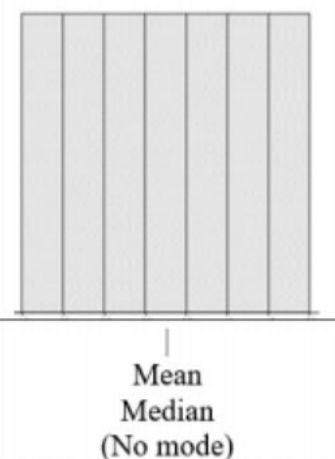
No Mode
Same level (rare)
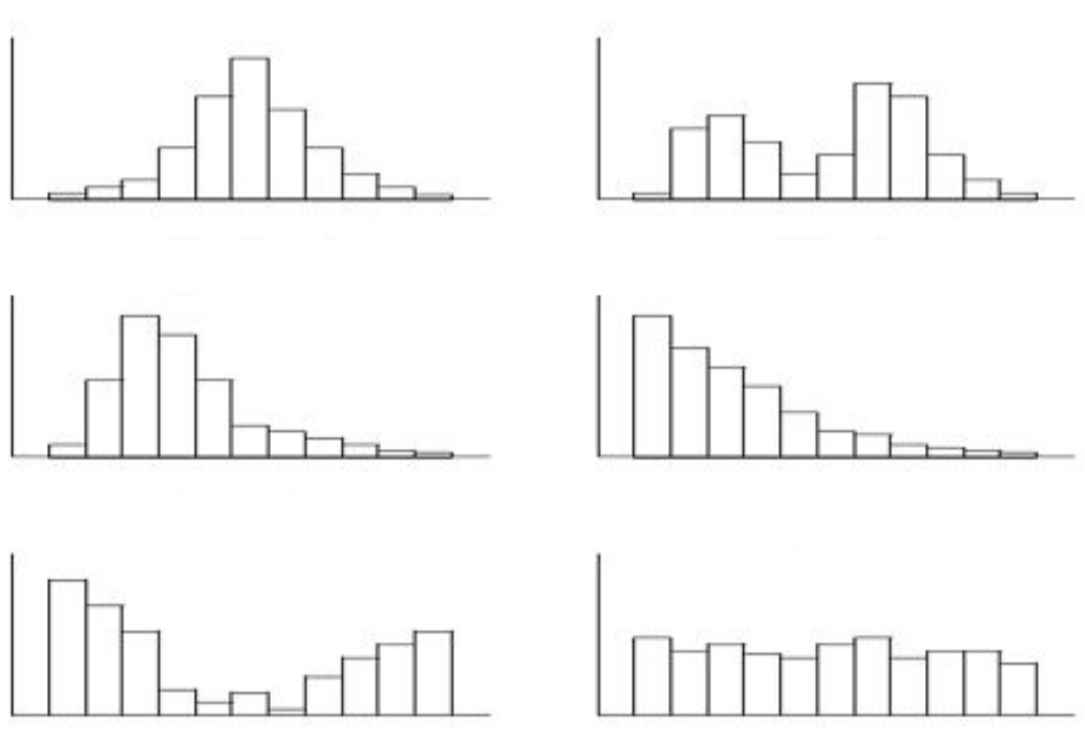
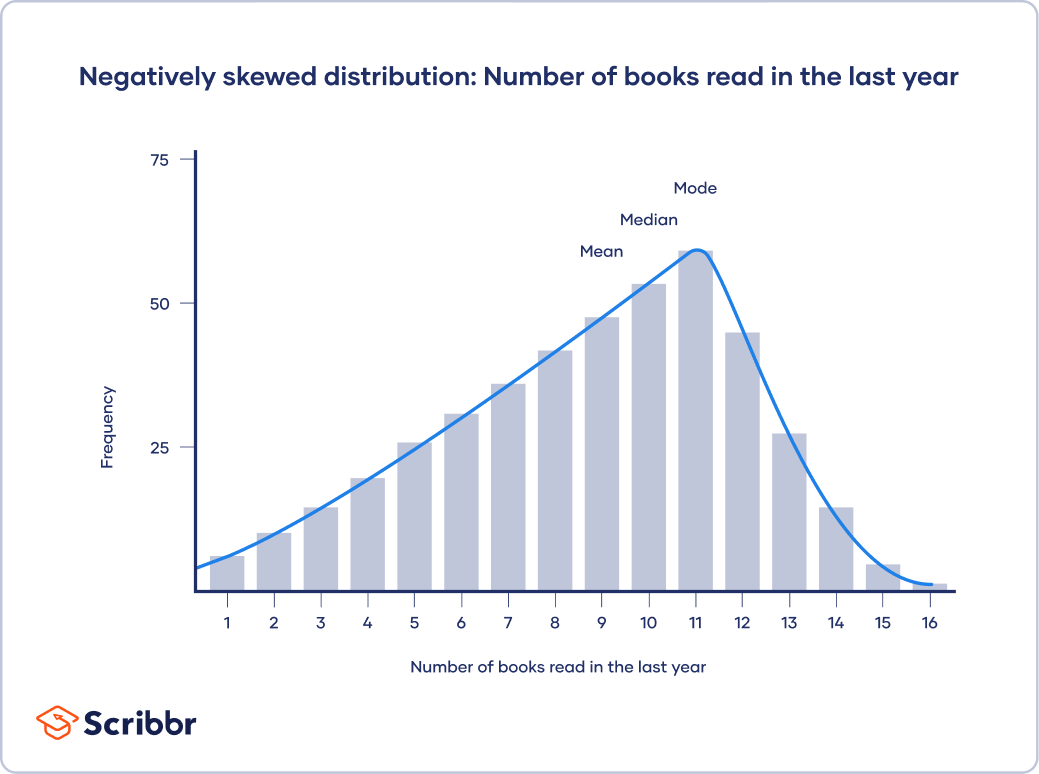
Central Tendency and the Shape of the Distribution (SKEWED)
Skewed Distributions
All examples of distributions shown in image example
Central Tendency and the Shape of the Distribution (SYMMETRICAL)
Symmetrical Distributions
All examples of distributions shown in image example
When to Use the Median (1)
Extreme scores or skewed distributions
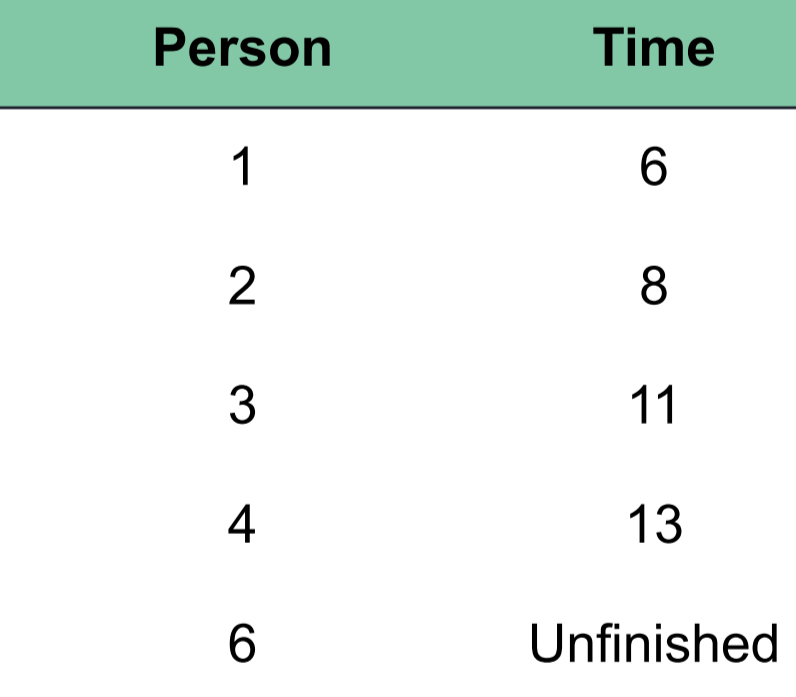
When to Use the Median (2)
Undetermined Values
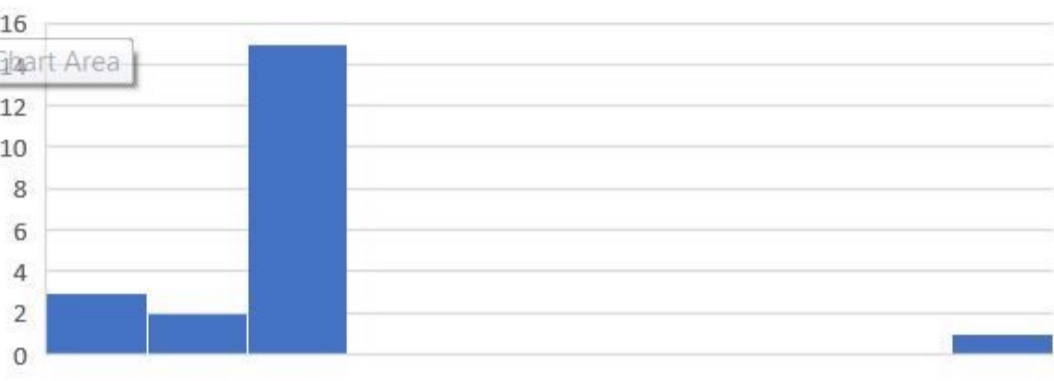
When to Use the Median (3)
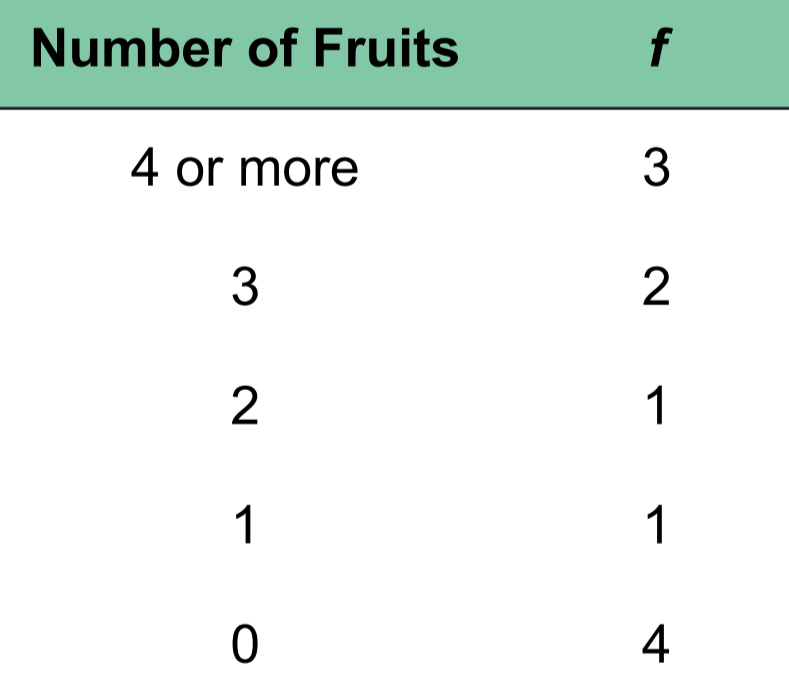
Open-ended Distributions
NO upper(shown in example) or lower limit for one of the categories
When to Use the Median (4)
Ordinal Scales
Determined direction but not distance
When to Use the Mode
Nominal scales
Impossible to compute a mean or median
Mode is the only option
Discrete variables
Mode always identifies the most typical case
Describing shape
Gives an indication of the shape of the distribution