micro economics diagrams
1/45
There's no tags or description
Looks like no tags are added yet.
Name | Mastery | Learn | Test | Matching | Spaced | Call with Kai |
|---|
No analytics yet
Send a link to your students to track their progress
46 Terms
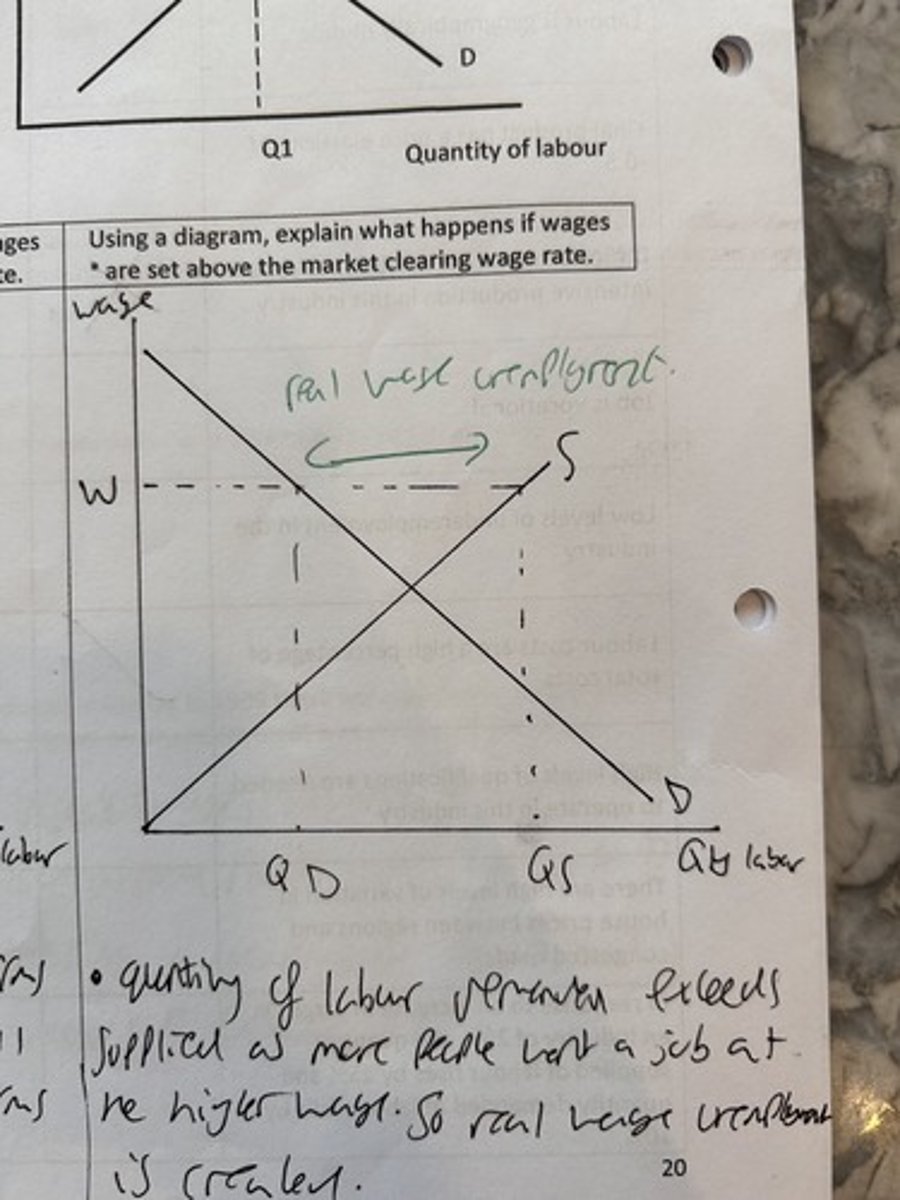
real wage unemployment
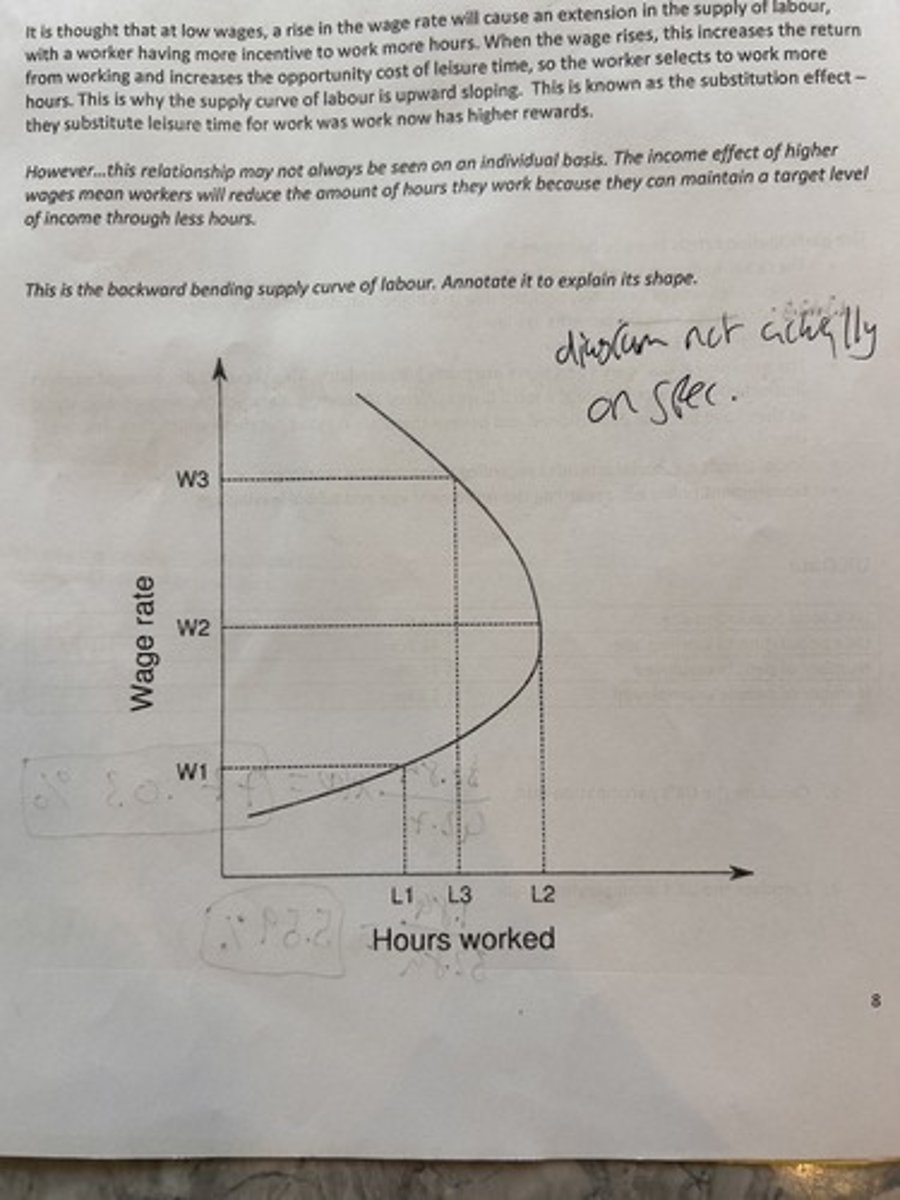
backward bending supply curve of labour
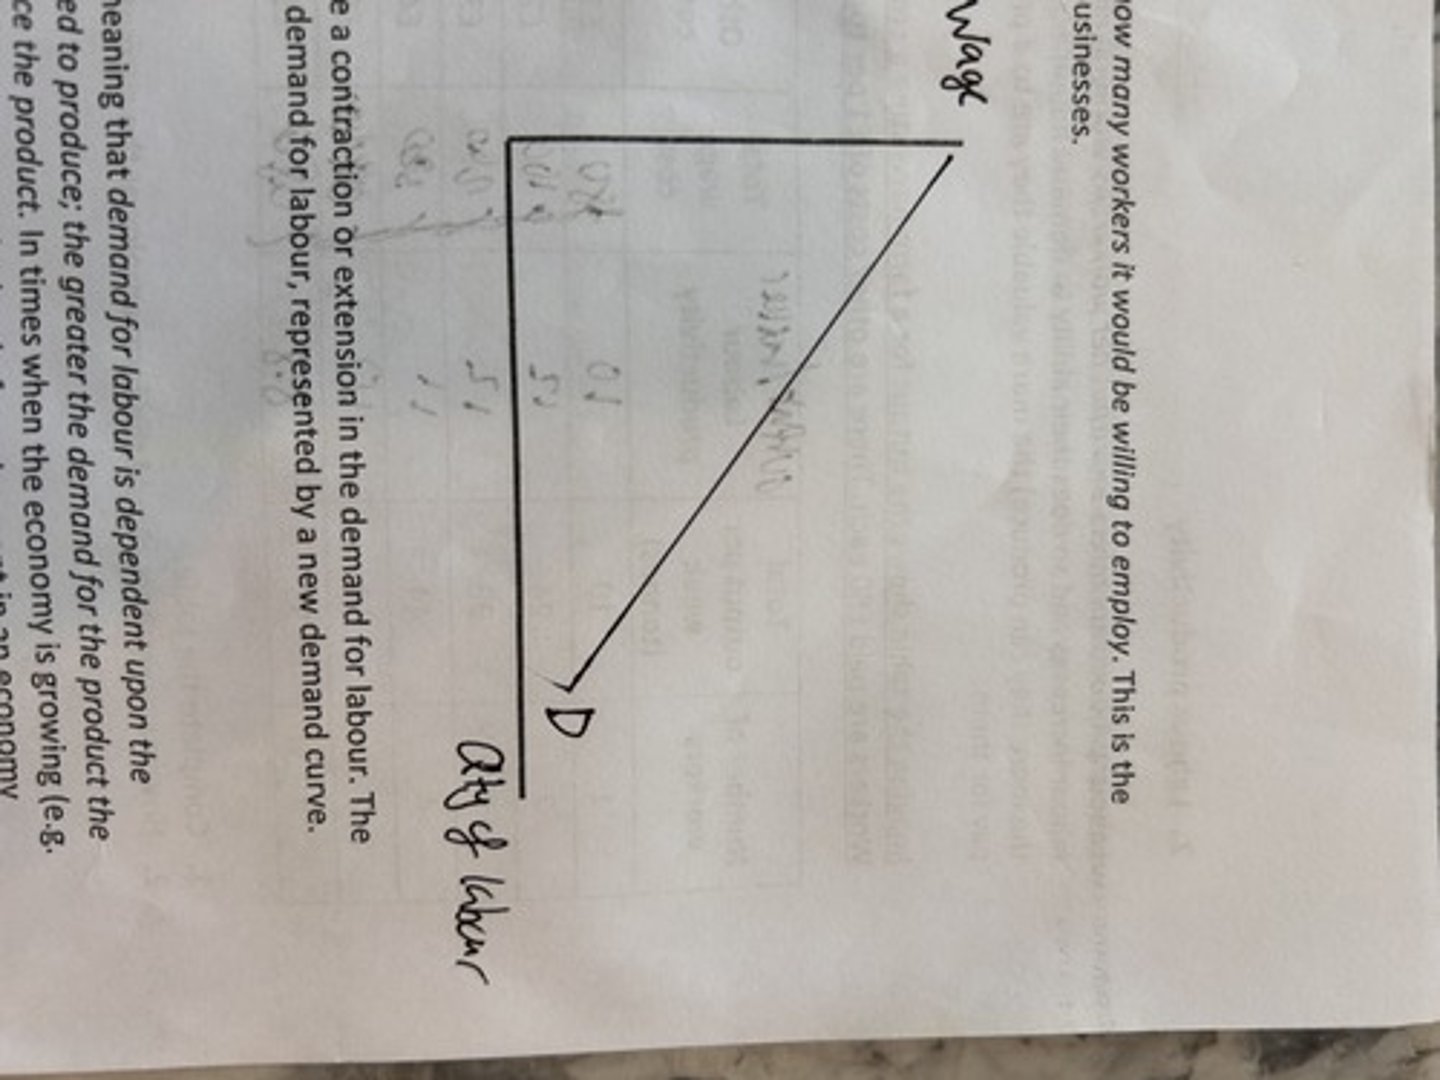
demand for labour
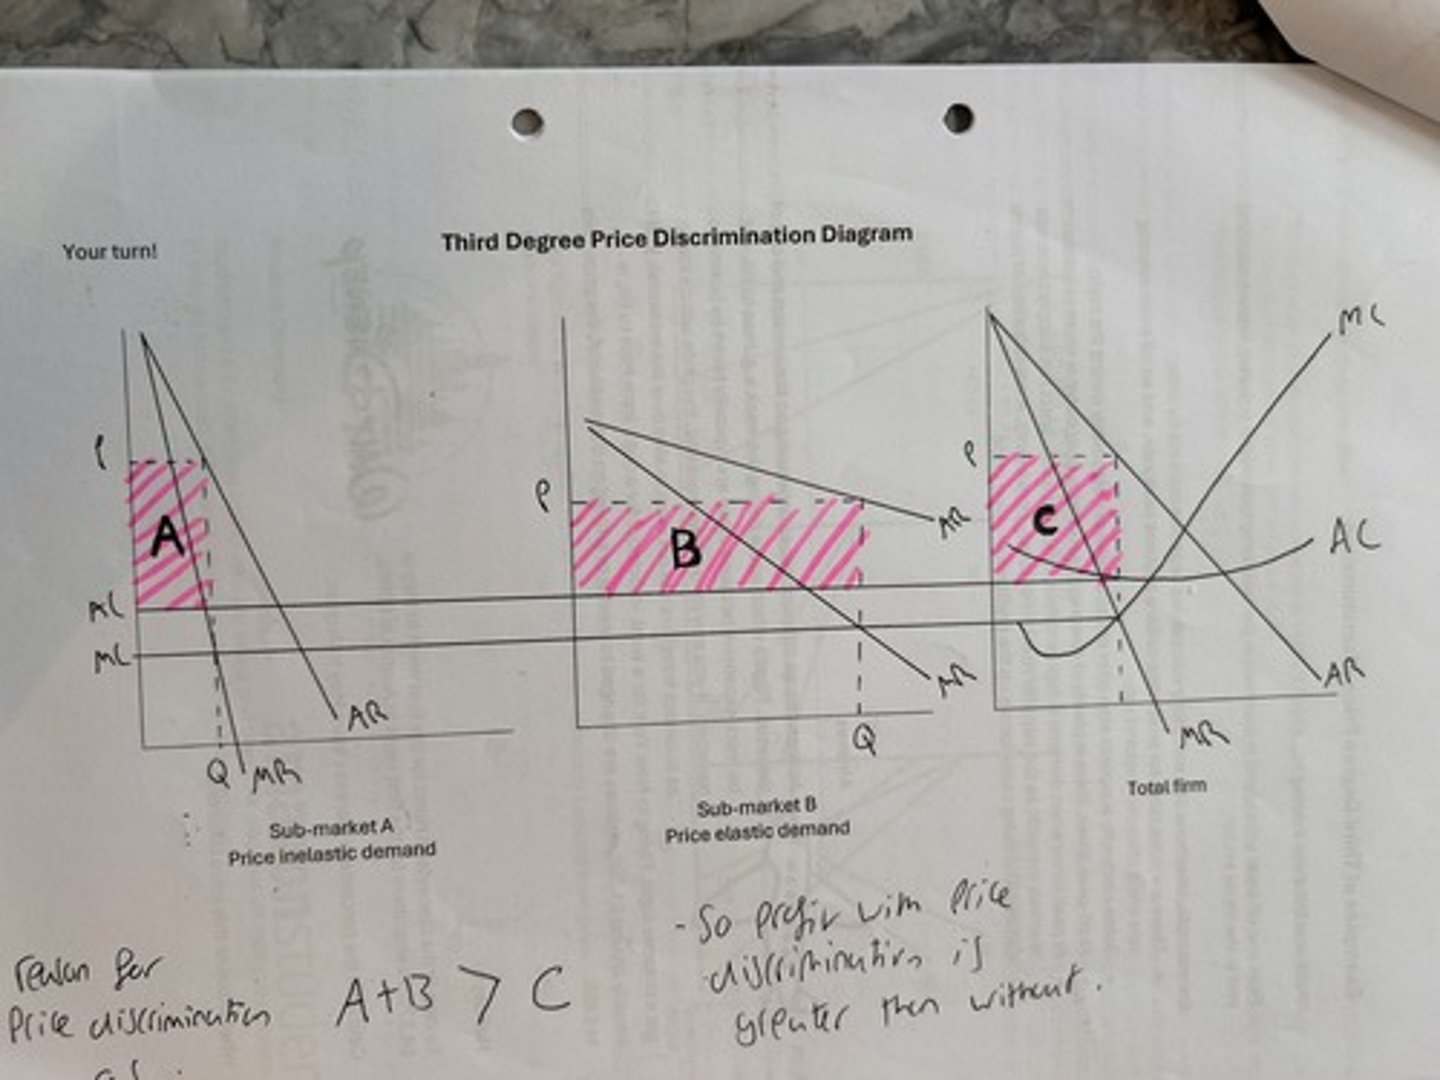
third degree price discrimination
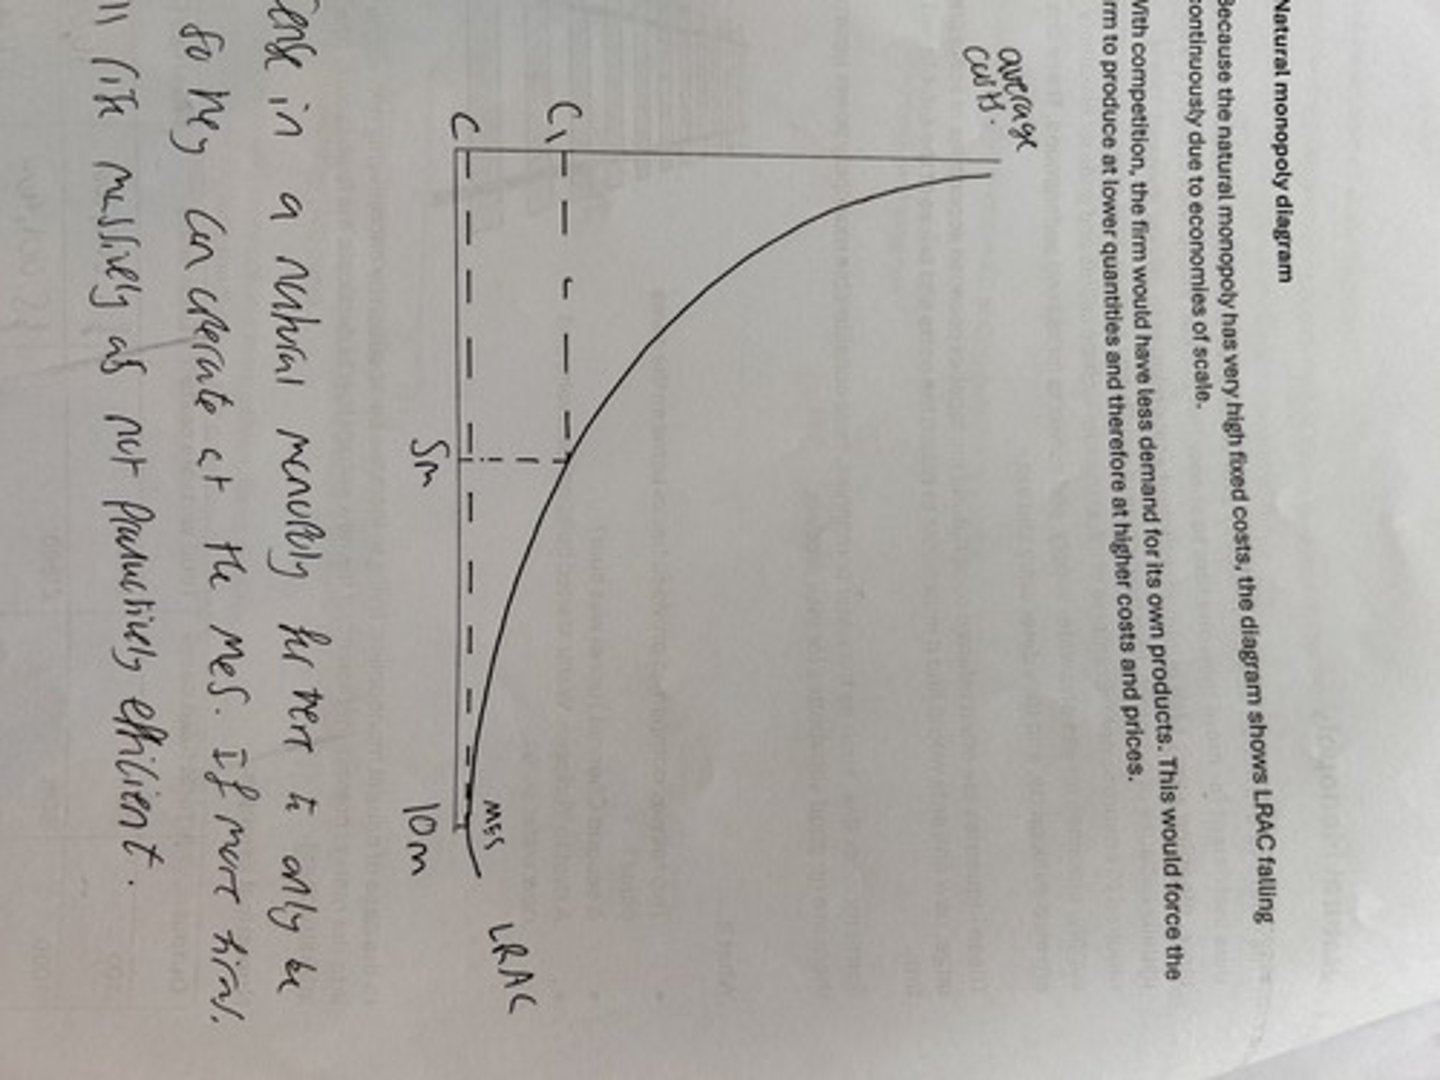
natural monopoly
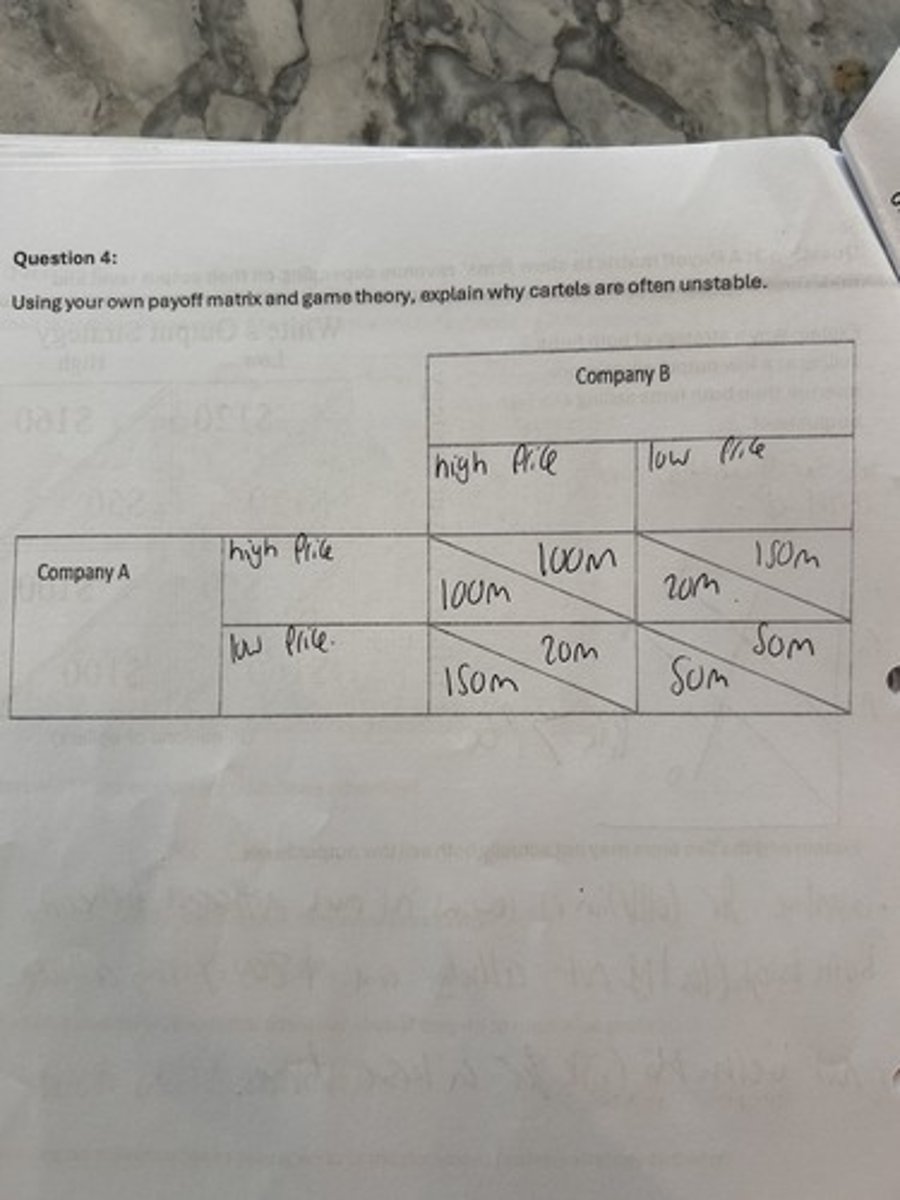
payoff matrix
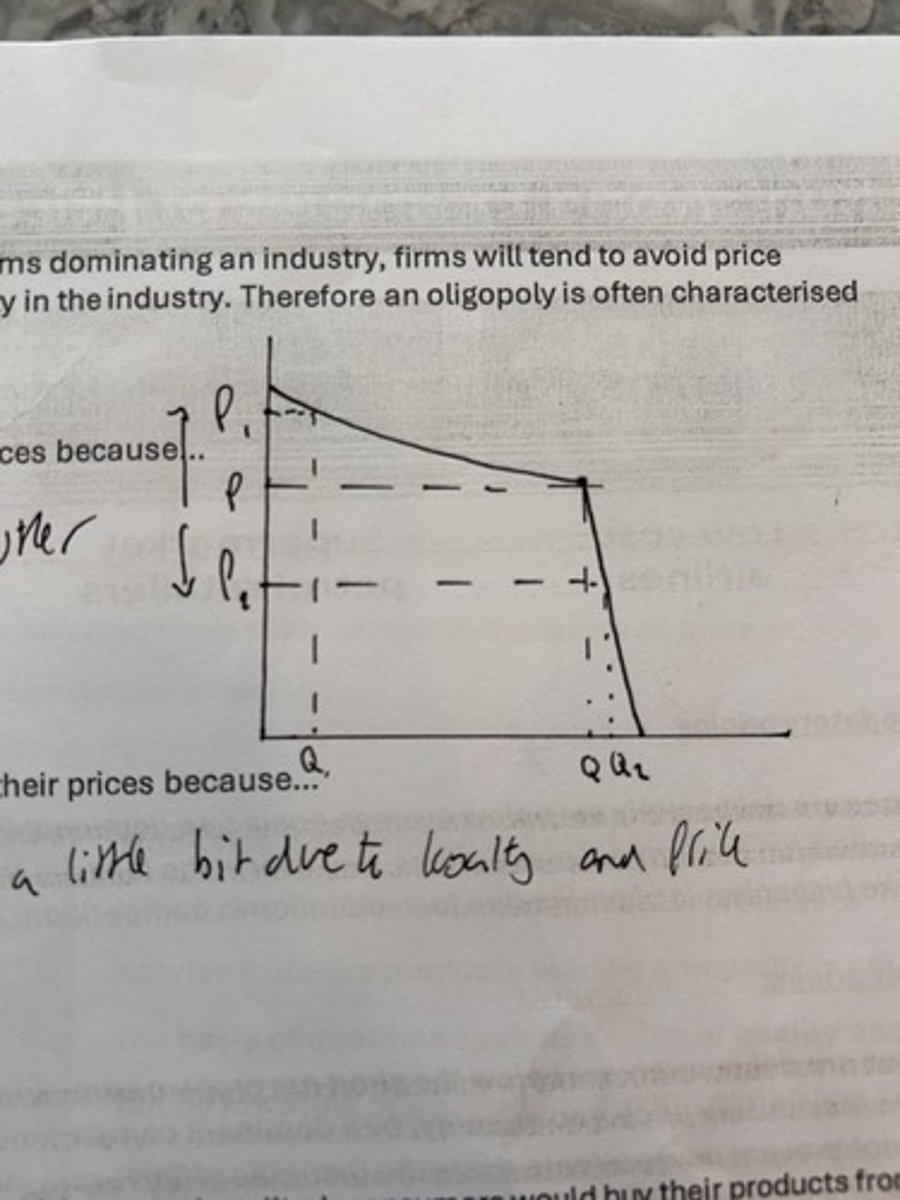
kinked demand curve
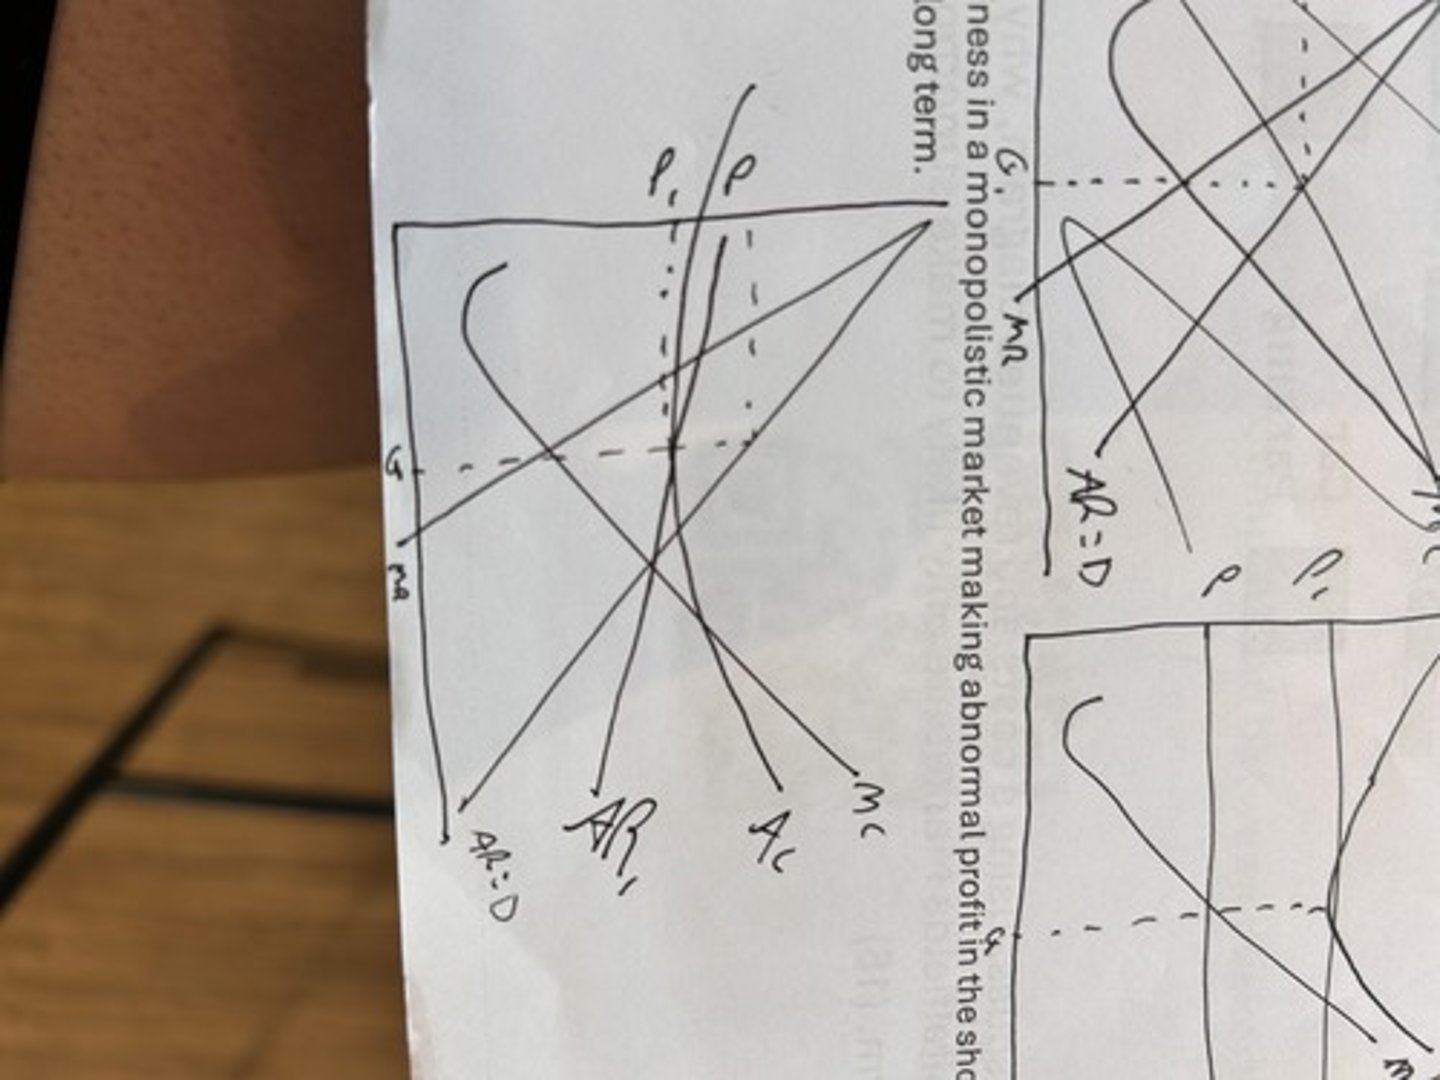
long run equilibrium for monopolistic competition
making normal profit in the long run as the demand curve becomes more elastic as more firms enter the market there is more substitutes
perfect competition long run equilibrium
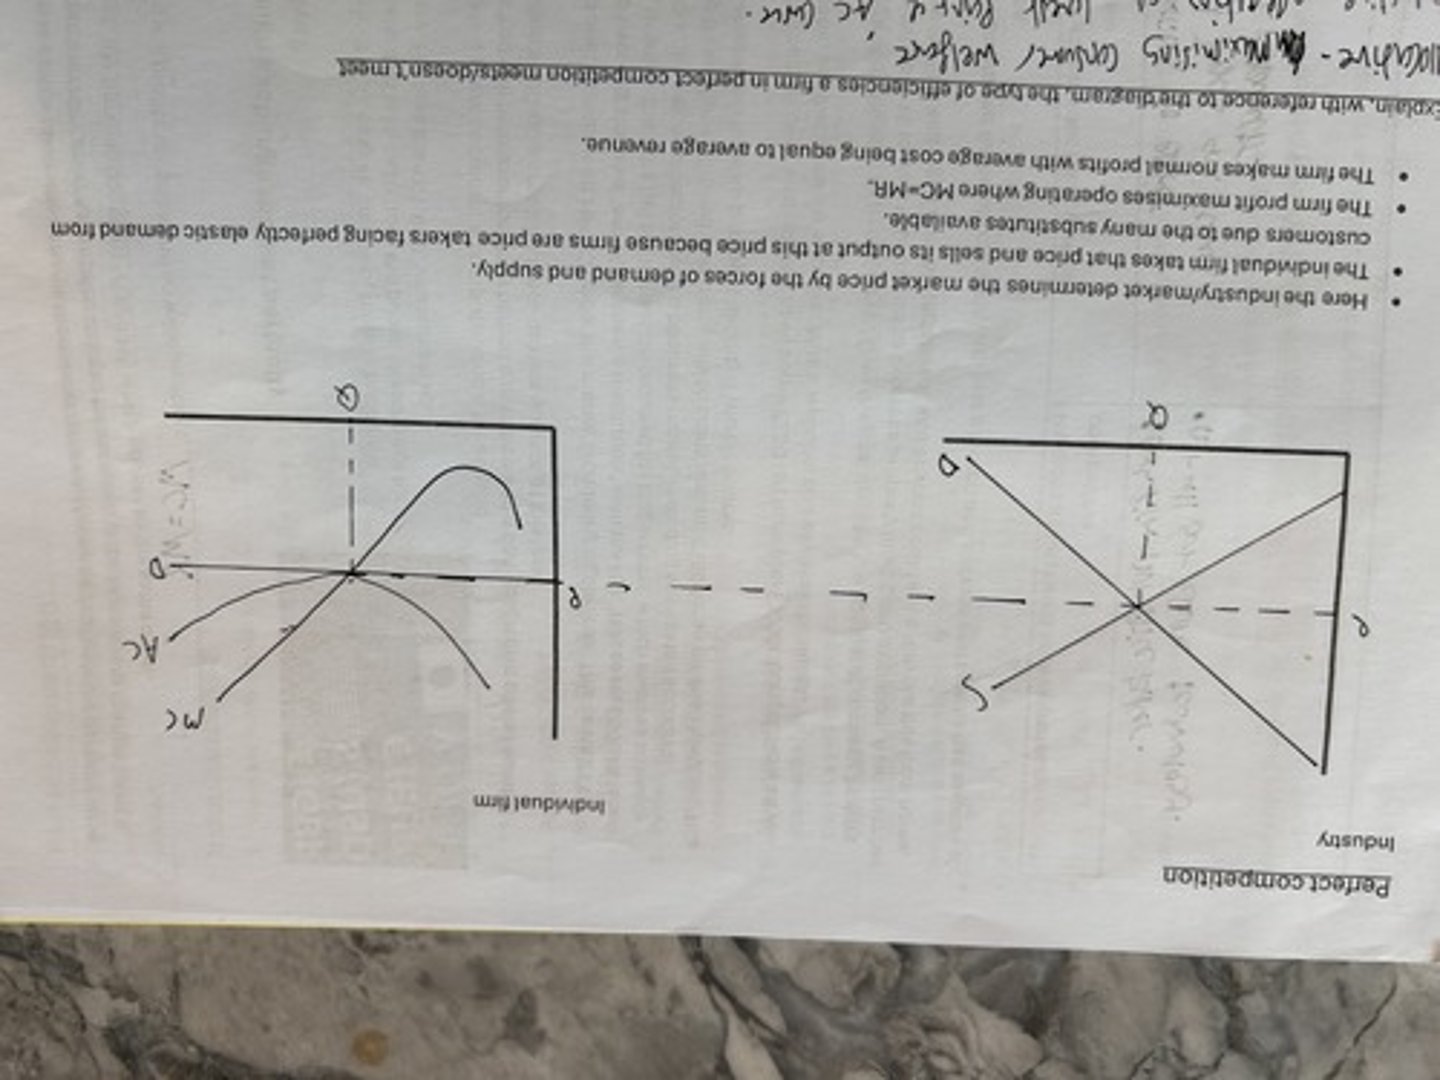
perfect competition short run equilibrium
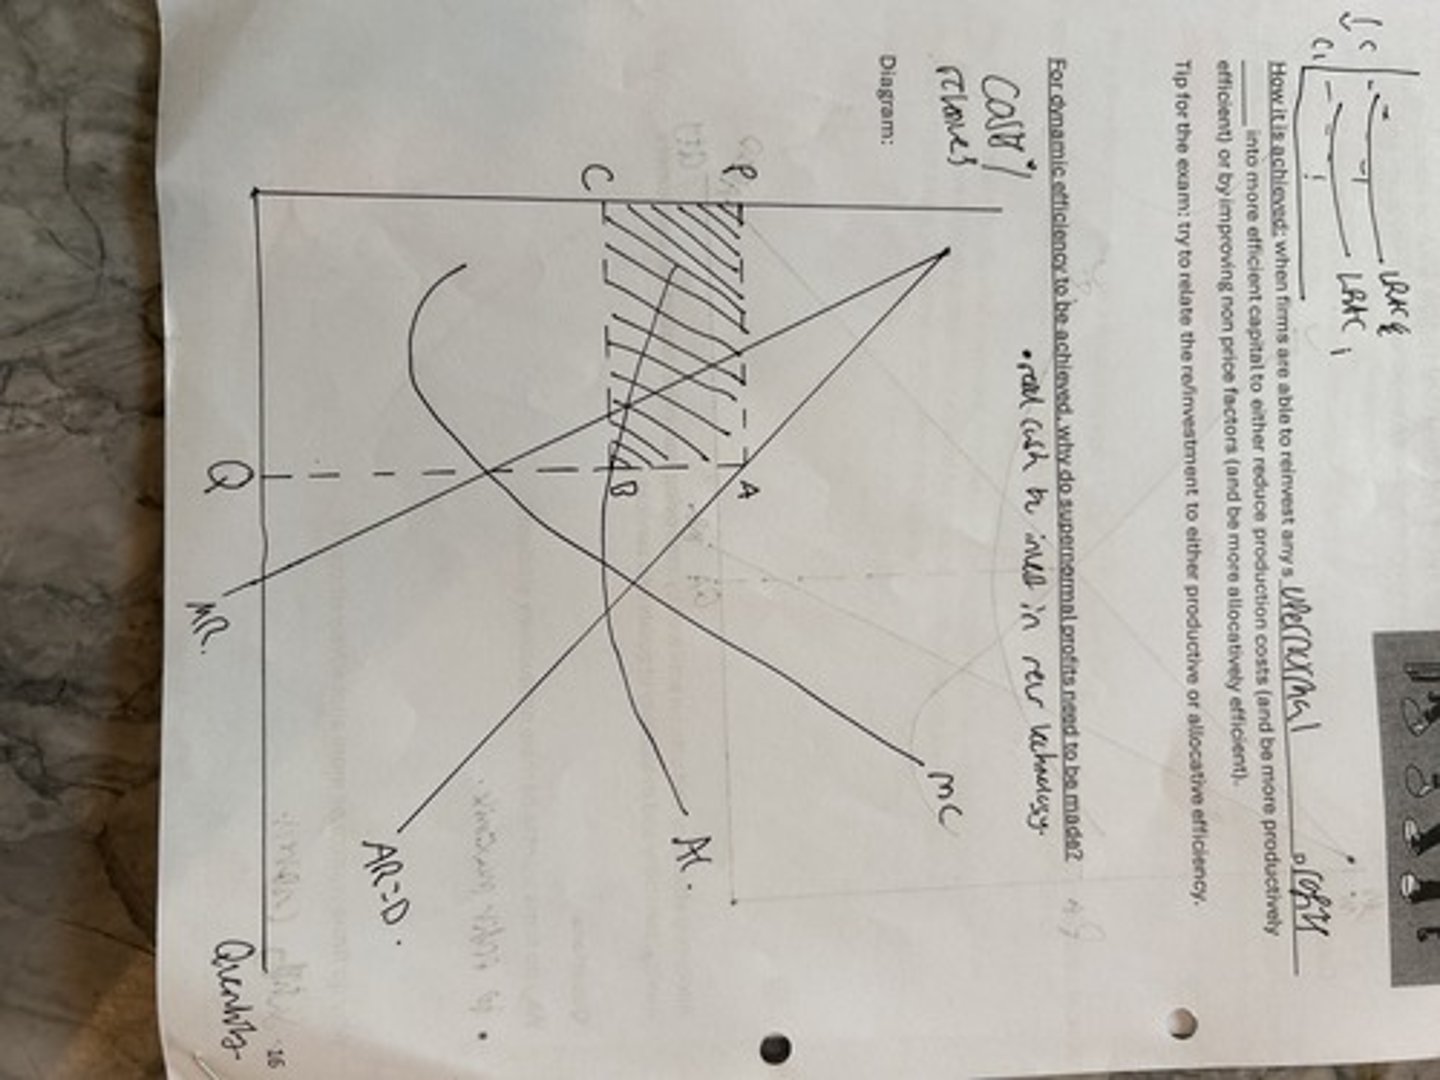
dynamic efficiency
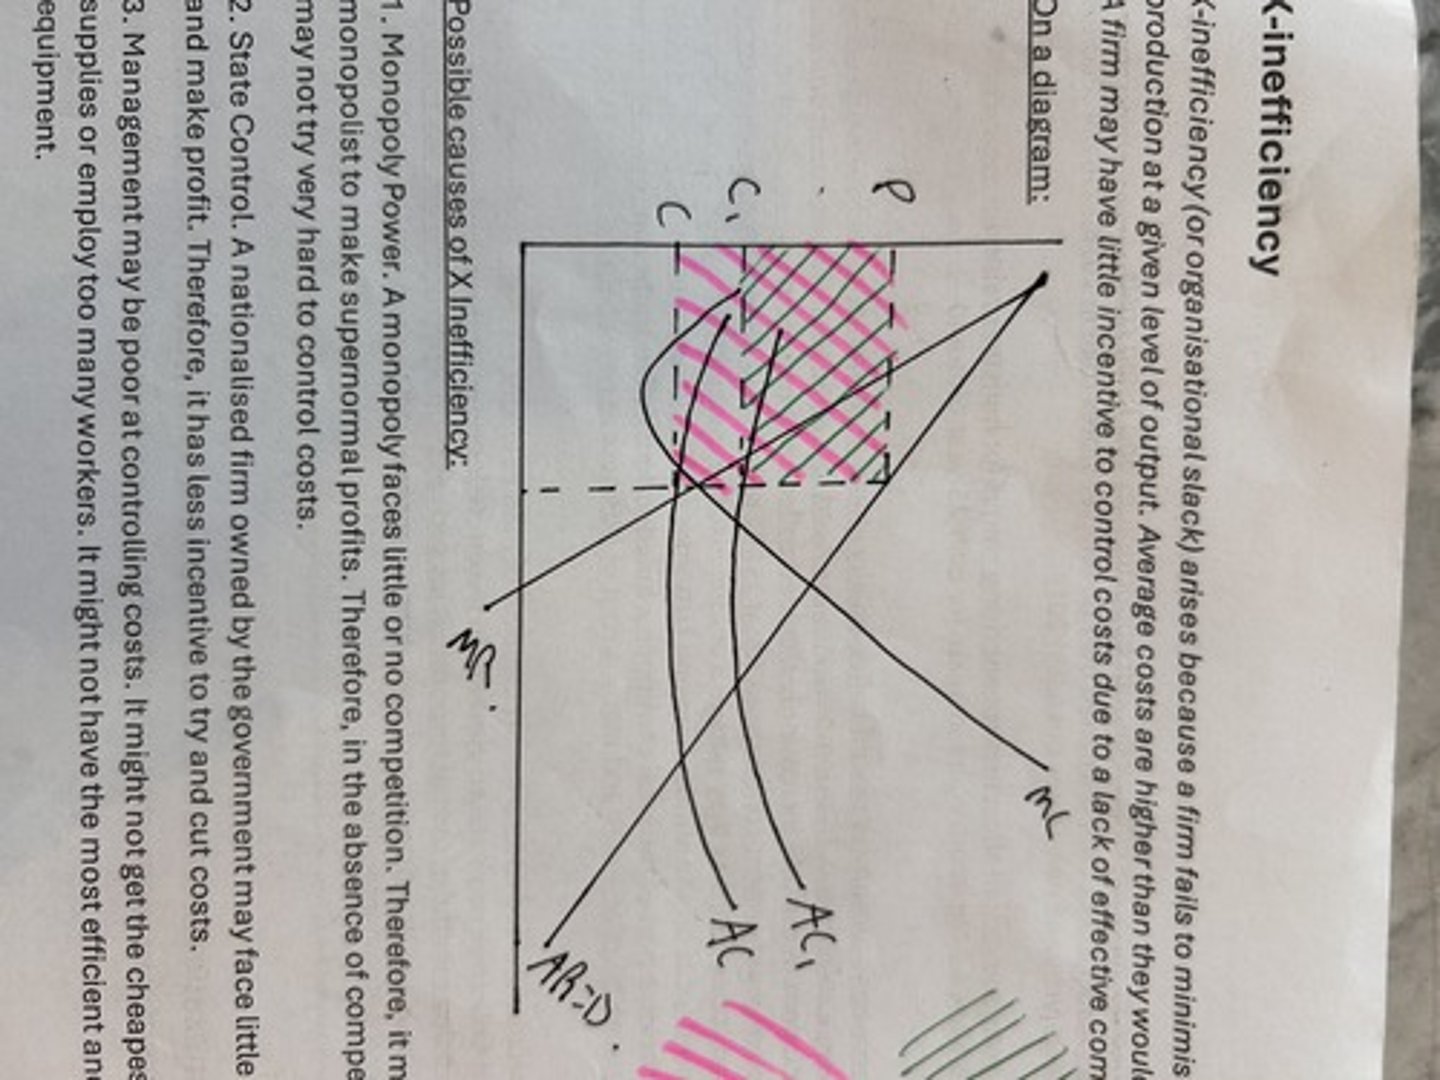
x inefficiency
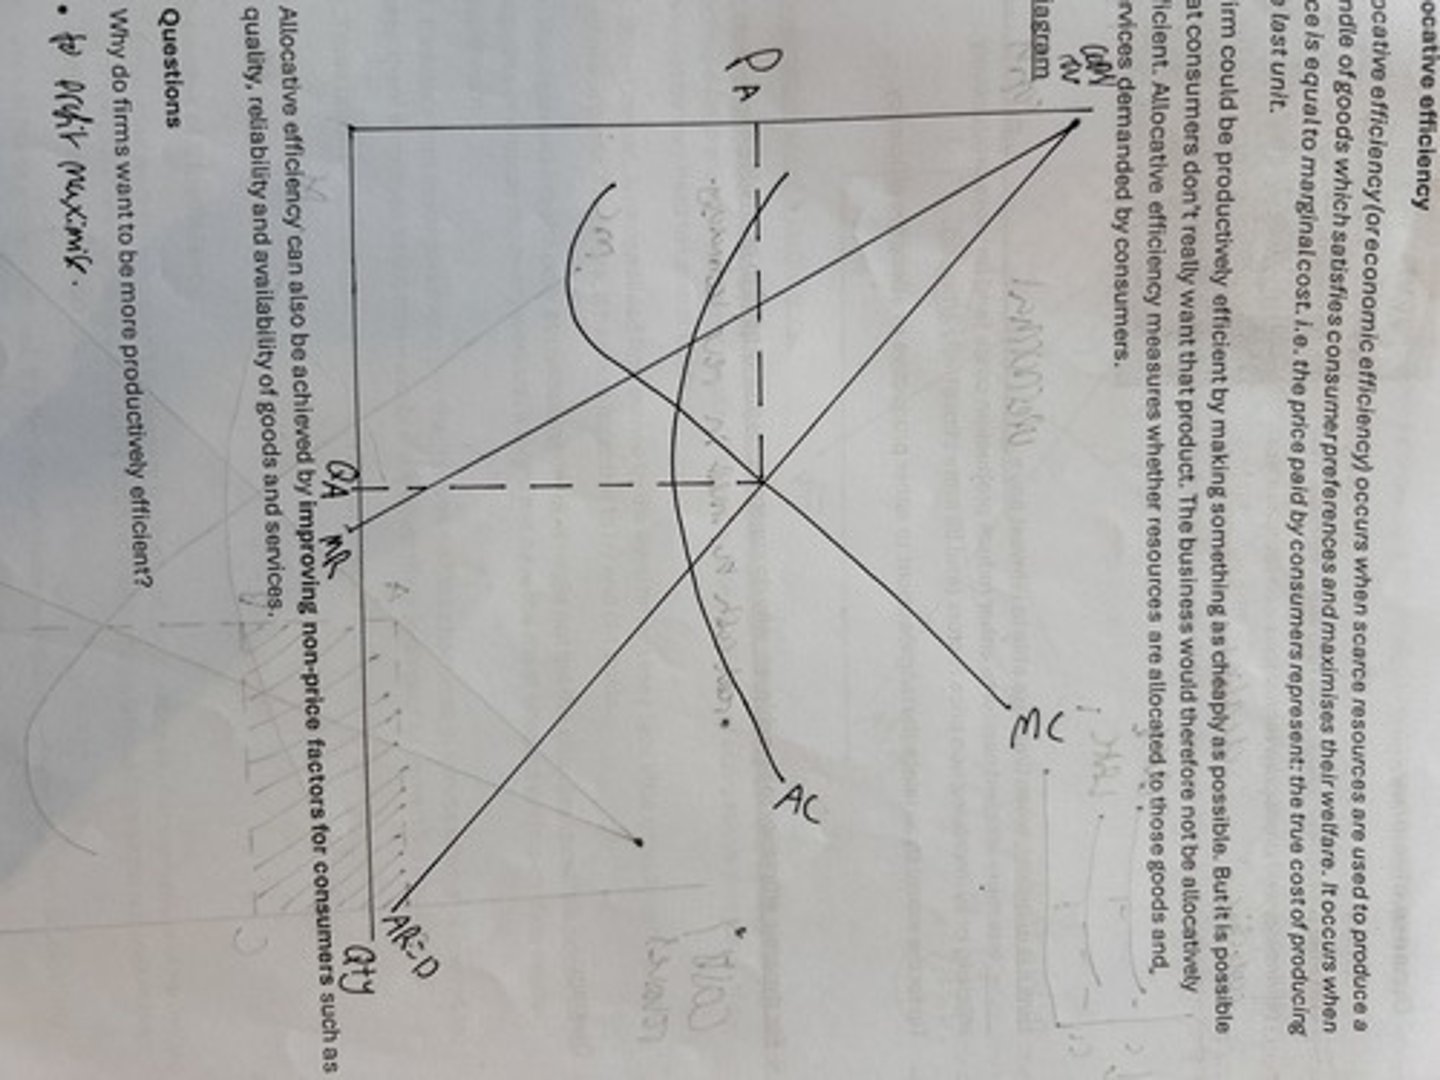
allocative efficiency
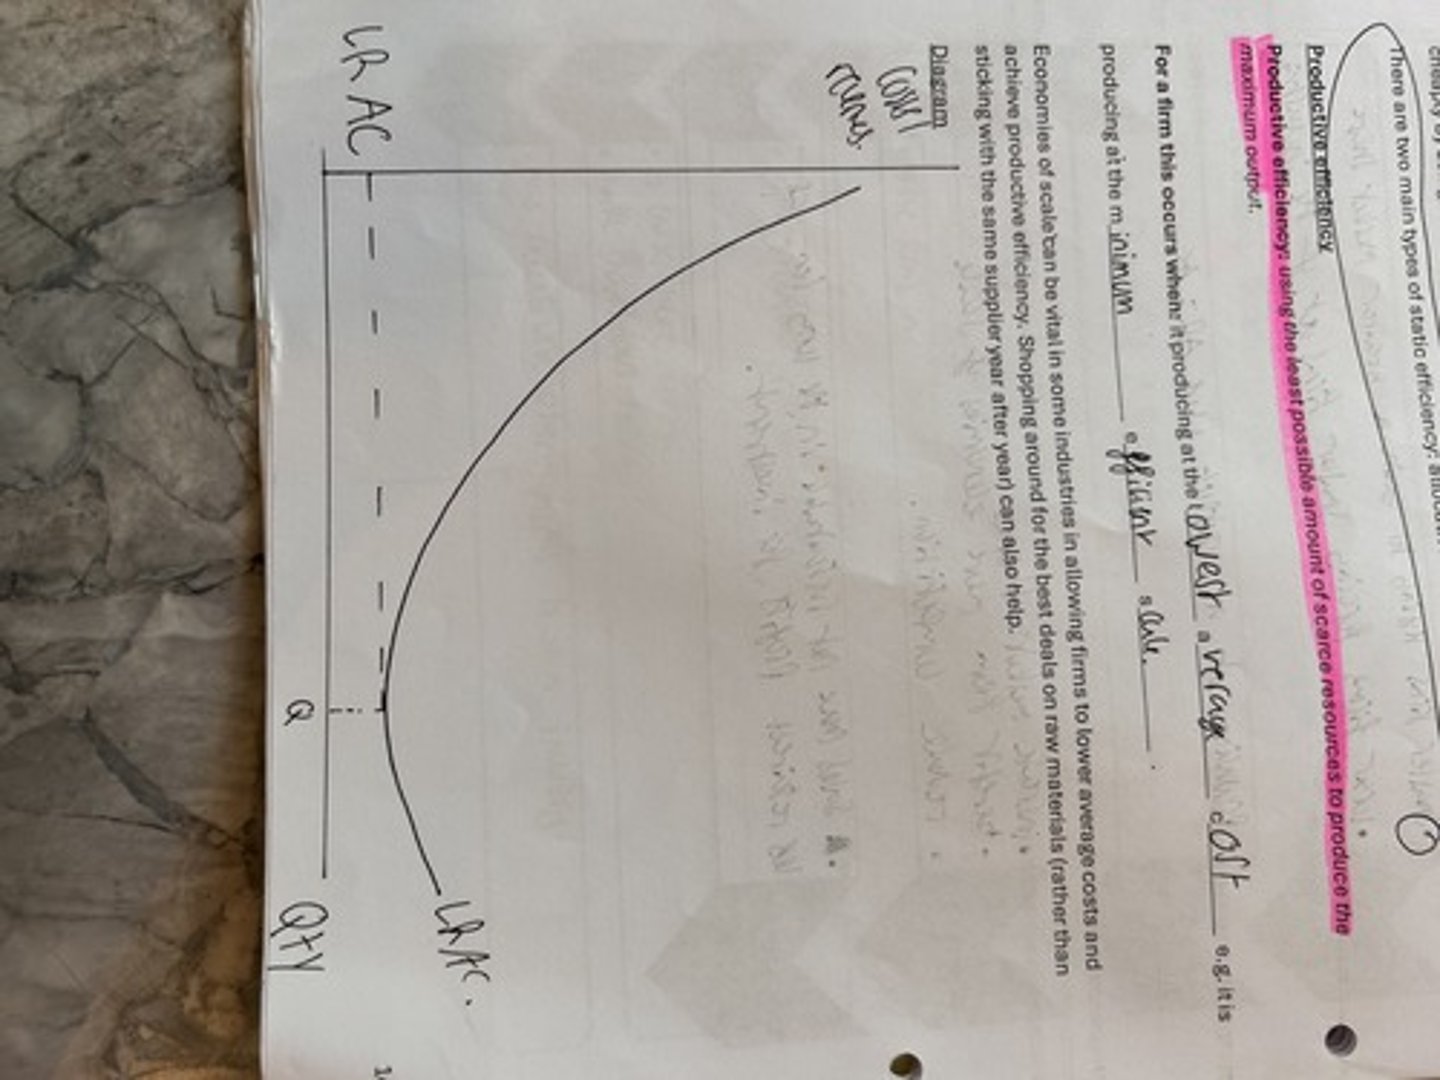
productive efficiency or the minimum efficient scale.
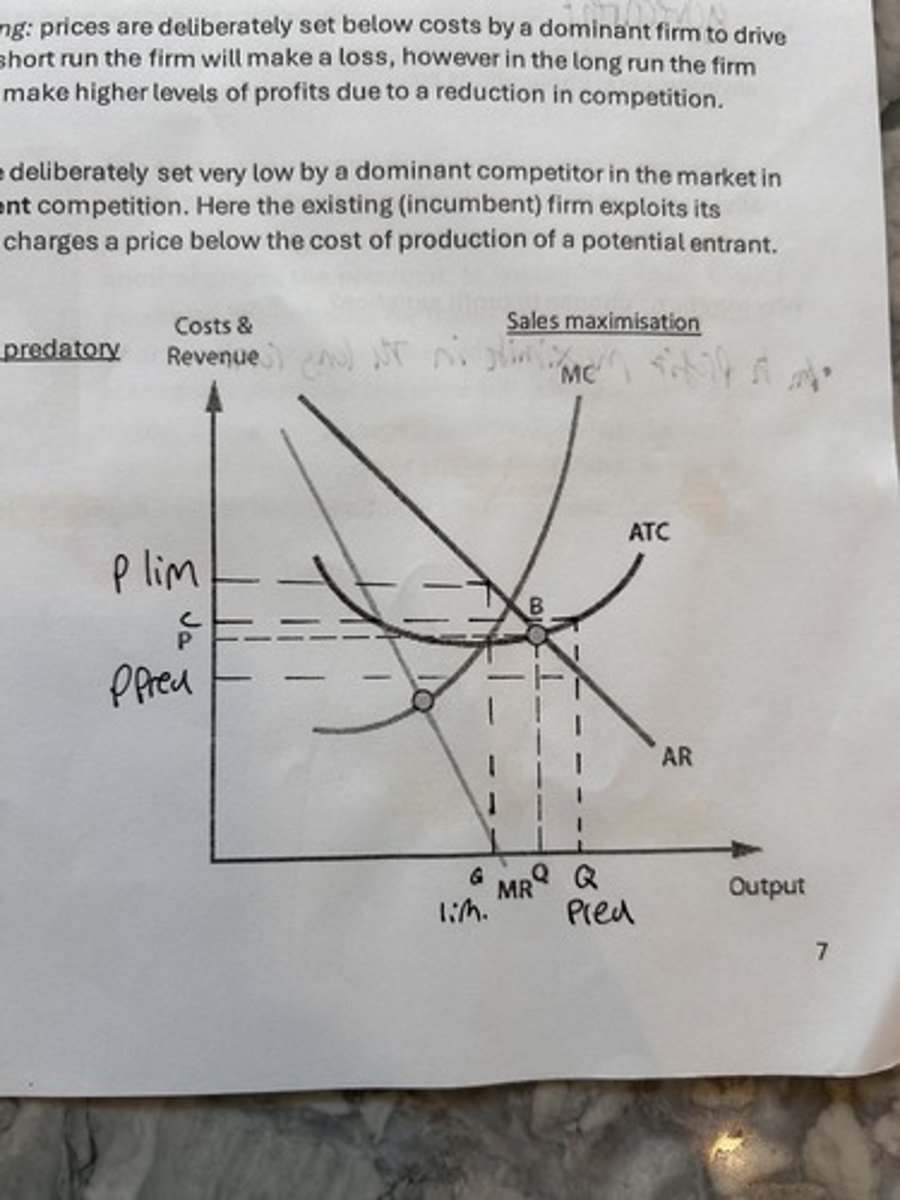
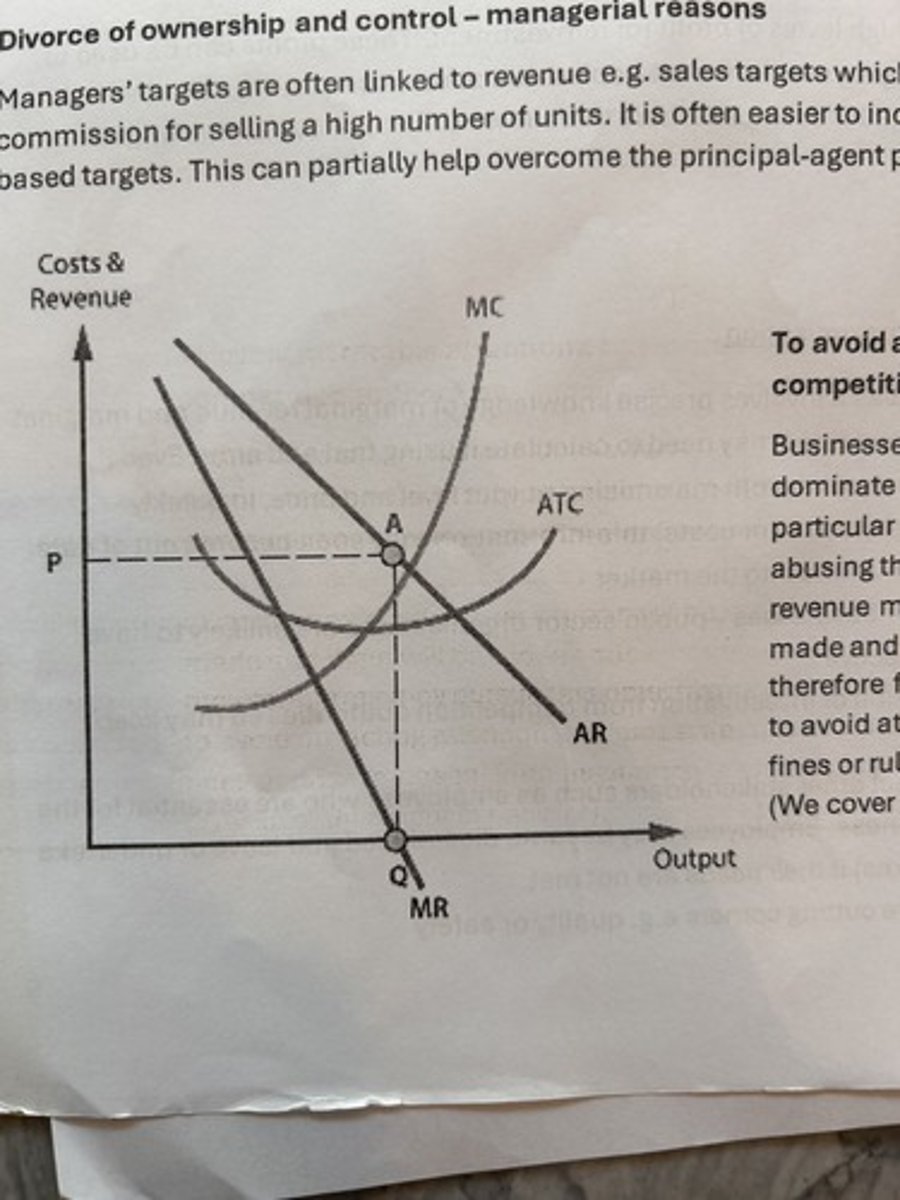
sales max. both limit and predatory pricing.
Revenue maximisation
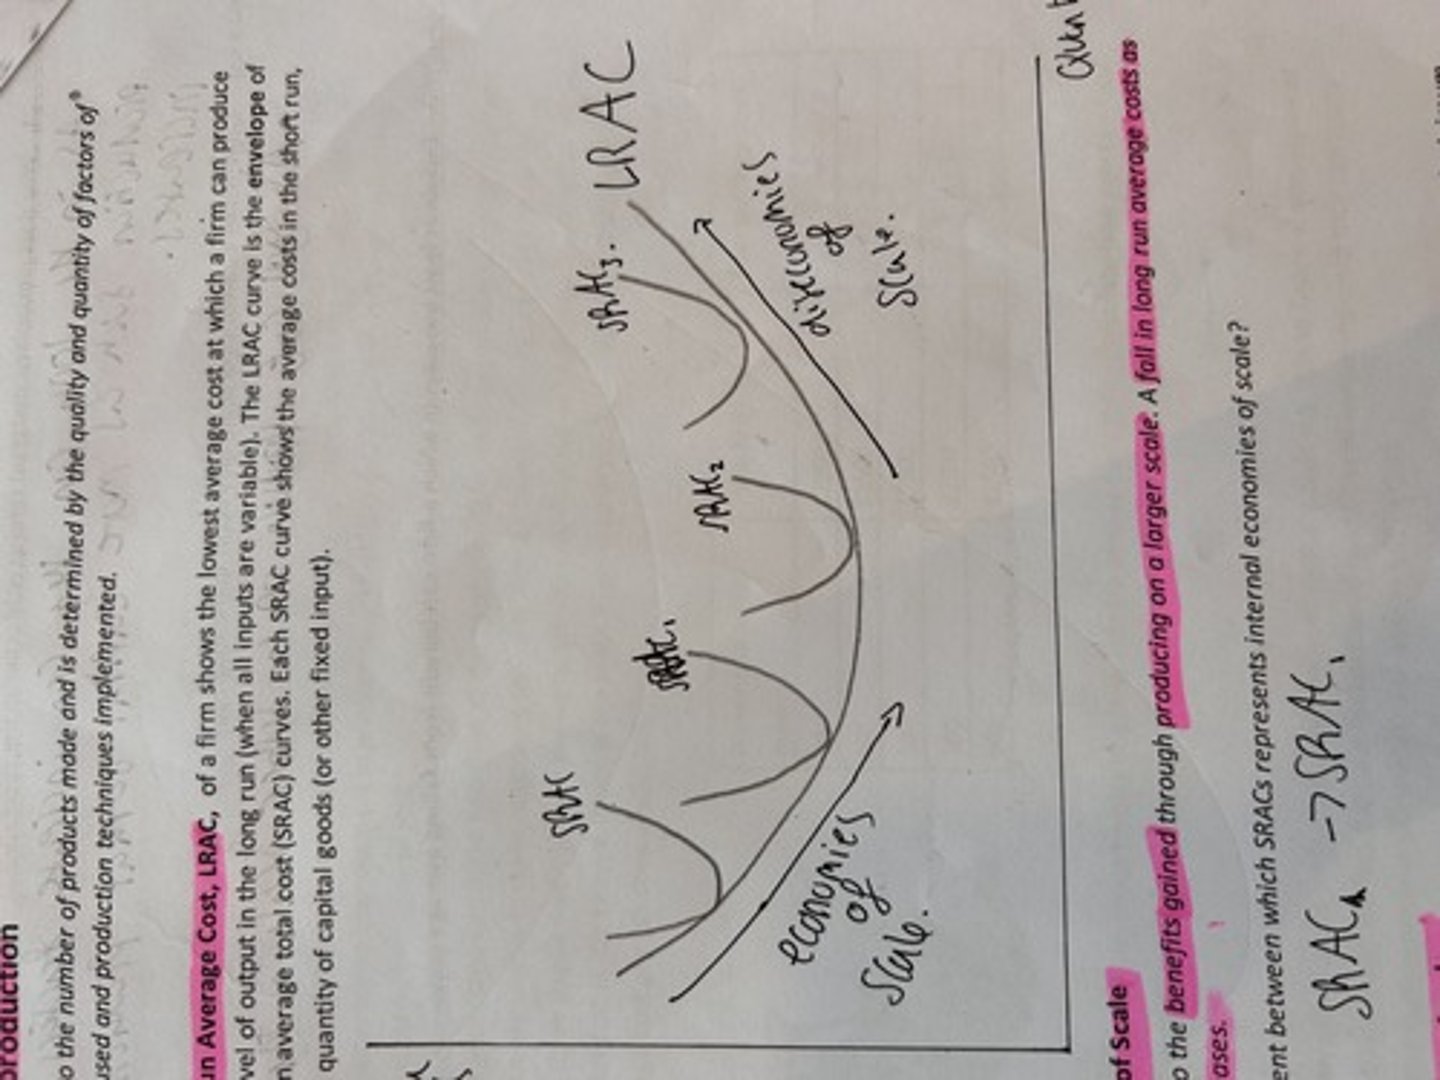
long run average cost curve
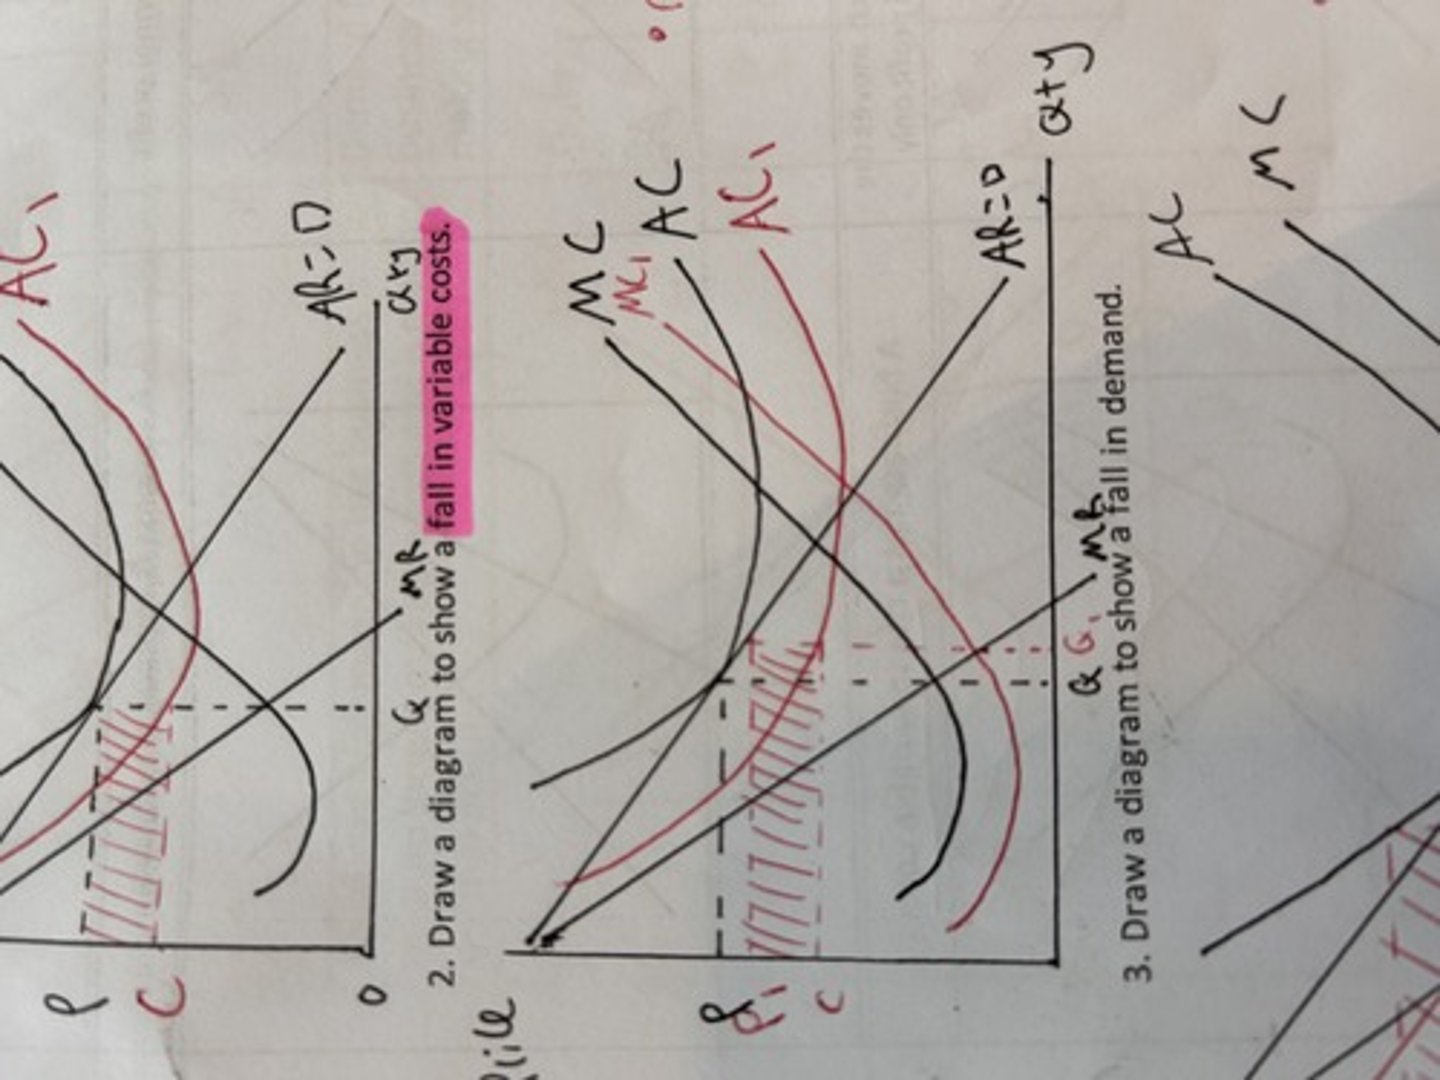
cost and revenues reduction in demand
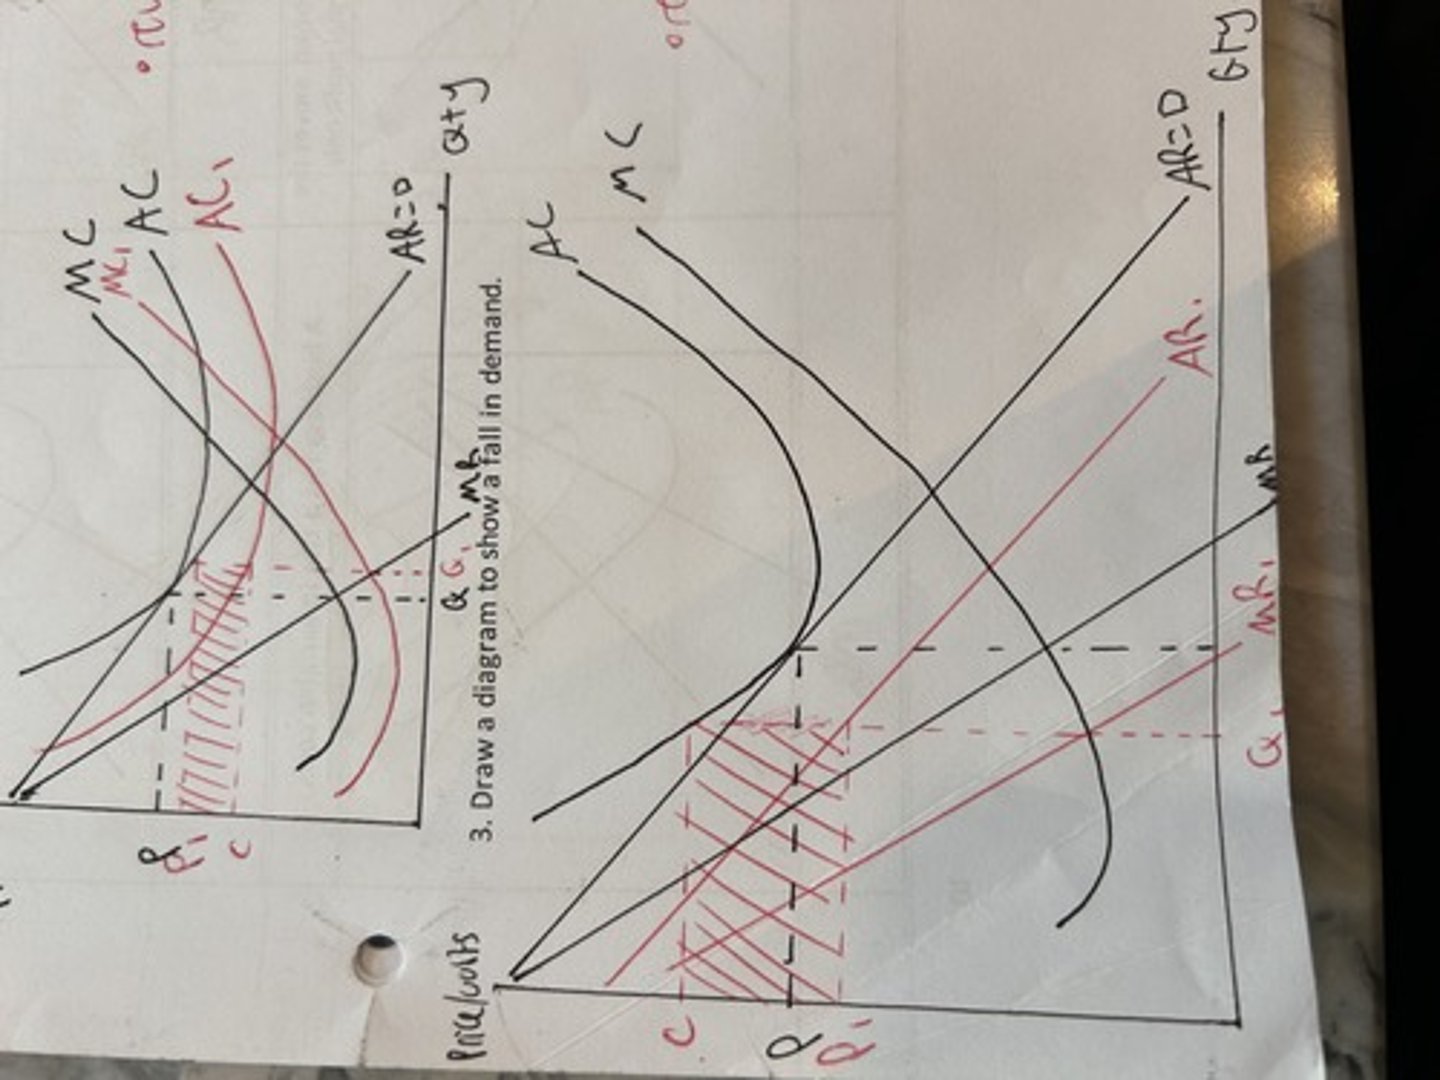
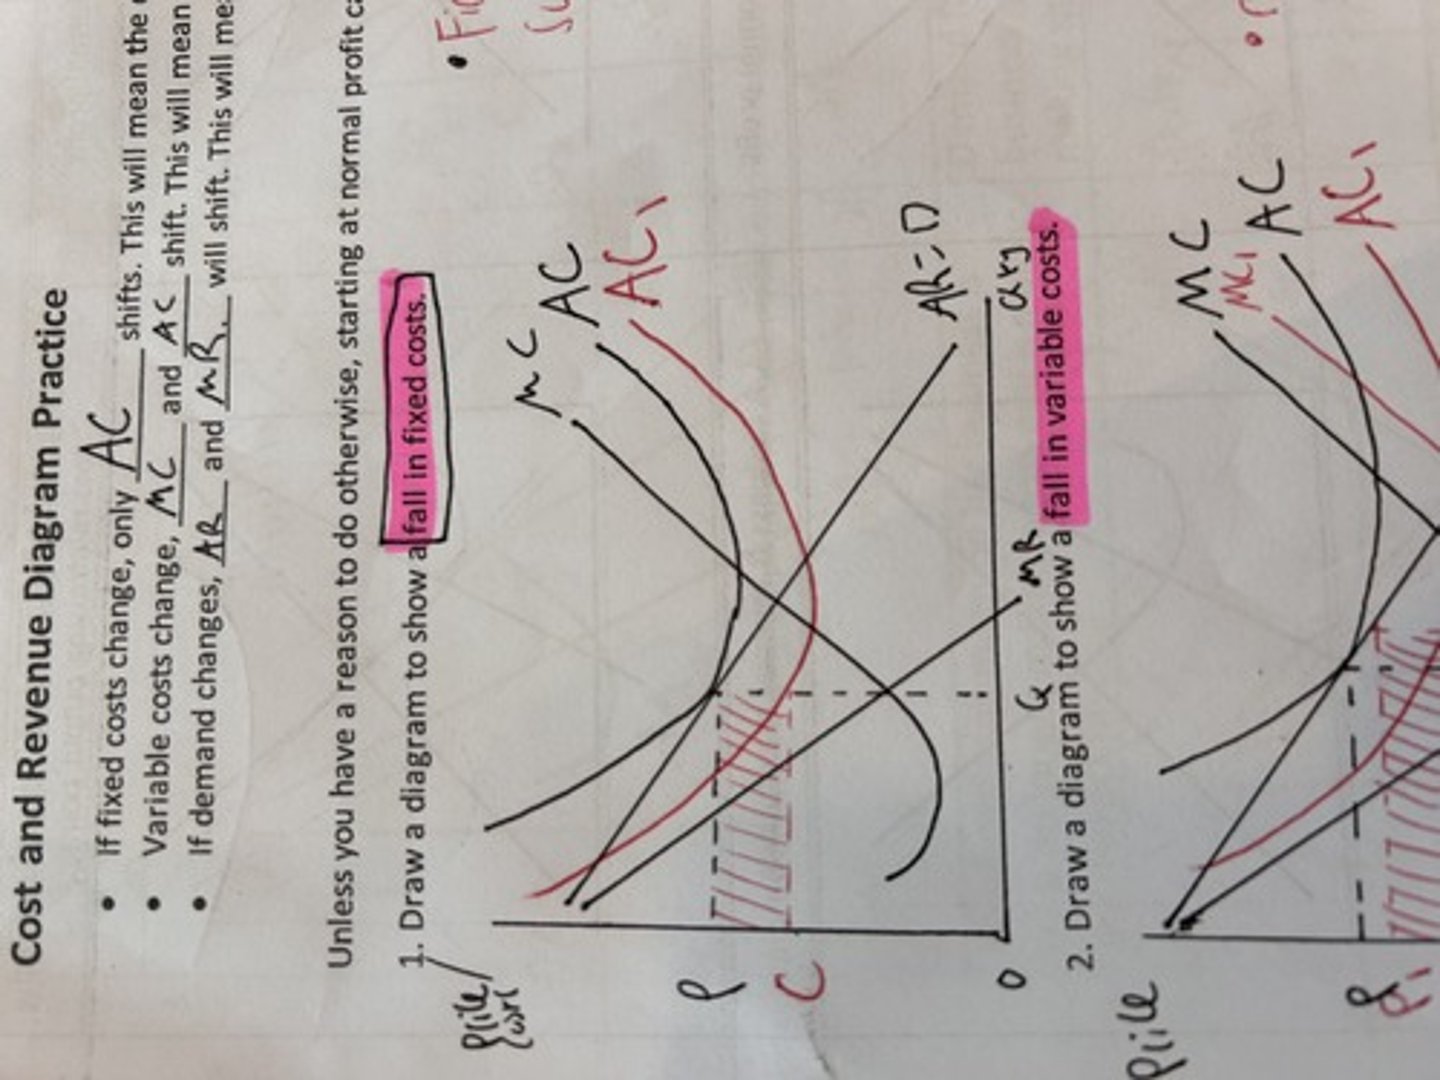
cost and revenues fall in variable costs
cost and revenues all in fixed costs.
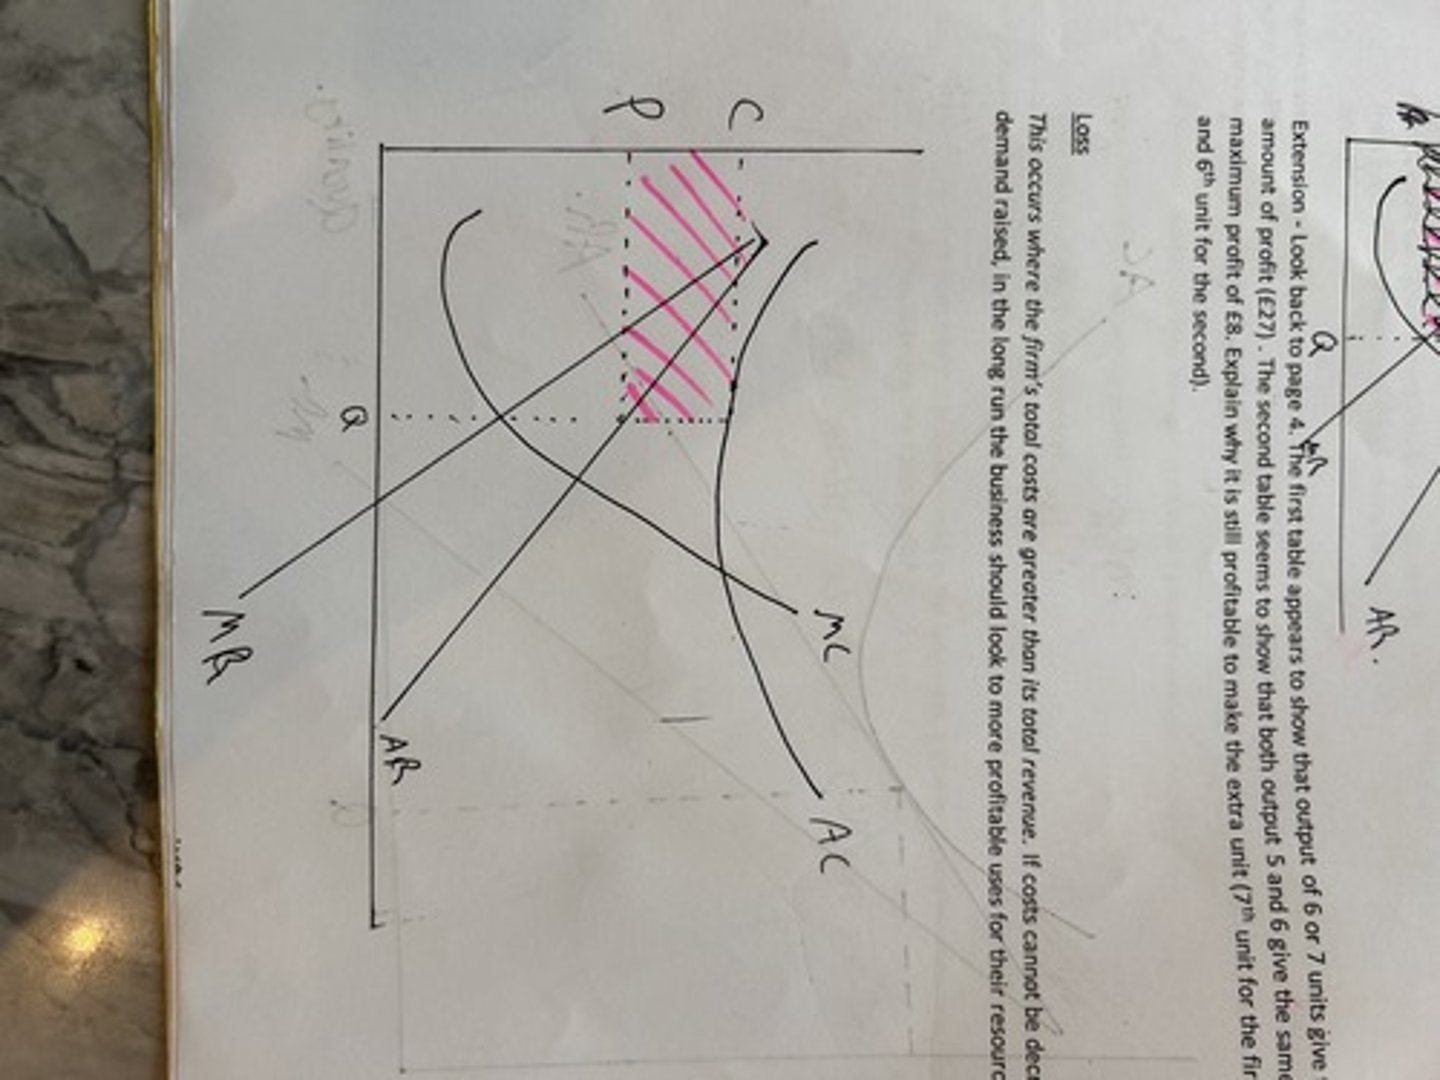
cost and revenues loss
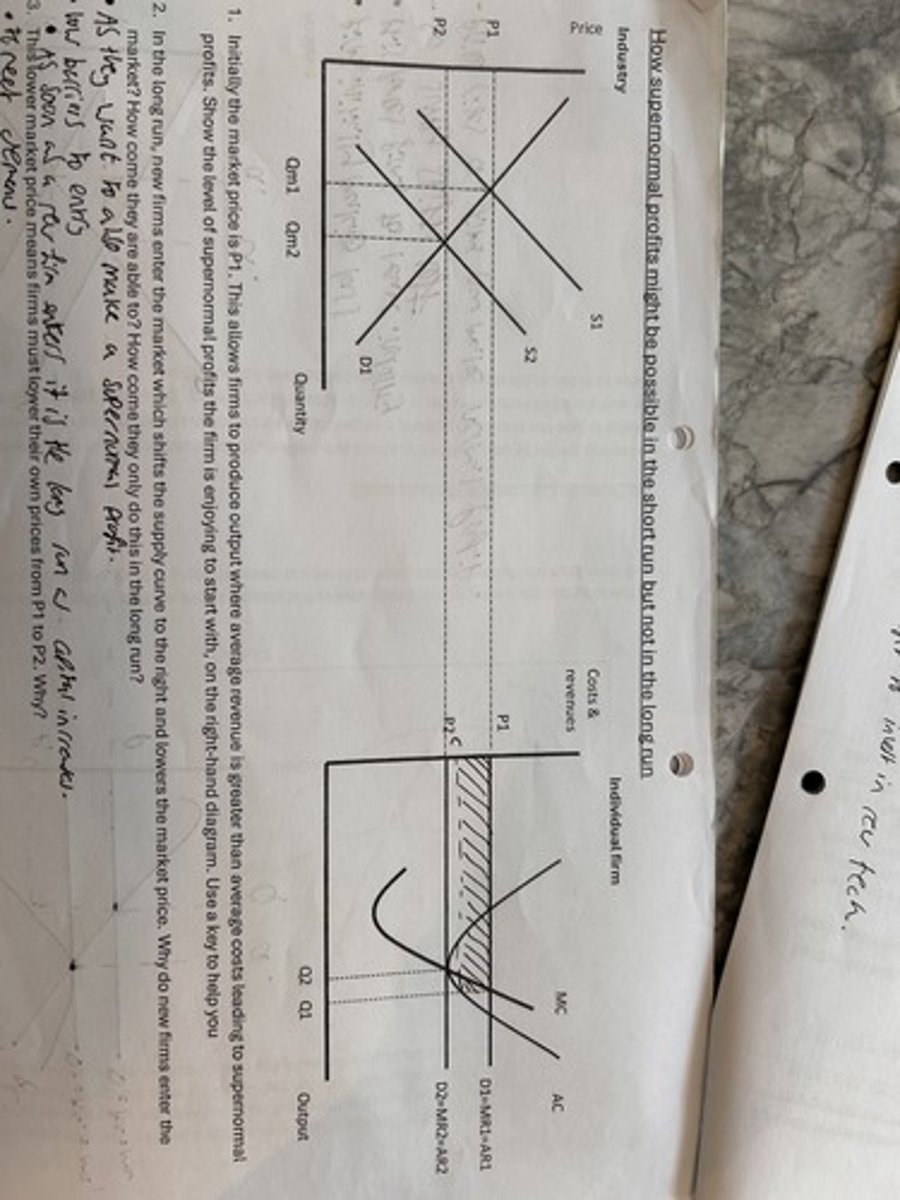
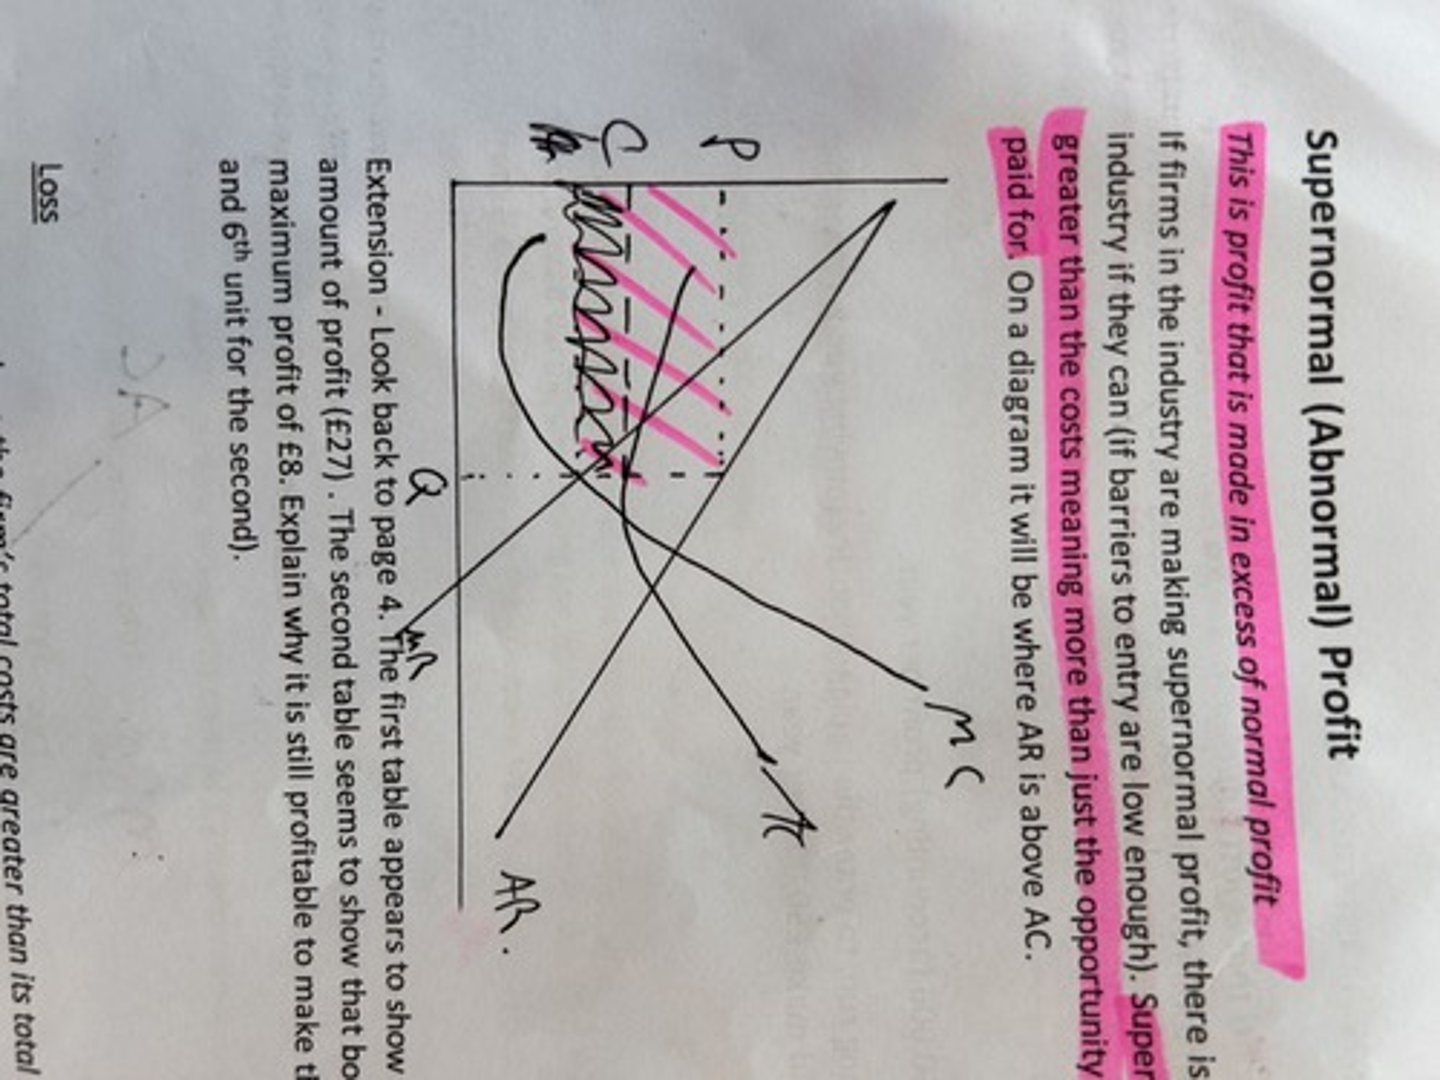
cost and revenues supernormal profit
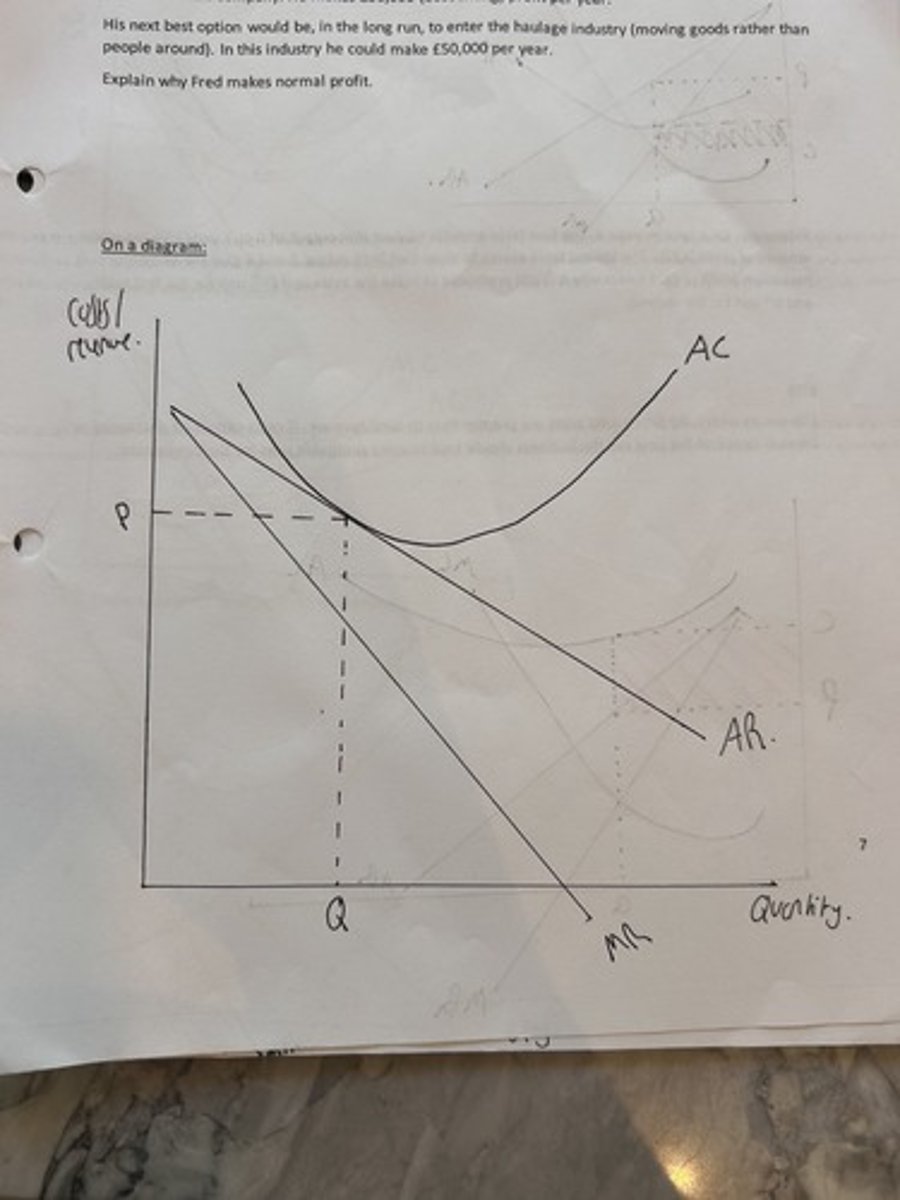
cost and revenues normal profit
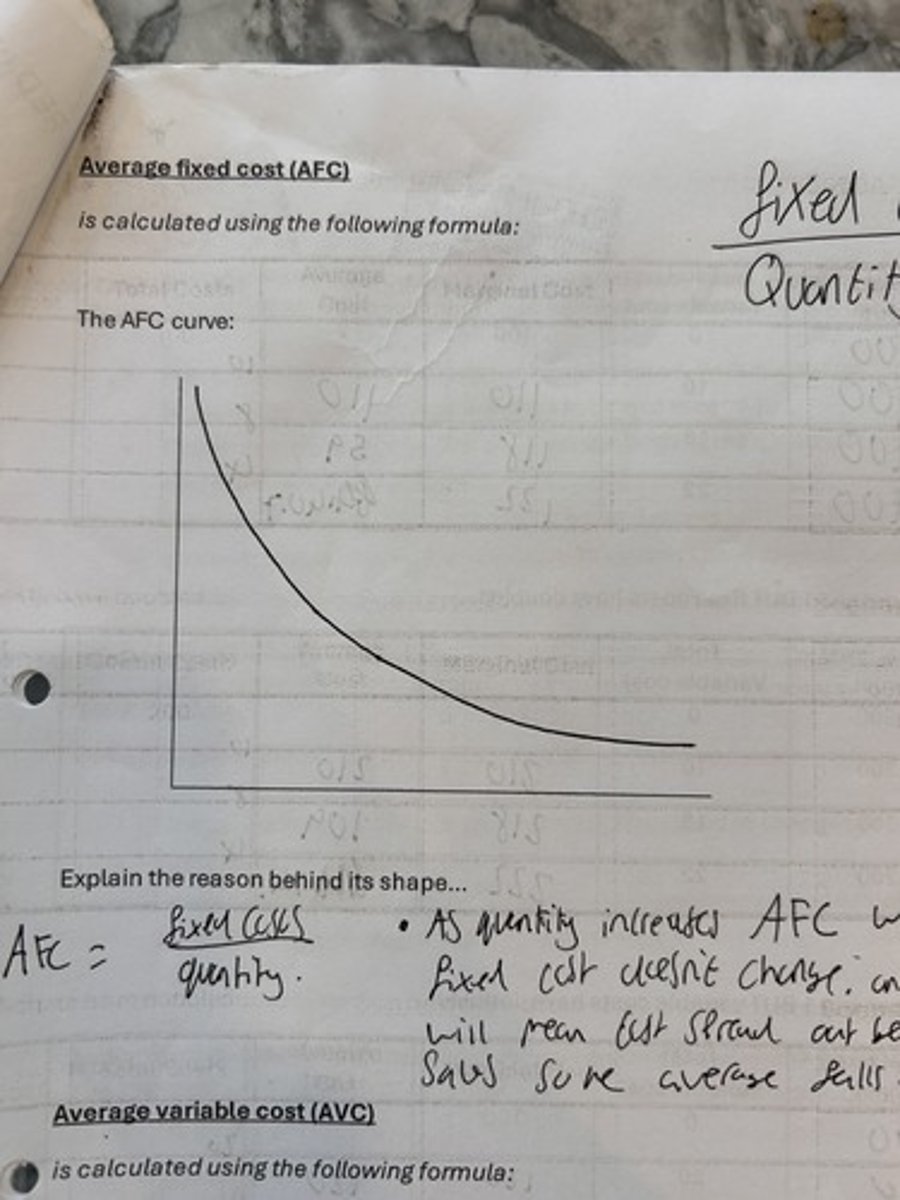
average fixed costs curve.
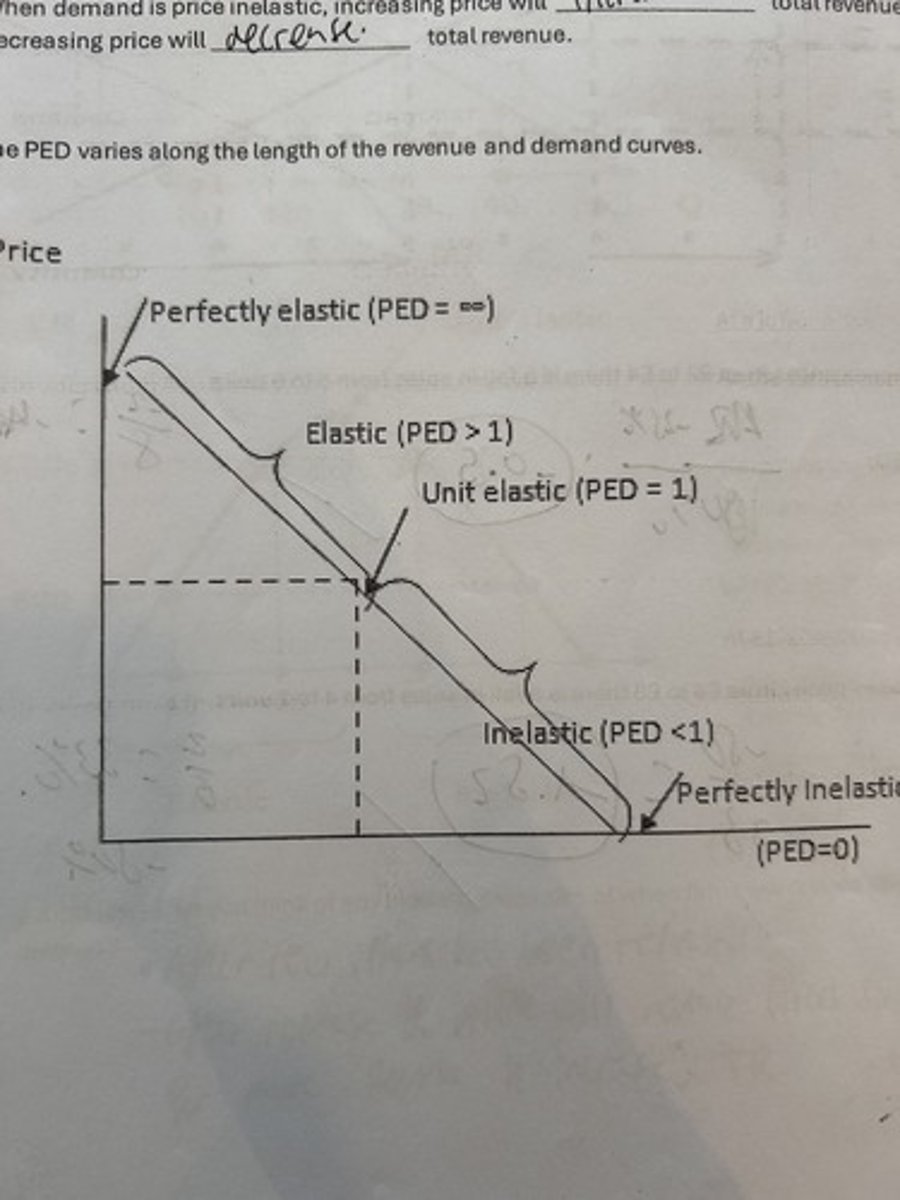
label how elasticity varies along the length of the average revenue curve
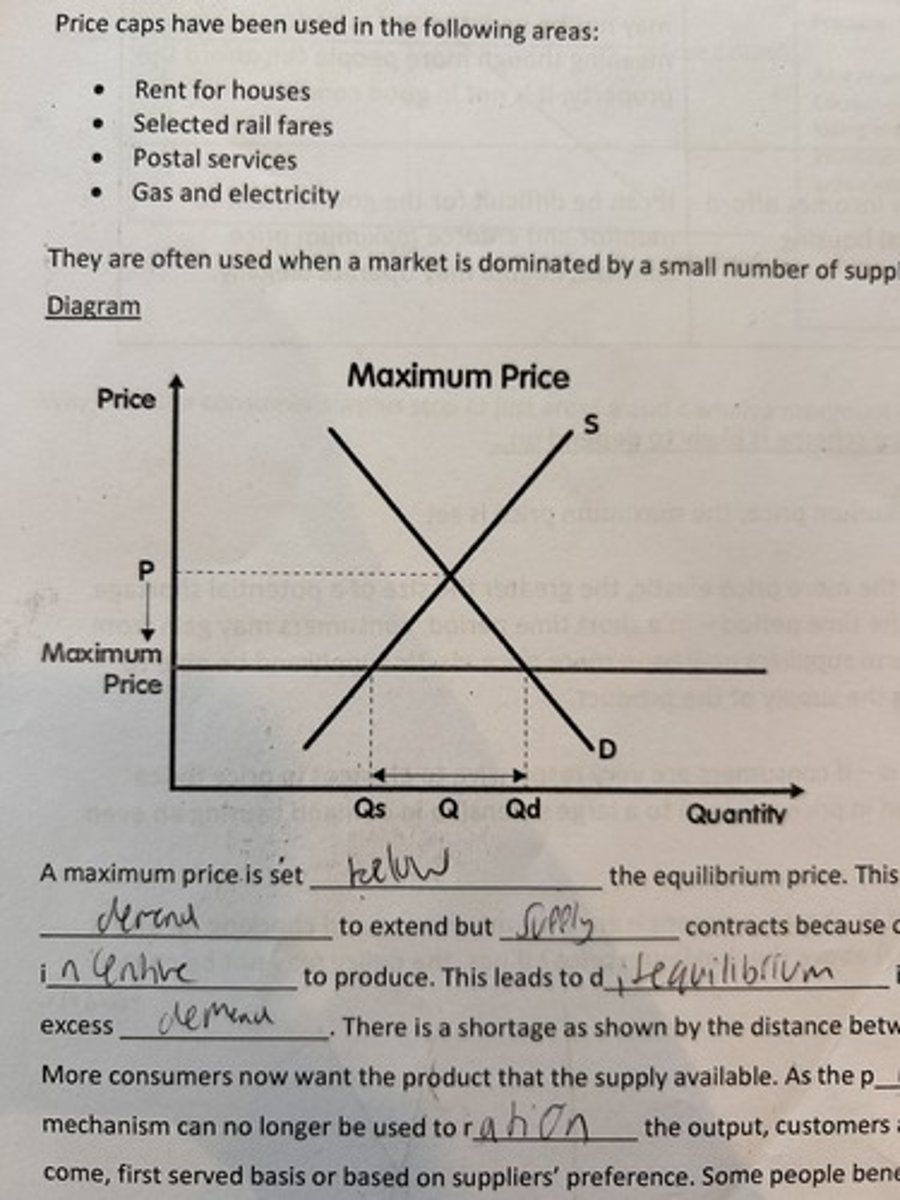
max price
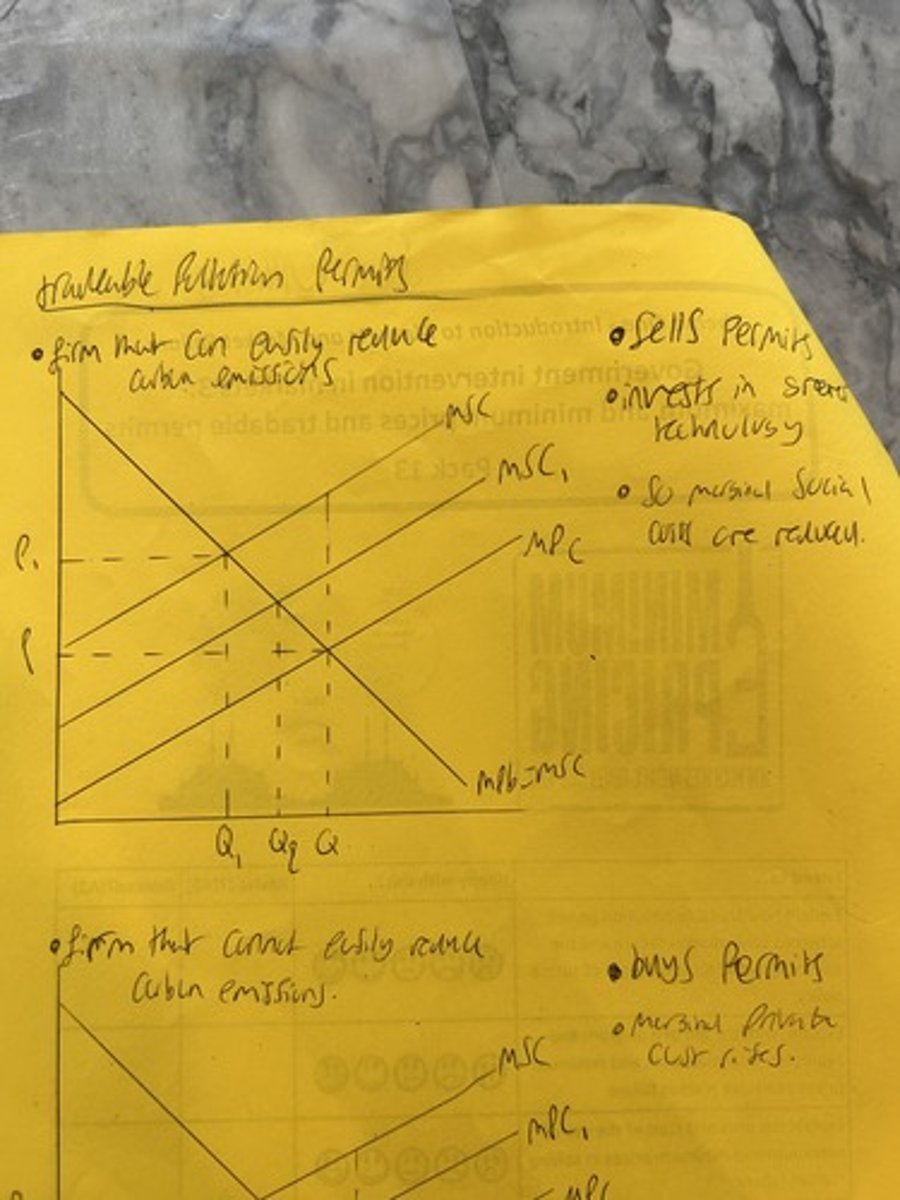
traceable pollution permits for firms who cannot easily reduce their pollution
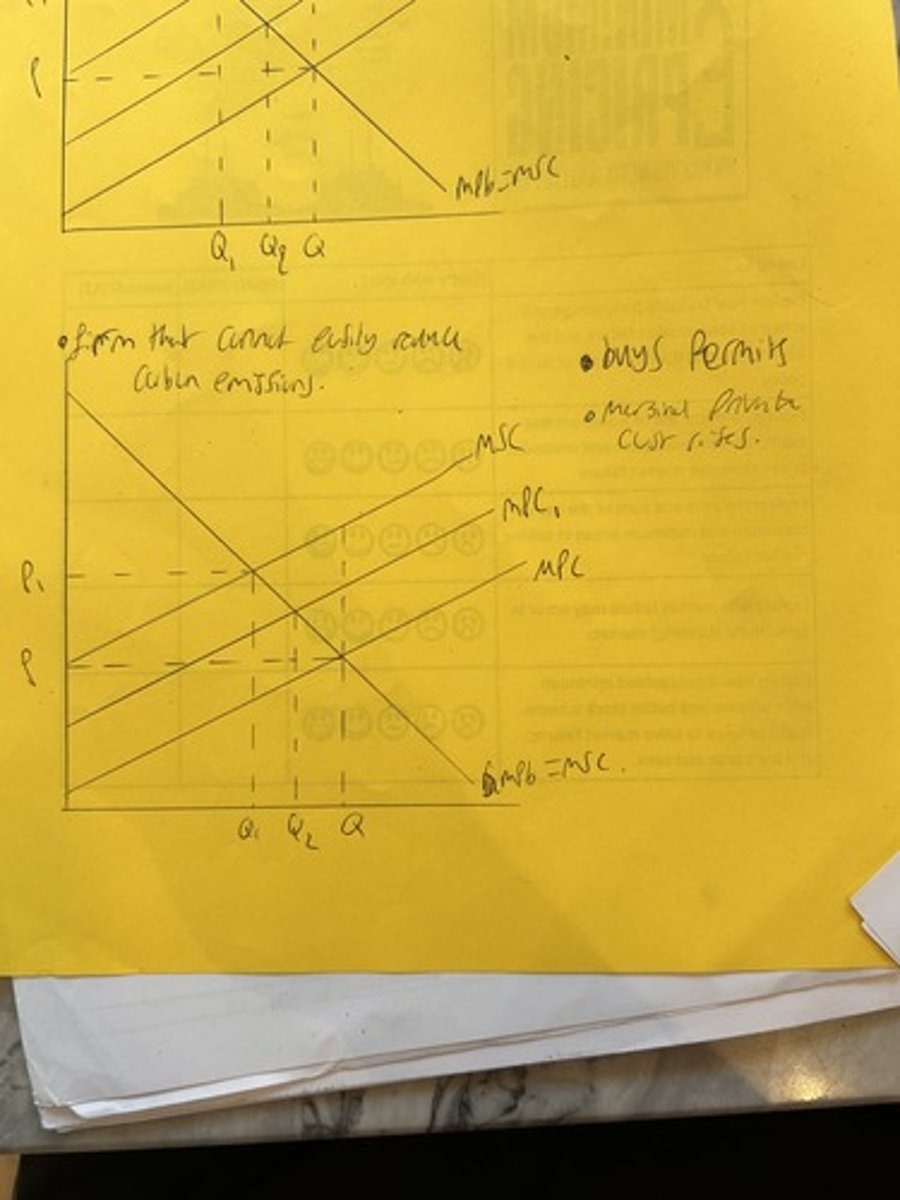
Tradable pollution permits for firms who can easily reduce their pollution.
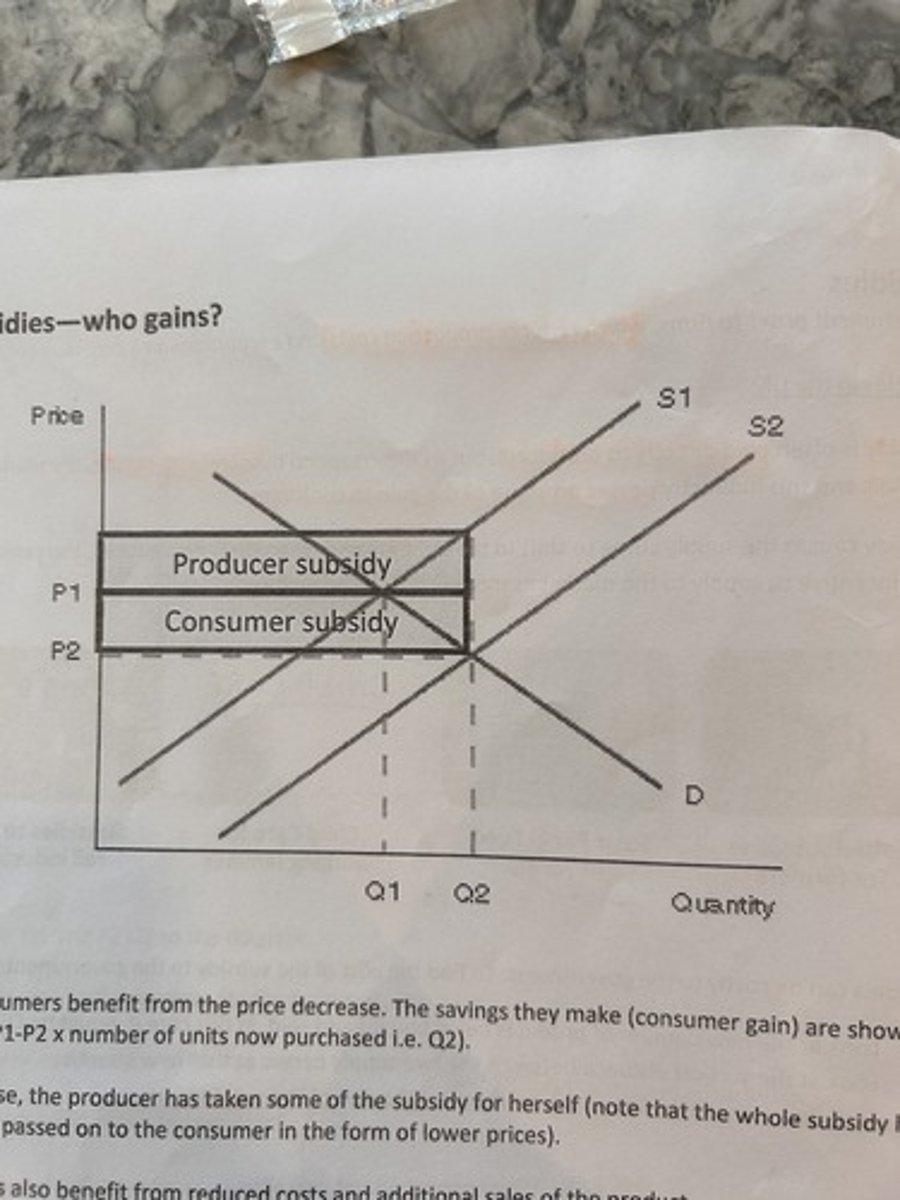
incidence of subsidy on consumer and producer.
government tax revenue
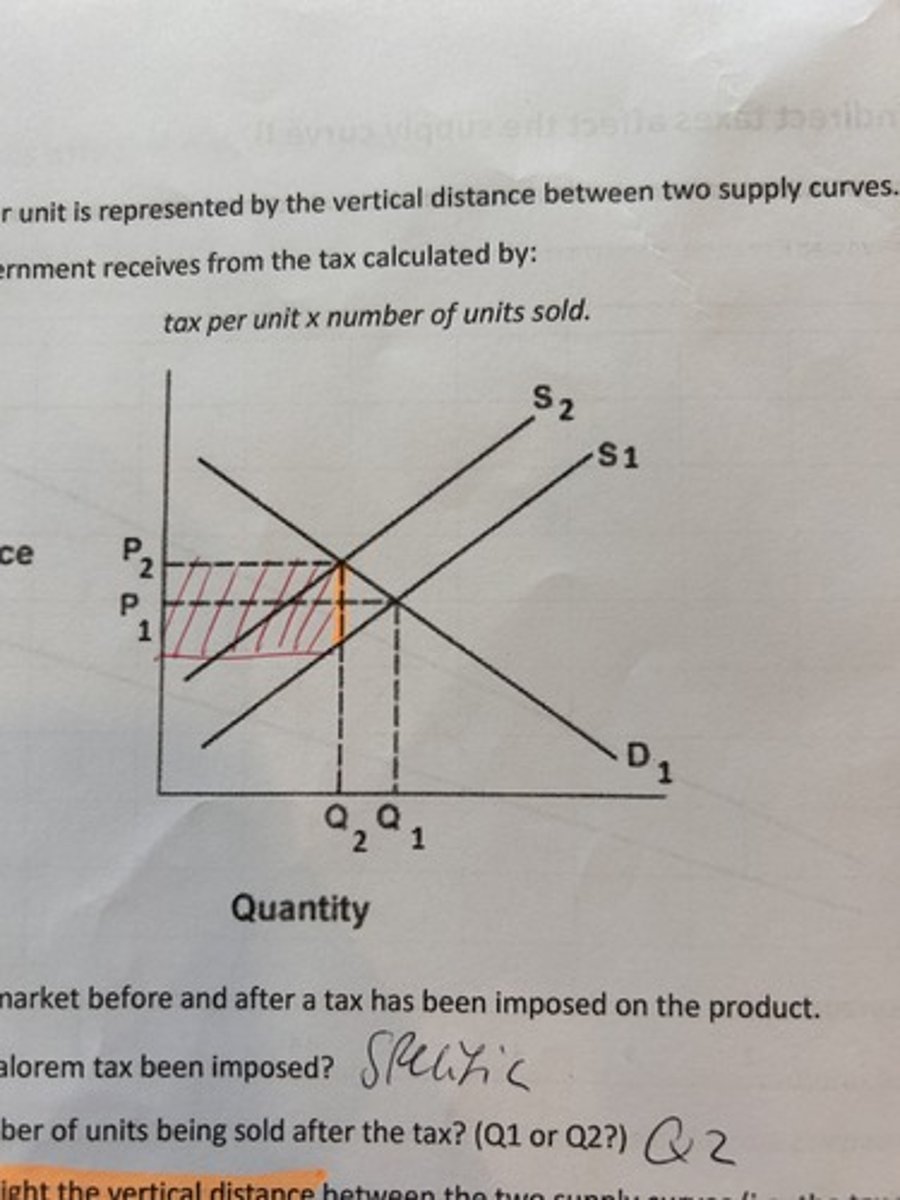
ad valorem tax
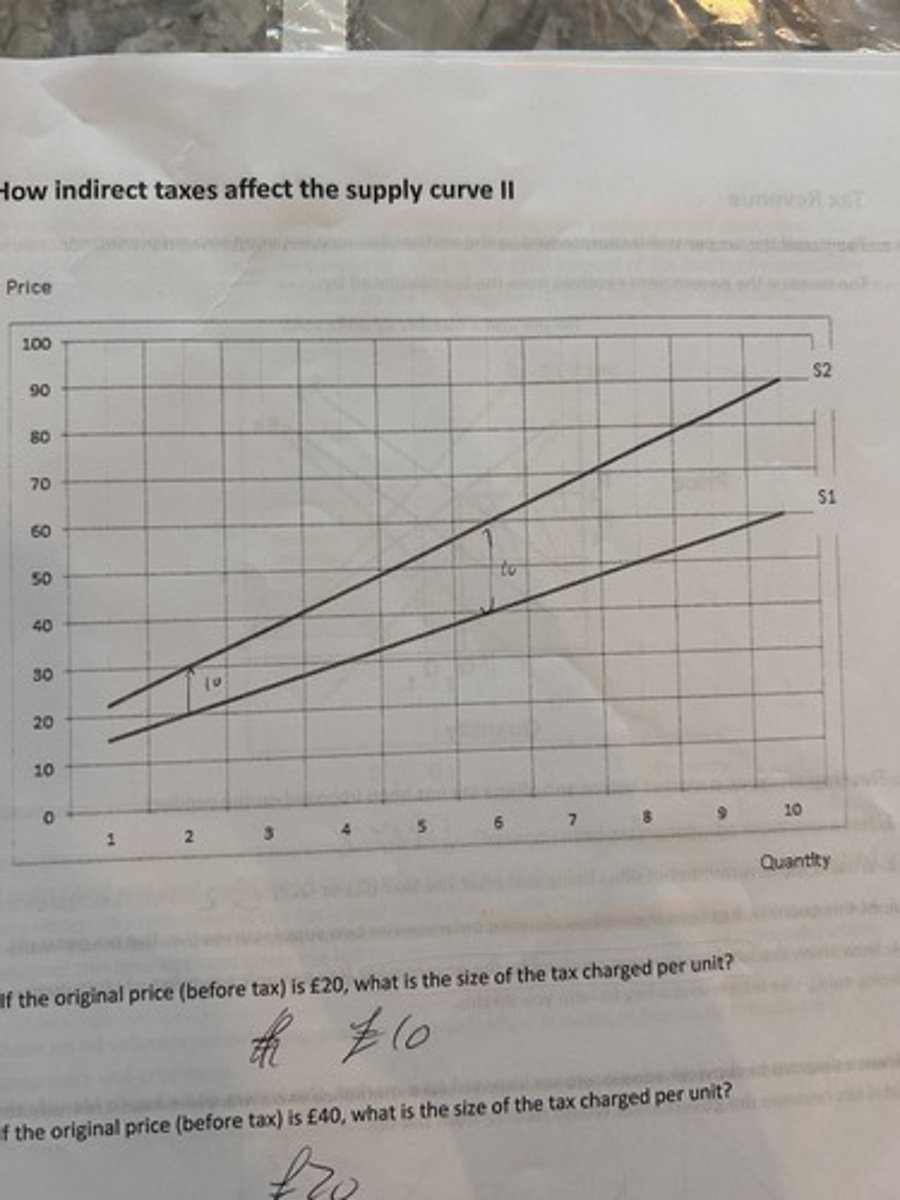
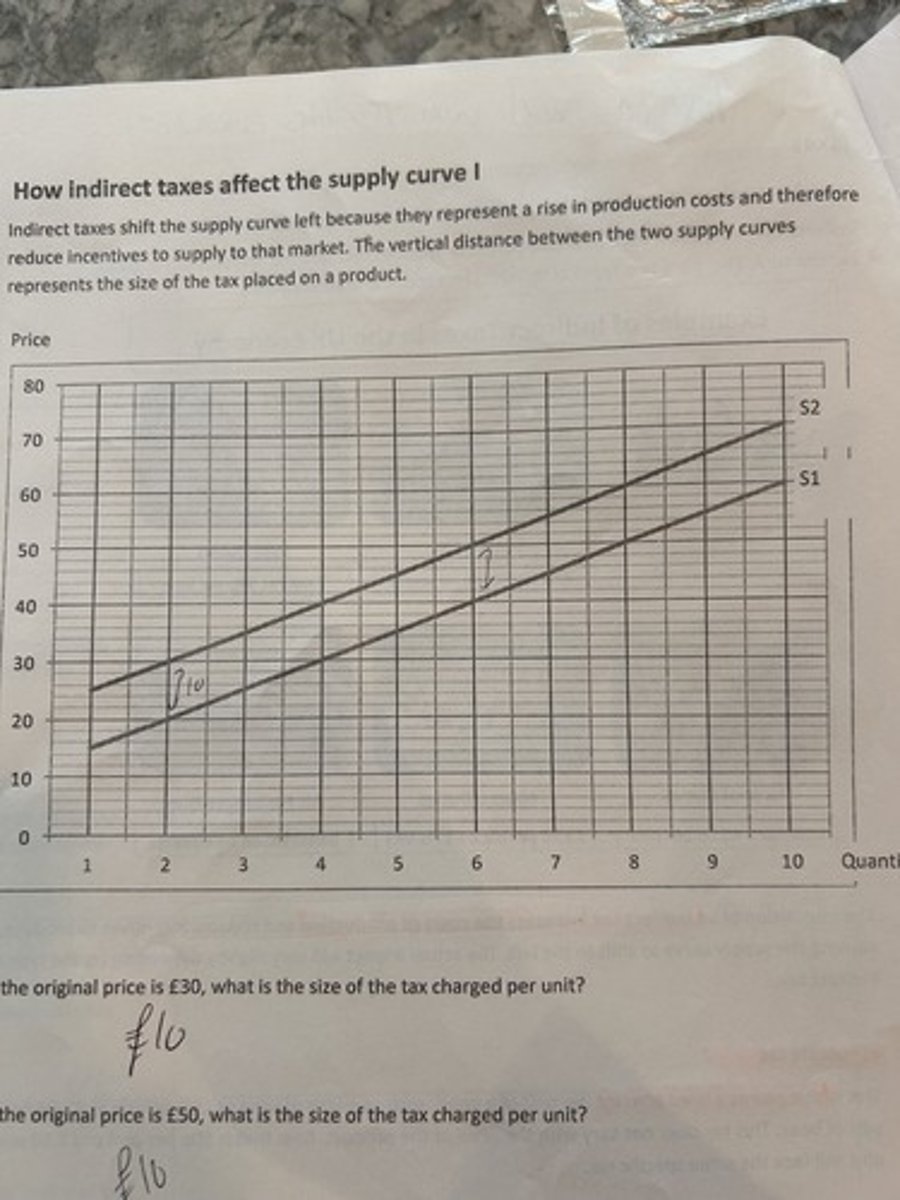
specific tax
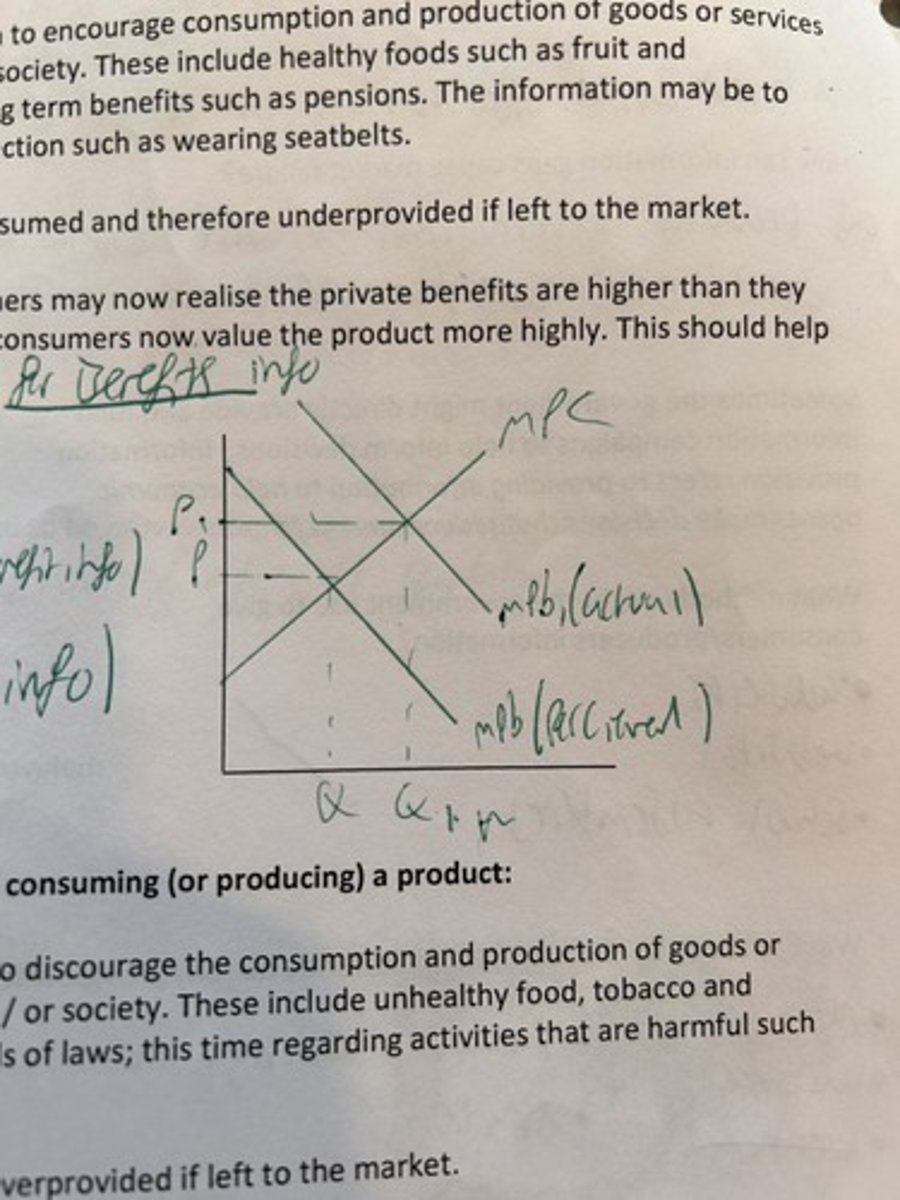
effects of info provision on good with positive externalities
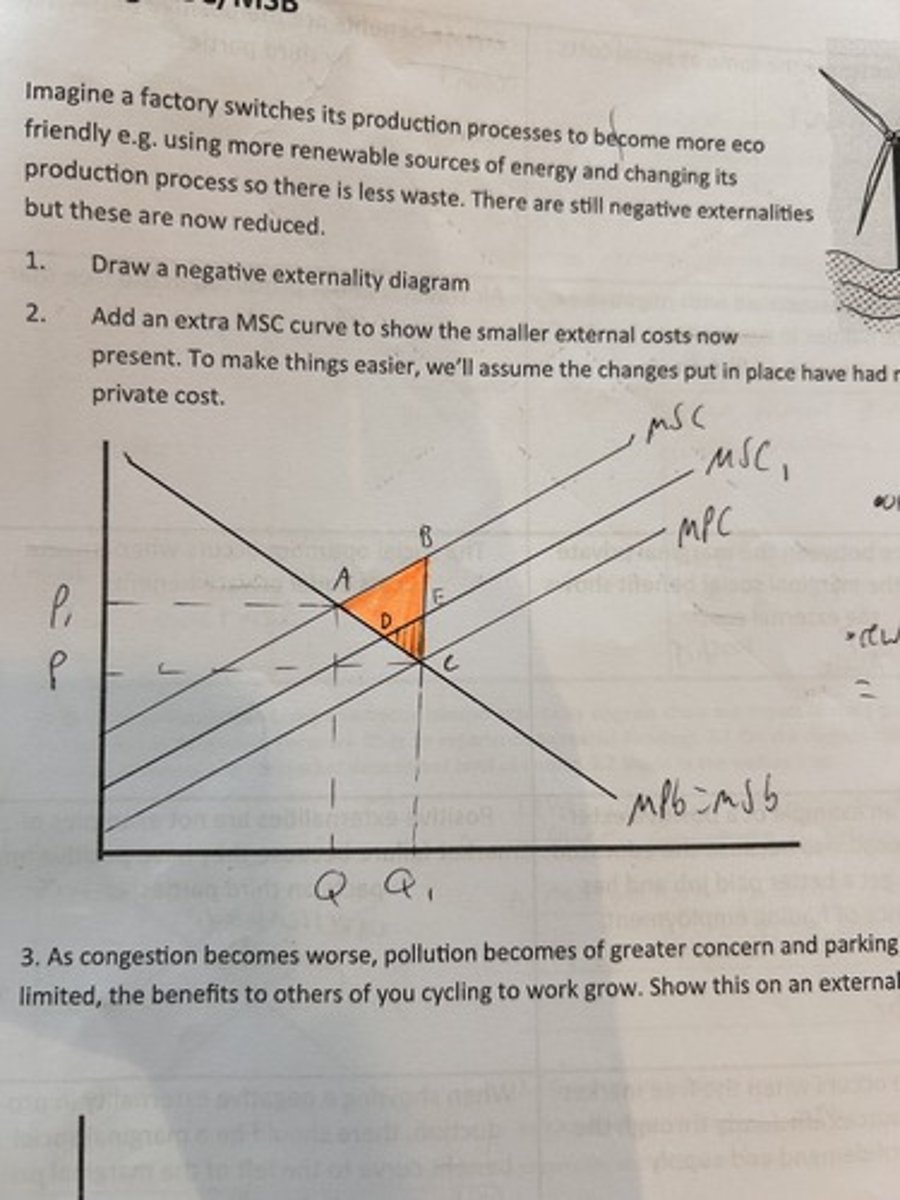
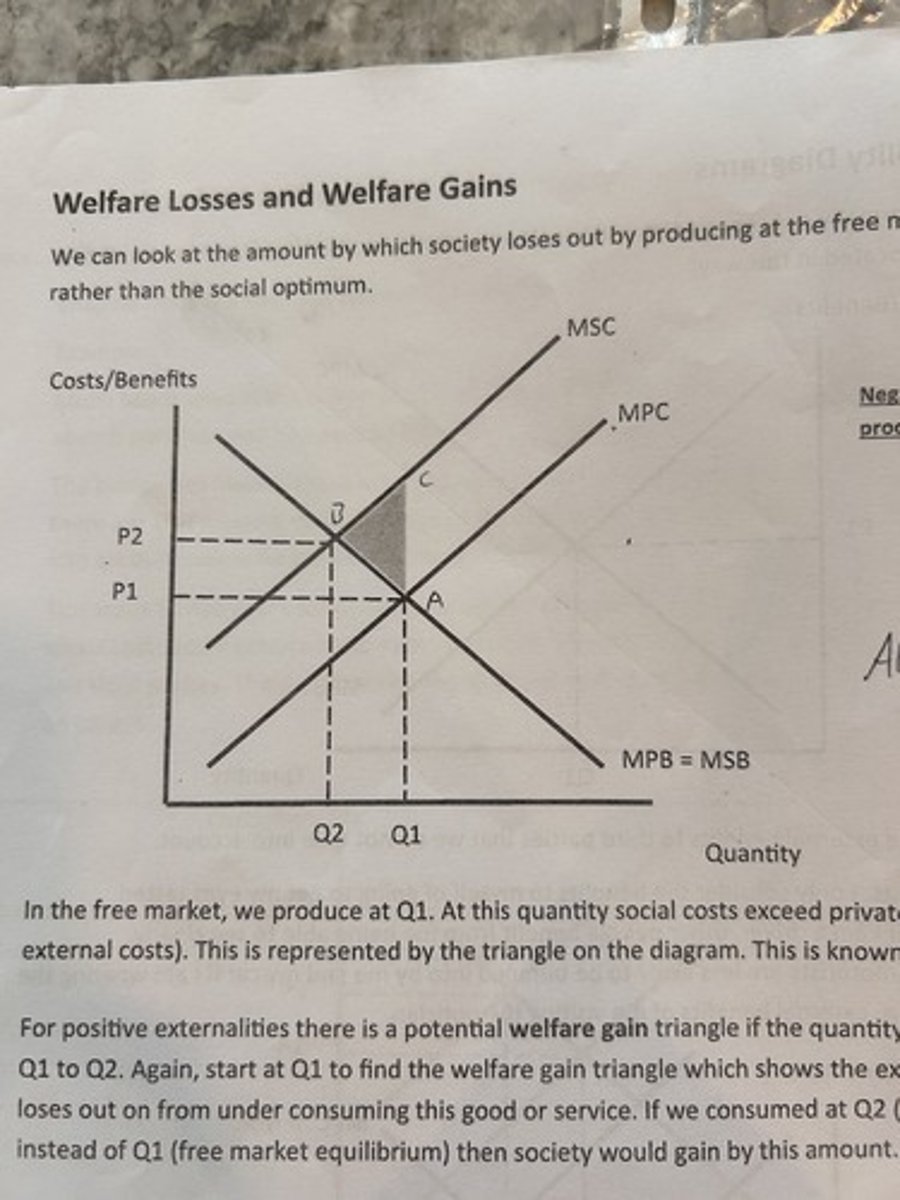
negative externality diagram. shows reduction in the externality. eg
firm reduces pollution.
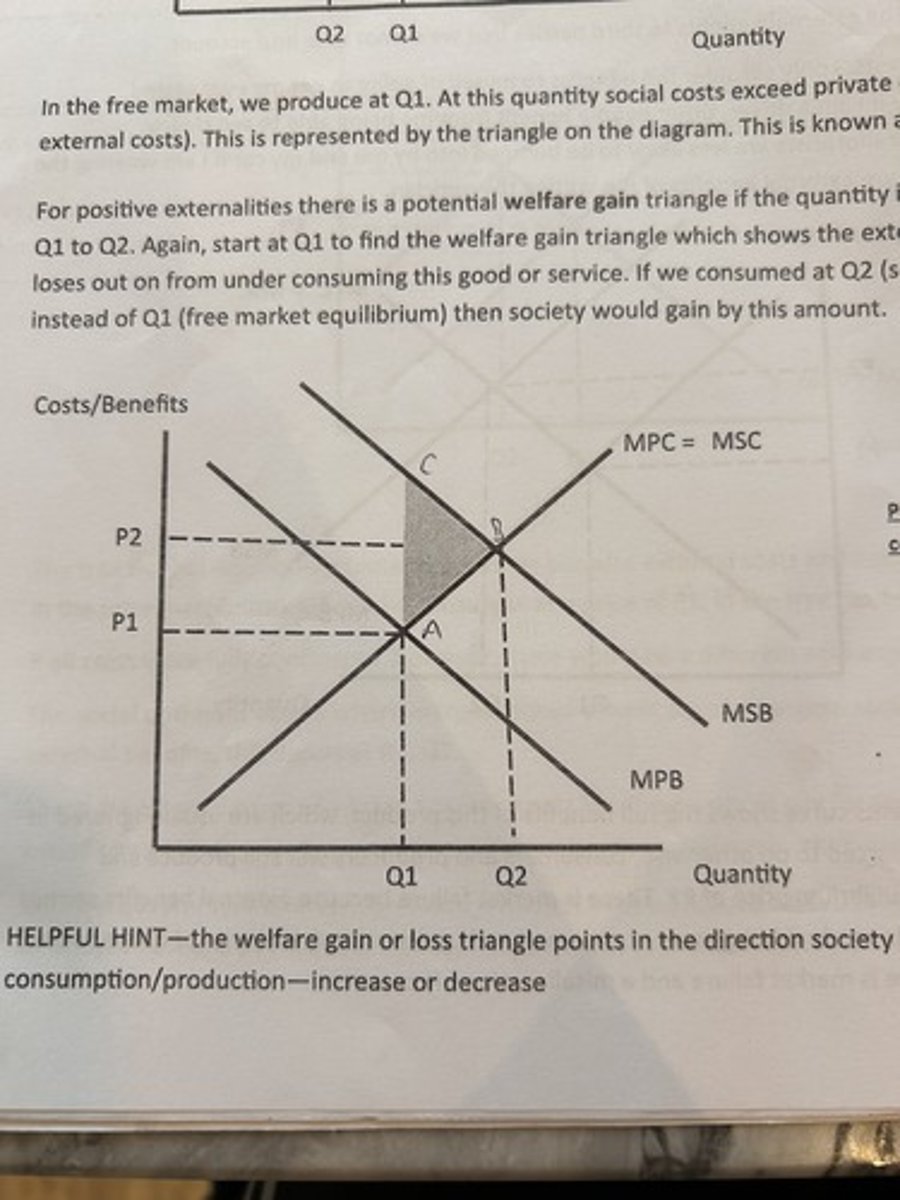
positive externality diagram.
negative externality diagram.
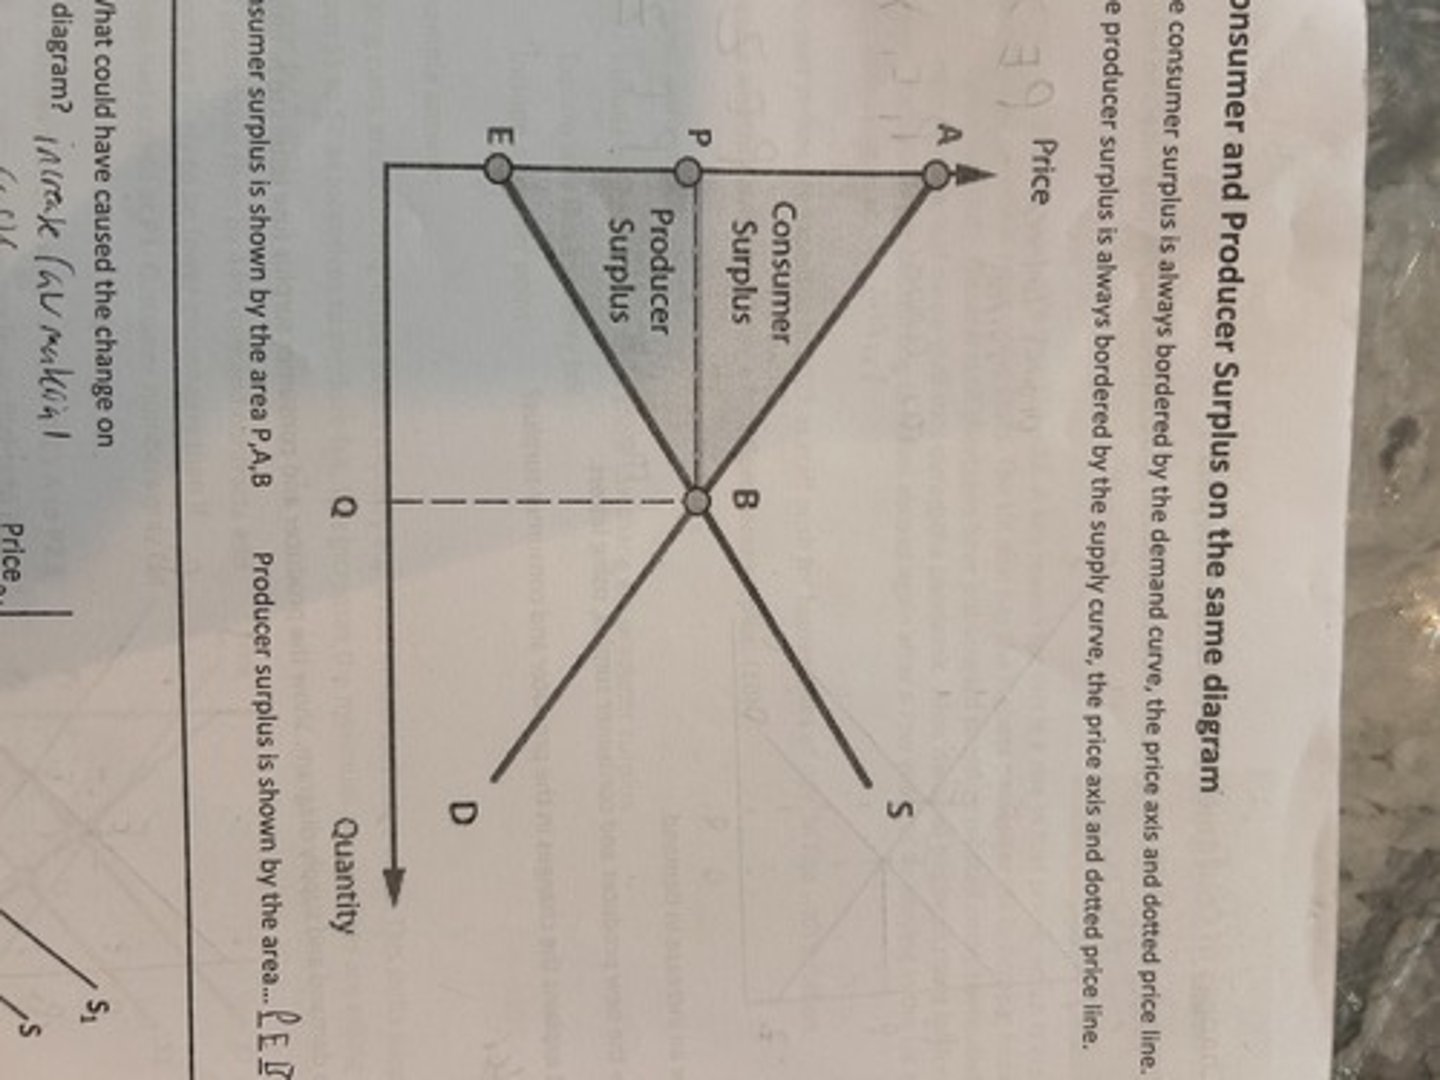
consumer and producer surplus on a supply and demand diagram.
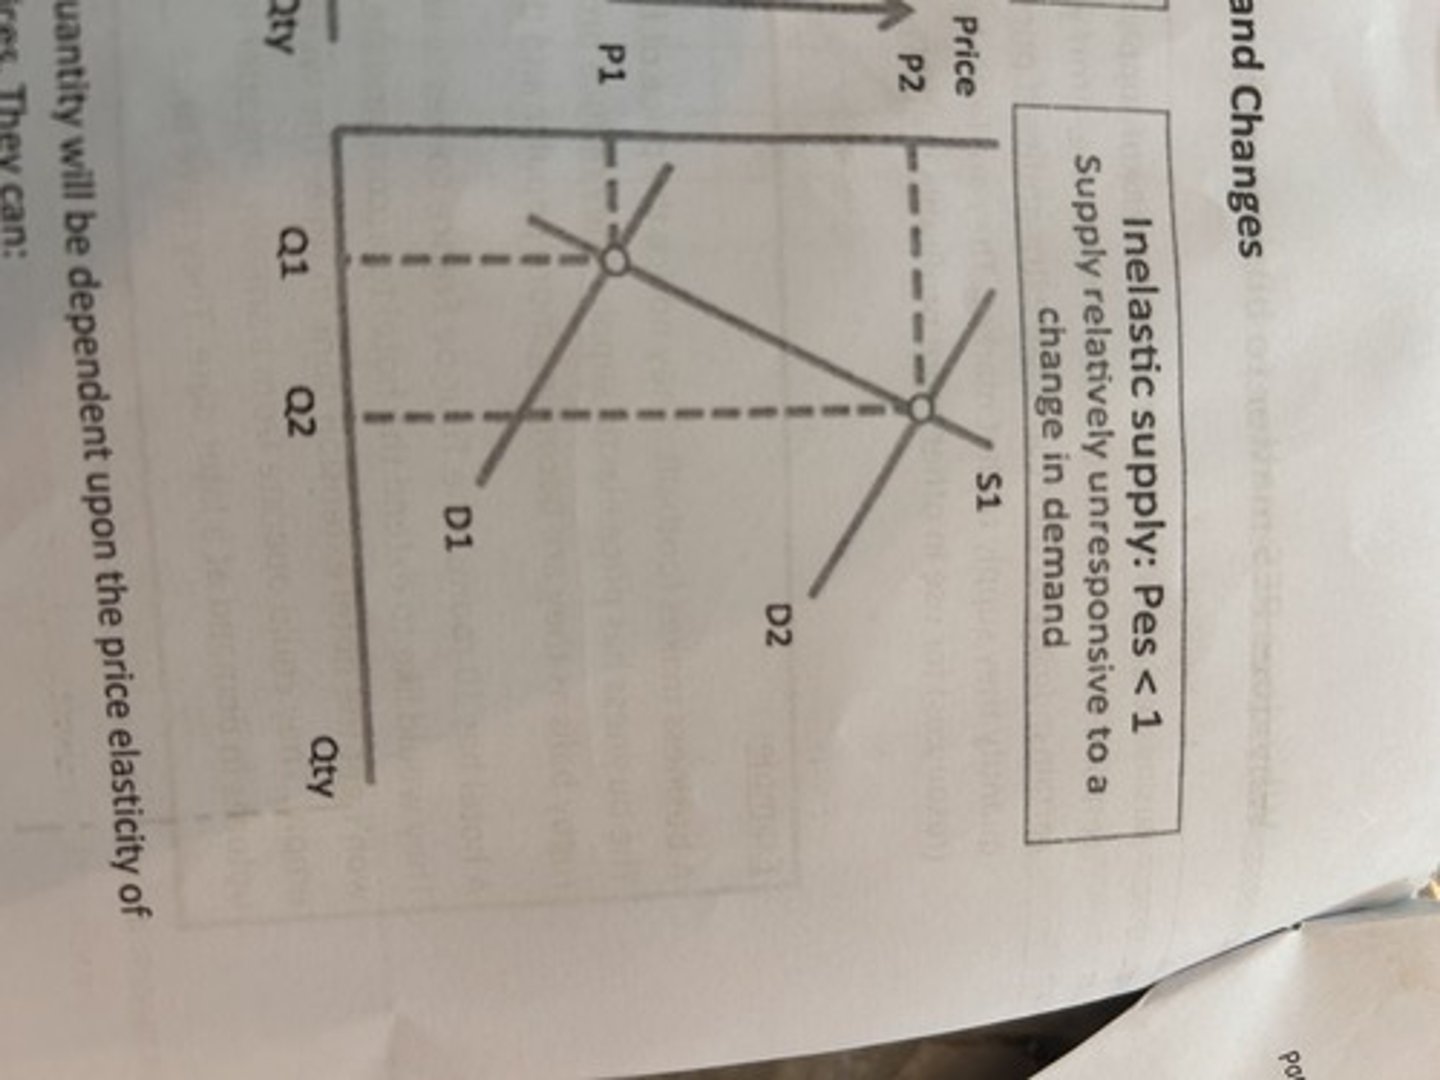
inelastic supply with a demand shift
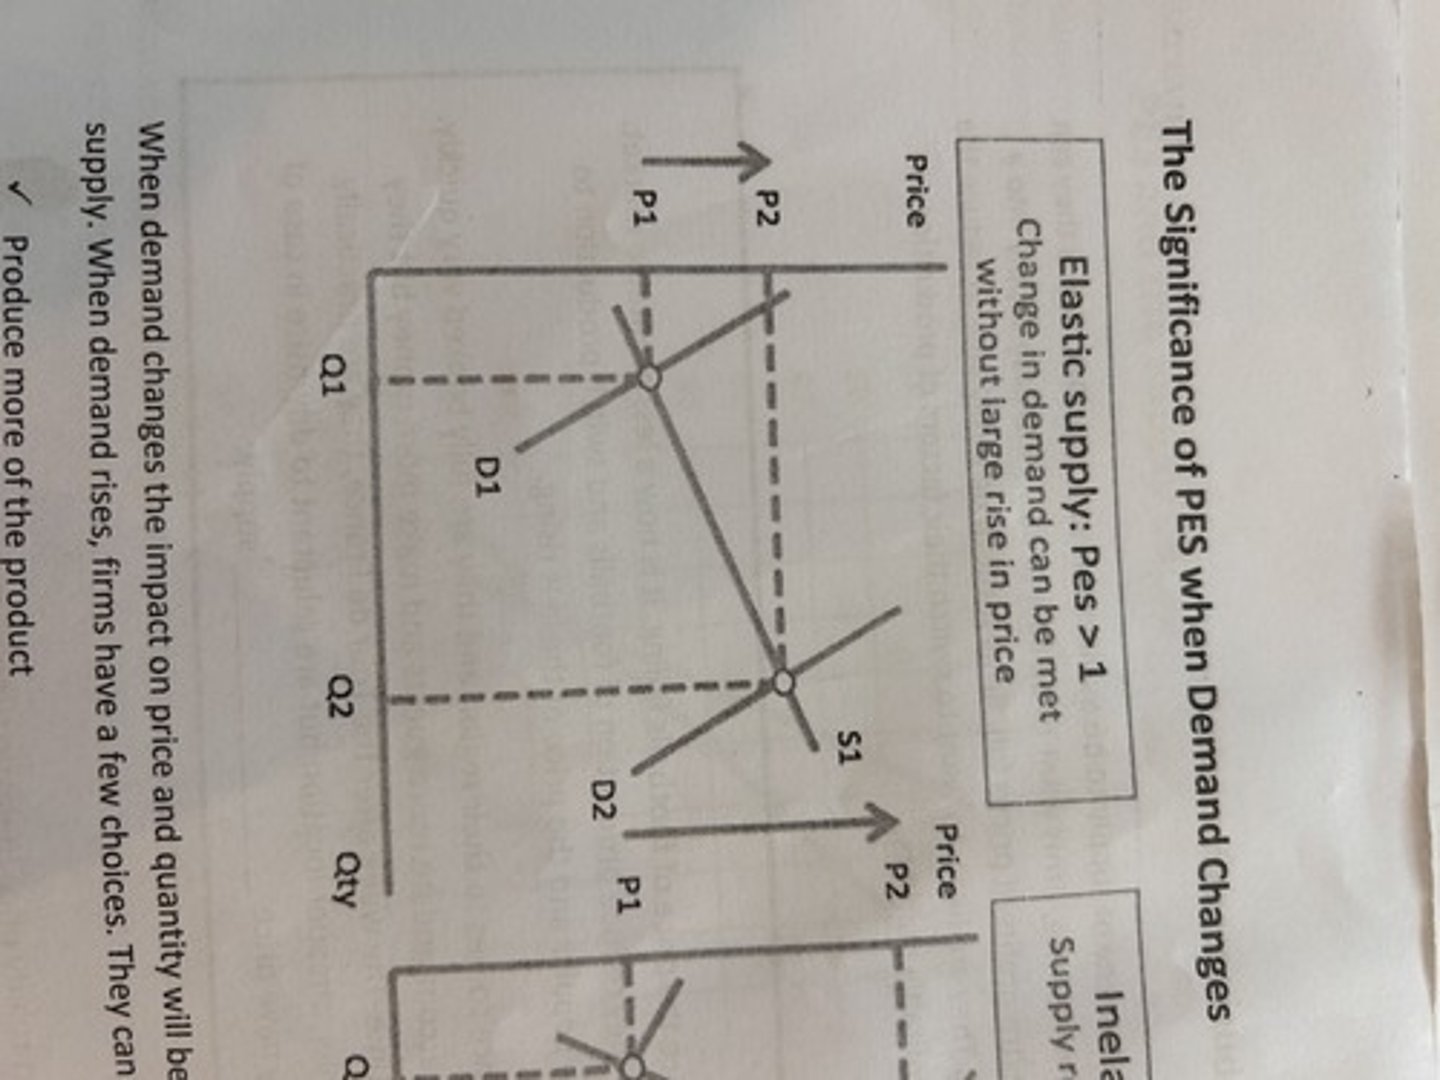
elastic supply with a demand shift.
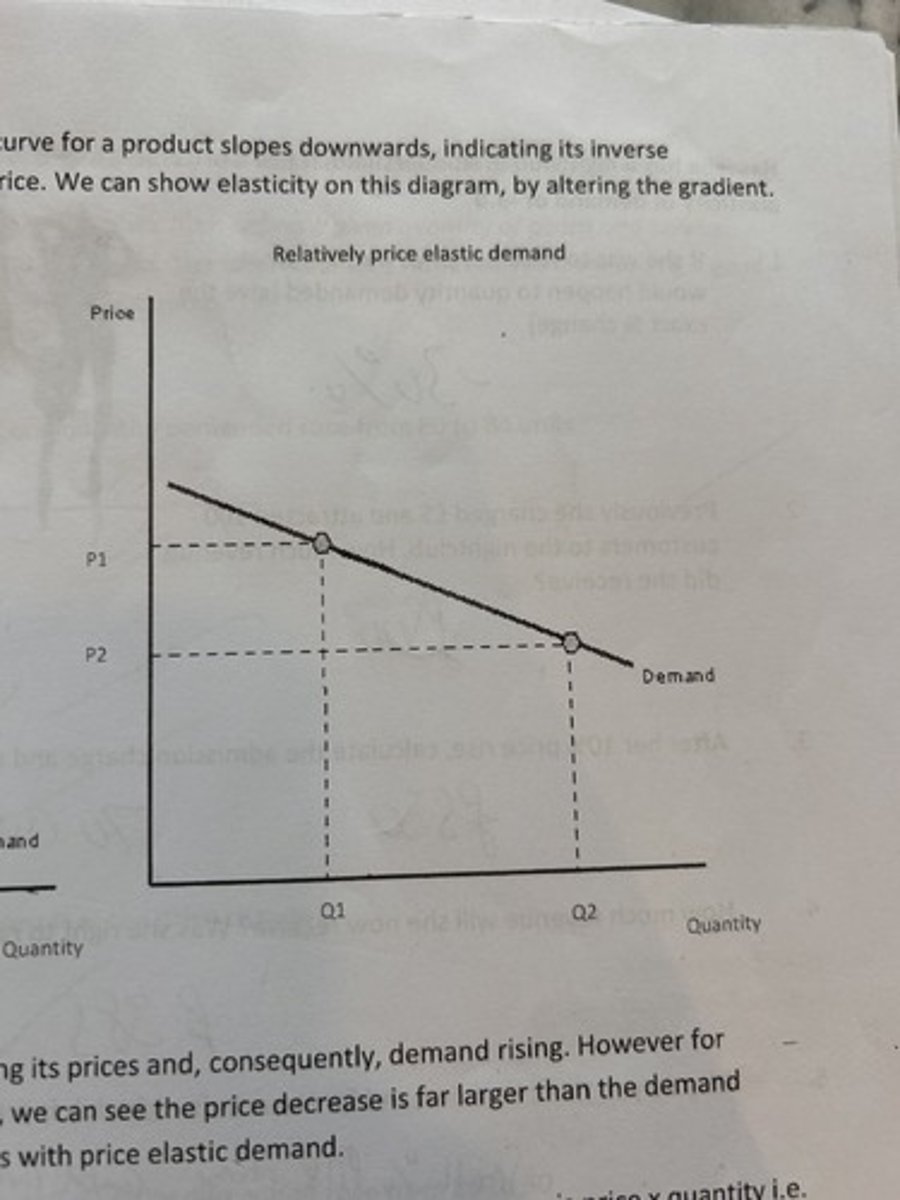
price elastic demand
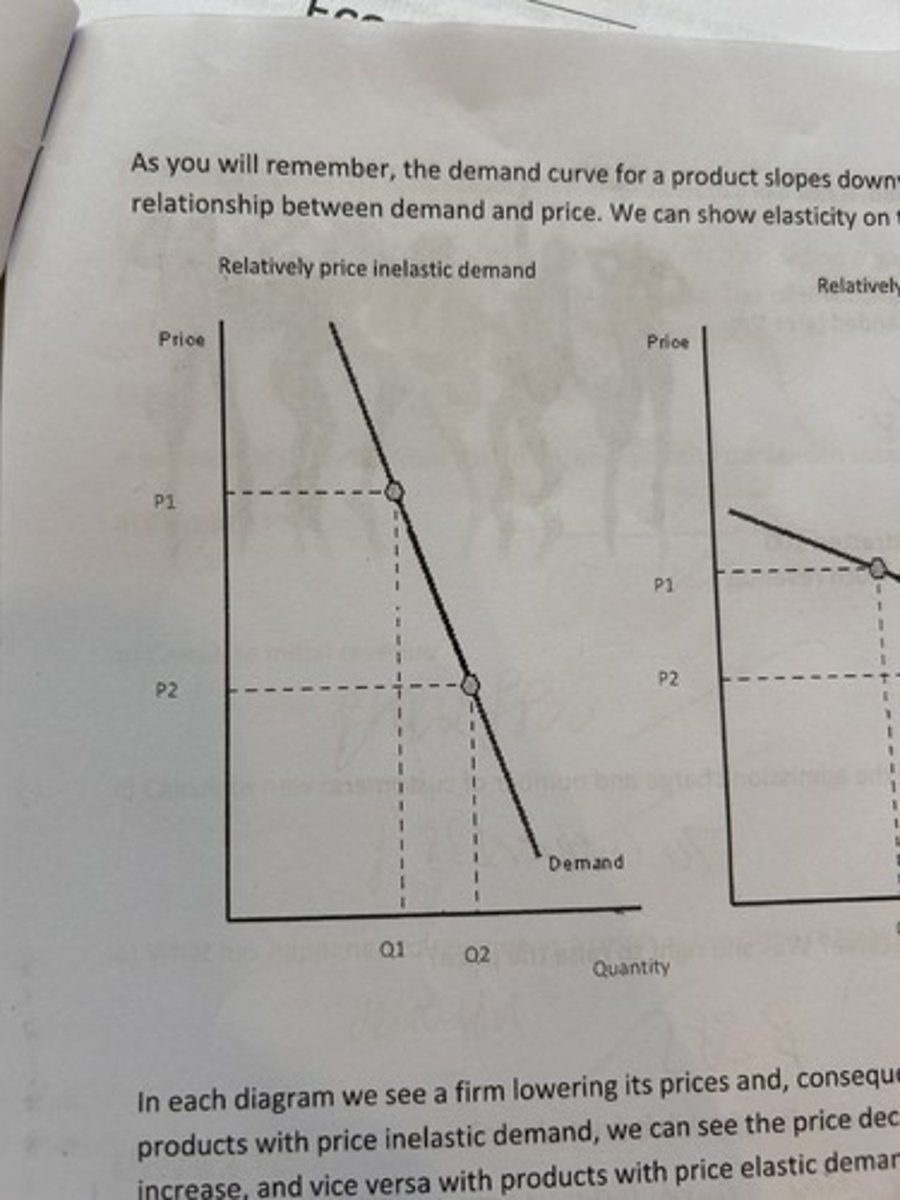
price inelastic demand.
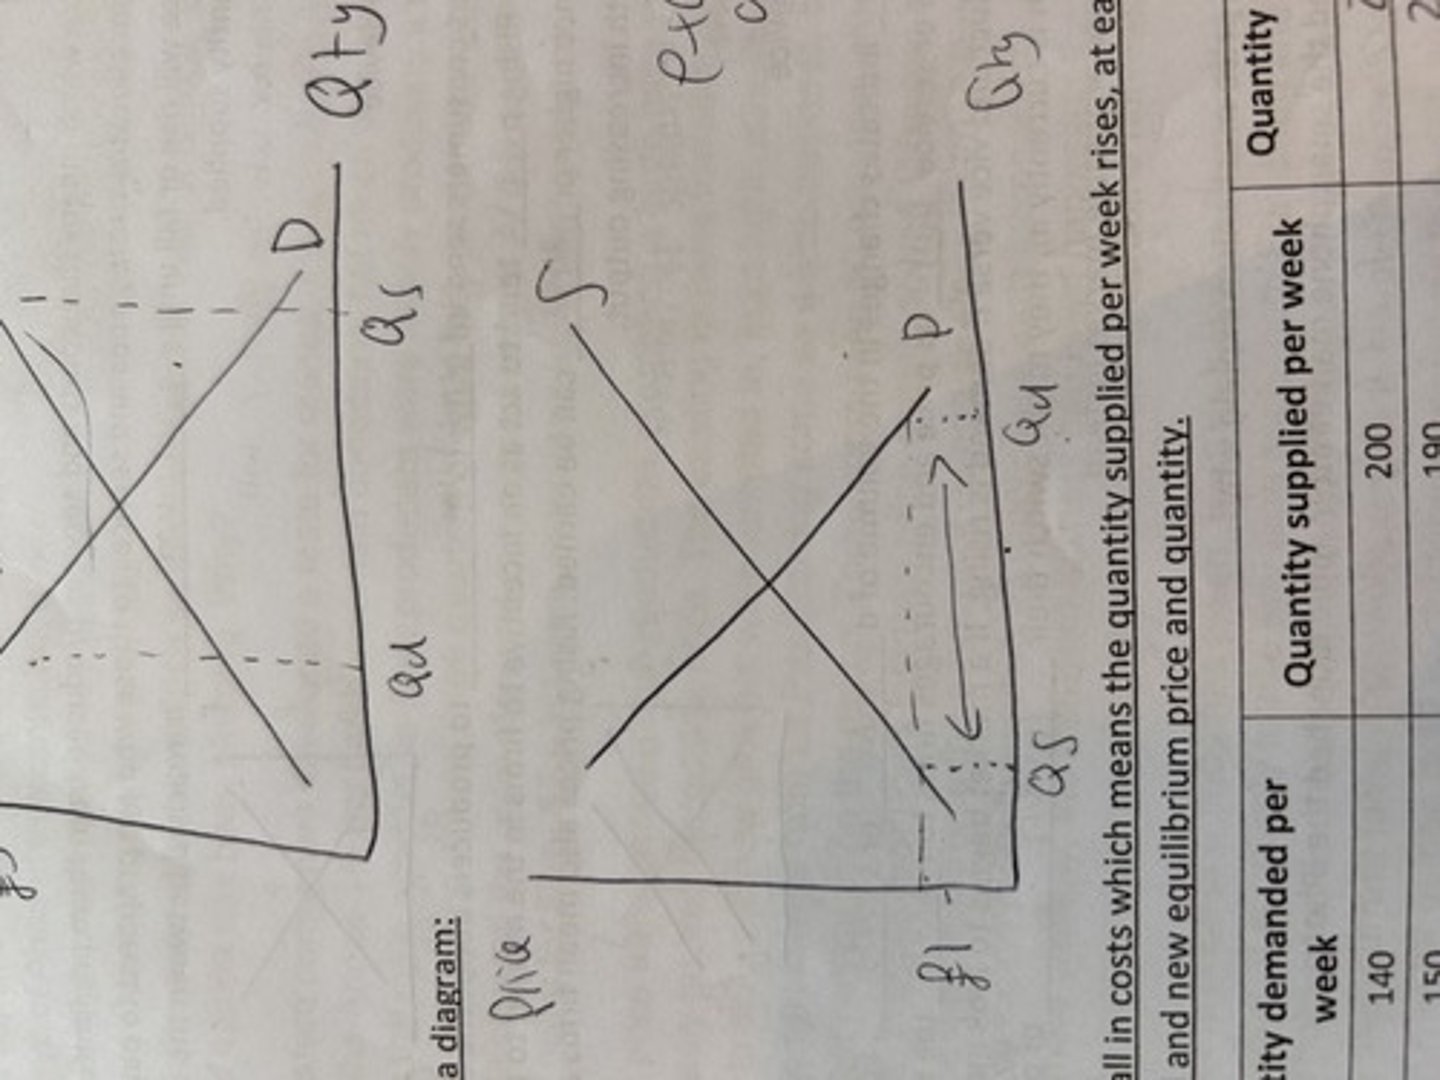
excess demand. shortage
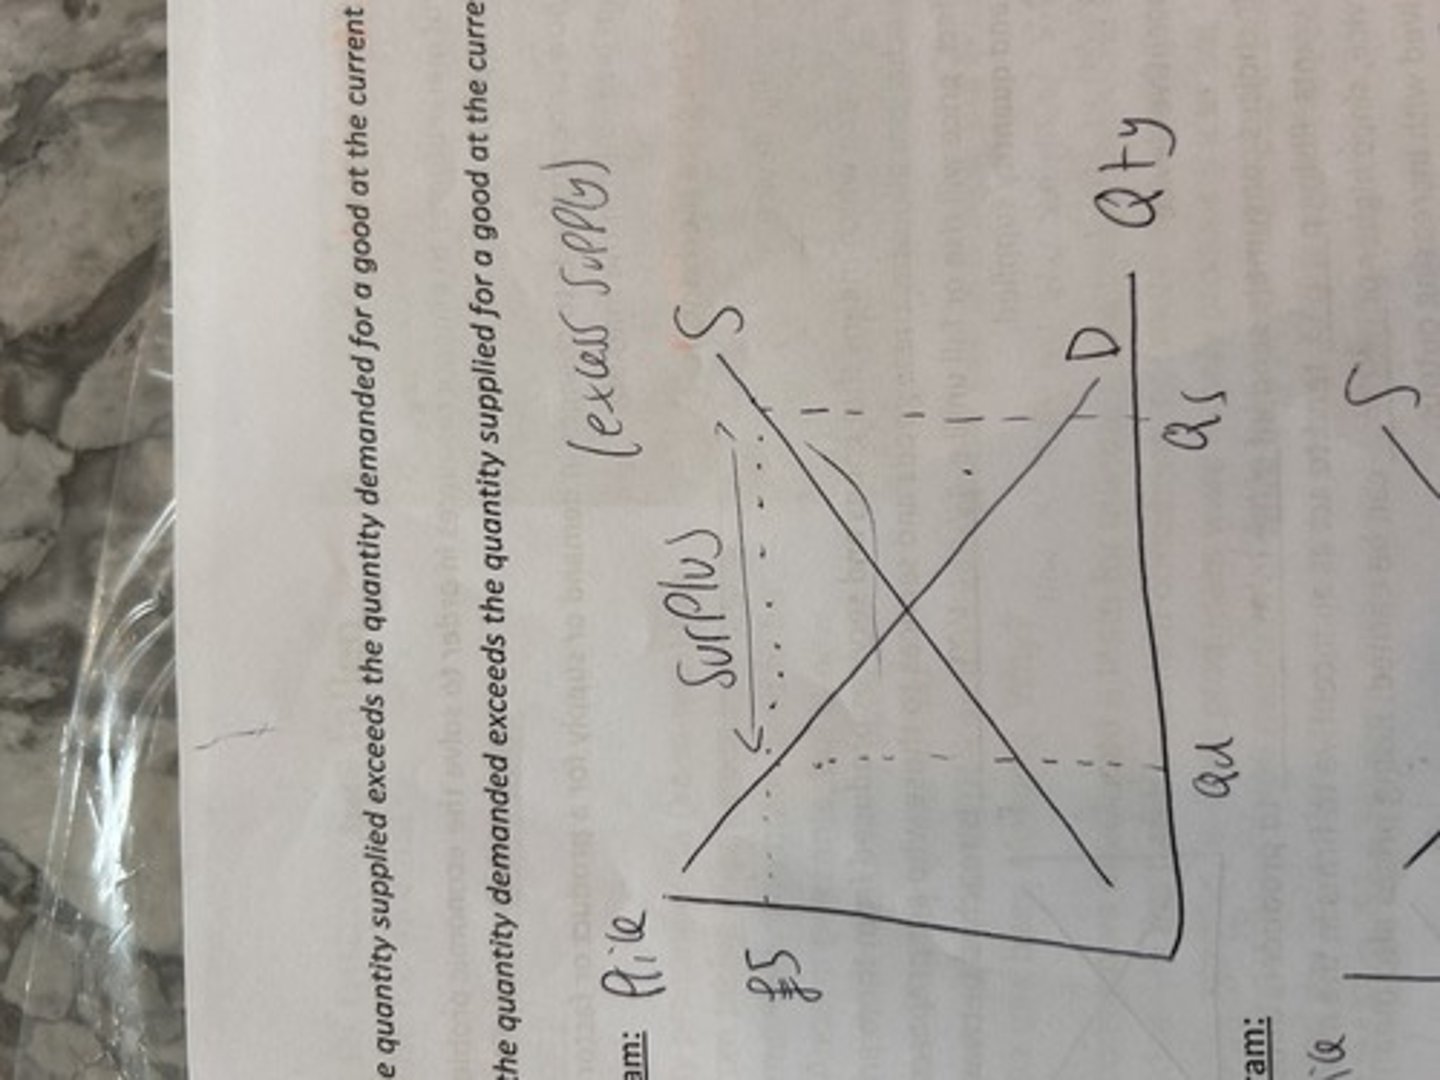
excess supply. surplus
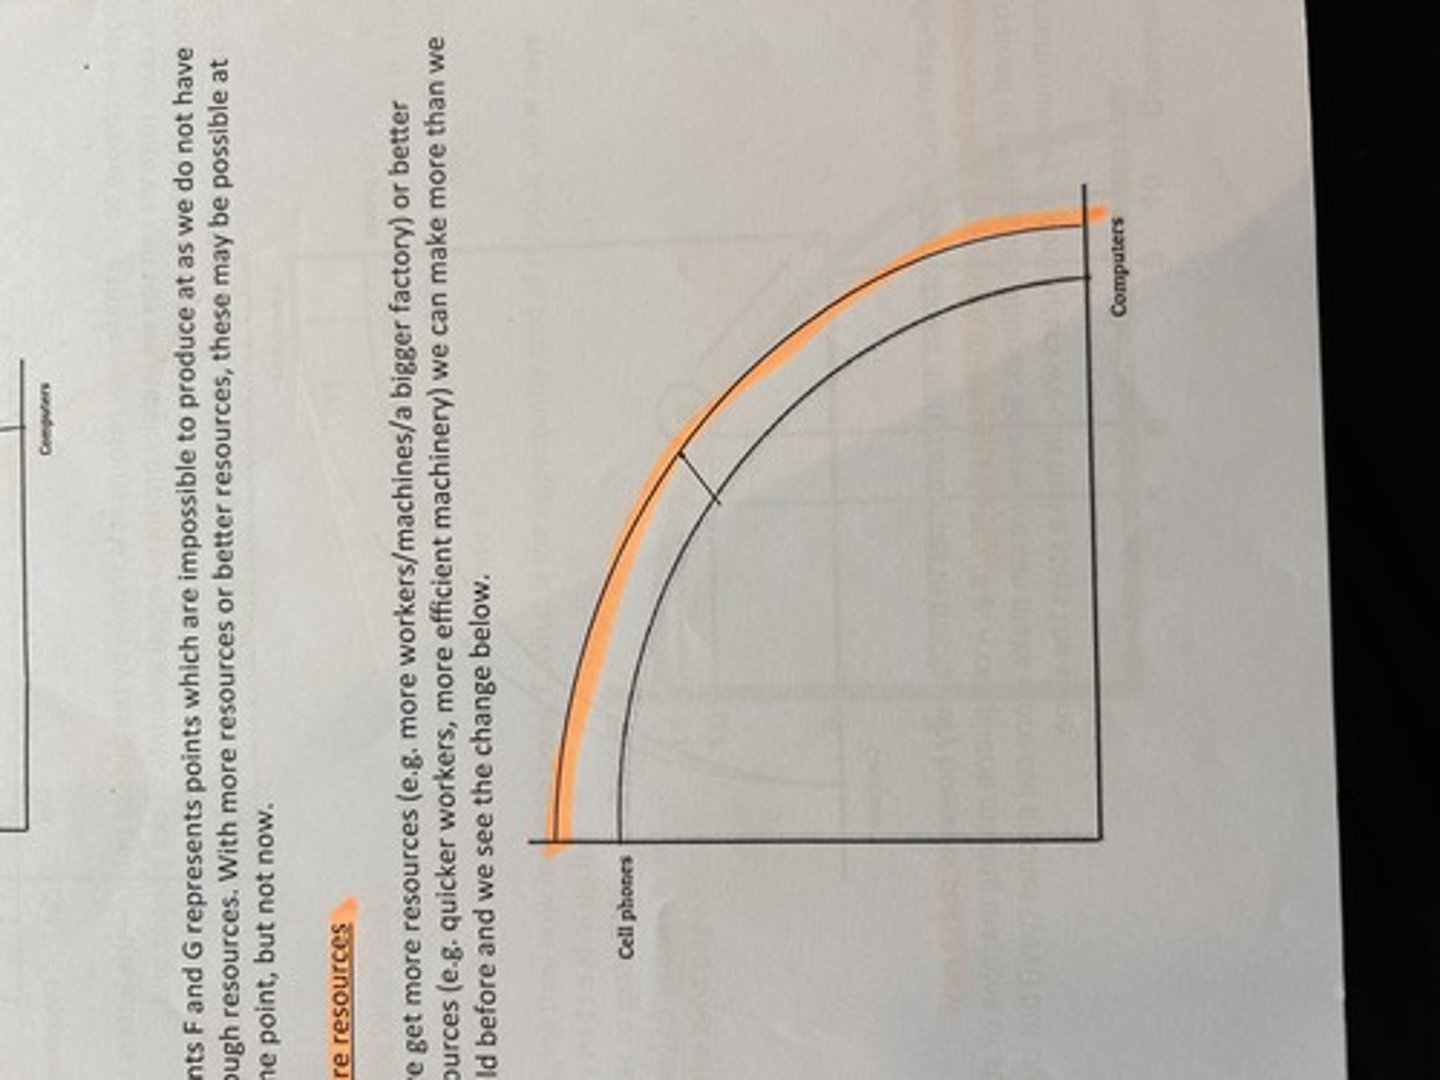
shift out in ppf
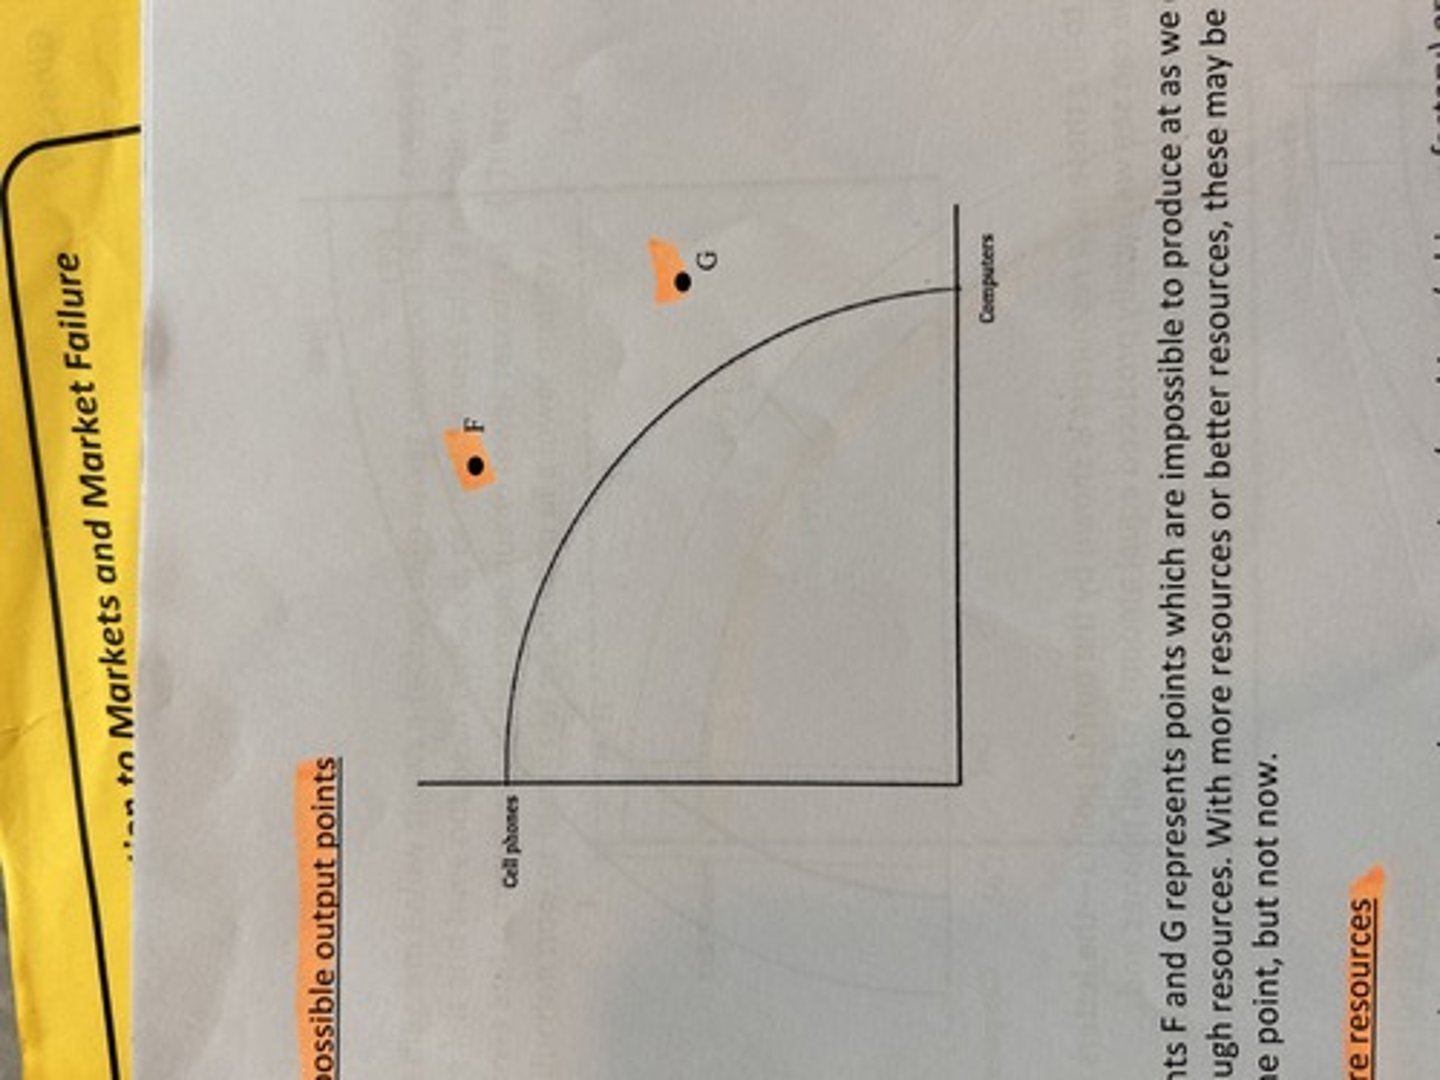
impossible ppf points
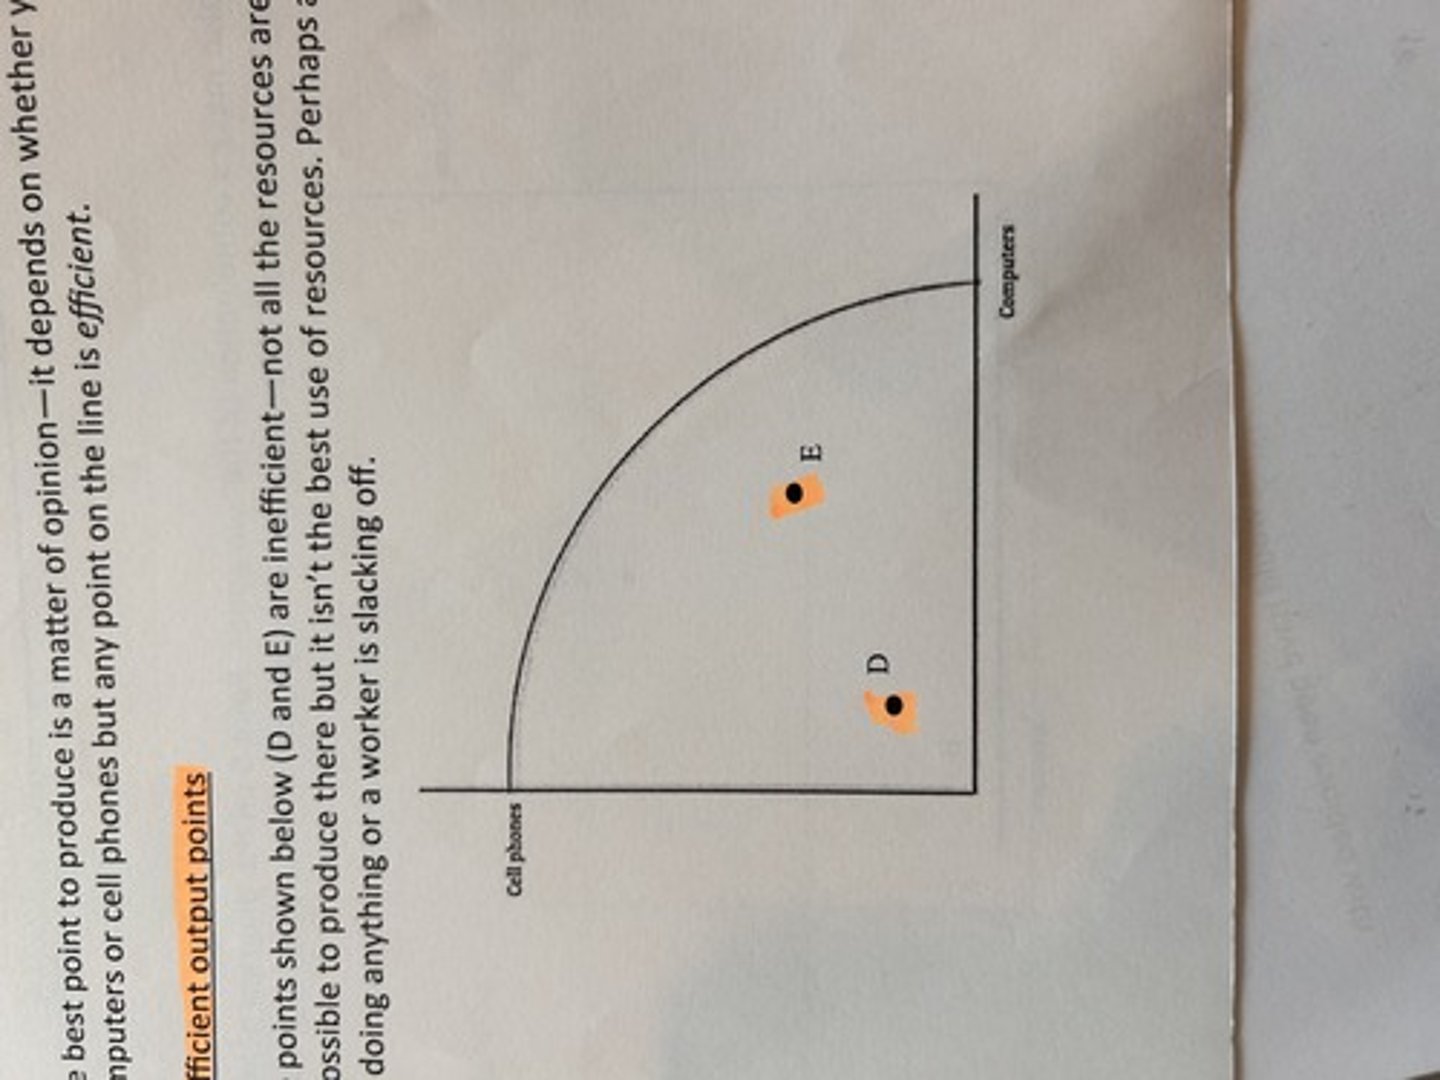
inefficient ppf points. not all resources fully and efficiently used.