economics (demand, supply, equilibrium)
5.0(2)
Studied by 16 peopleCard Sorting
1/58
Earn XP
Description and Tags
Last updated 7:30 PM on 5/11/25
Name | Mastery | Learn | Test | Matching | Spaced | Call with Kai |
|---|
No analytics yet
Send a link to your students to track their progress
59 Terms
1
New cards
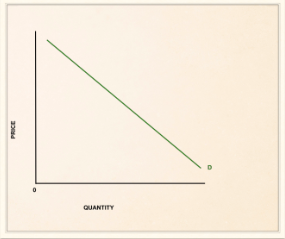
demand
the willingness and ability to purchase a good or service
2
New cards
law of demand
if prices go up, demand will go down.
if prices go down, demand will go up.
if prices go down, demand will go up.
3
New cards
demand curve
represents the utility one gets when consuming a good or service
4
New cards
individual demand
each of us have our own level of demand for a good or service
5
New cards
market demand
sum of all individual demand for a good or service
6
New cards
change in quantity demanded
a change in price leading to movement along the demand curve
7
New cards
change in demand
a change in demand due to a non price determinant leads to a shift in demand
8
New cards
normal good
a good that consumers prefer to purchase if their income allows it
9
New cards
inferior good
less desirable, cheaper good that consumers may purchase when incomes are low
10
New cards
non price determinants of demand
T- tastes and preferences
I- income
M- market size
E- future price expectations
R- related goods
I- income
M- market size
E- future price expectations
R- related goods
11
New cards
income (demand)
non price determinant of demand
when incomes goes up, demand for normal goods goes up and demand for inferior goods go down
when incomes goes up, demand for normal goods goes up and demand for inferior goods go down
12
New cards
future price expectations (demand)
non price determinant of demand
if consumers think that prices are going to go up in the future they will purchase now.
if consumers think that prices are going to go down in the future they will purchase later
if consumers think that prices are going to go up in the future they will purchase now.
if consumers think that prices are going to go down in the future they will purchase later
13
New cards
related goods (demand)
non price determinant of demand
if price of a complement goes down, demand for your good will go up.
if price of a substitute goes down, demand for your good will go down
if price of a complement goes down, demand for your good will go up.
if price of a substitute goes down, demand for your good will go down
14
New cards
complement
goods that are purchased and used together
15
New cards
substitutes
goods used in place of another good (not inferior)
16
New cards
market size (demand)
non price determinant of demand
if there is an increase in population or consumers then demand will go up.
if there is a decrease in population or consumers then demand will go down.
if there is an increase in population or consumers then demand will go up.
if there is a decrease in population or consumers then demand will go down.
17
New cards
tastes and preferences (demand)
non price determinant of demand
advertisements and influences can impact demand.
seasonal changes increase demand for some goods.
changes in population's age structure.
government policies can change demand.
advertisements and influences can impact demand.
seasonal changes increase demand for some goods.
changes in population's age structure.
government policies can change demand.
18
New cards
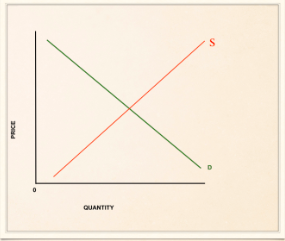
supply
the willingness and ability of producers to produce a good or service
19
New cards
law of supply
as prices go up, supply goes up.
as prices go down, supply goes down.
as prices go down, supply goes down.
20
New cards
supply curve
represents the costs to a firm producing the good or service
21
New cards
individual supply
the willingness and ability for one firm to produce a good or service
22
New cards
market supply
the willingness and ability for all firms within a market to produce a good or service
23
New cards
non price determinants of supply
S- subsidies (changes in costs of factors of production)
T- technology
O- other related goods
R- resource costs
E- expectations
S- size of market
T- technology
O- other related goods
R- resource costs
E- expectations
S- size of market
24
New cards
resource costs (supply)
non price determinant of supply
if costs go down then profits go up
if costs go up then profits go down
if costs go down then profits go up
if costs go up then profits go down
25
New cards
cost
price of the resources that firms use to make a good or service
26
New cards
factors of production
land, labor, capital, and entrepreneurship
27
New cards
price of related goods (supply)
non price determinant of supply
if price of a good with joint supply goes up, then supply will go down
if price of a good with competitive supply goes up, then supply will go down
if price of a good with joint supply goes up, then supply will go down
if price of a good with competitive supply goes up, then supply will go down
28
New cards
joint supply
when two or more goods are made from the same product
29
New cards
competitive supply
when the same producer can produce two or more different products
30
New cards
indirect taxes and subsidies (supply)
non price determinant of supply
indirect taxes raise costs of producer, causes supply to decrease
subsidies lower costs of producer, causes supply to increase
indirect taxes raise costs of producer, causes supply to decrease
subsidies lower costs of producer, causes supply to increase
31
New cards
indirect taxes
tax placed on the production of a good or service by the government
32
New cards
subsidies
payments by the government to a producer
33
New cards
future price expectations (supply)
non price determinant of supply
If suppliers think that prices will go up in the future, then they will reduce supply today
If suppliers think that prices will go down in the future, then they will increase supply today.
If suppliers think that prices will go up in the future, then they will reduce supply today
If suppliers think that prices will go down in the future, then they will increase supply today.
34
New cards
changes in technology (supply)
non price determinant of supply
if improved technology reduces the costs of producers, then supply will increase
if improved technology reduces the costs of producers, then supply will increase
35
New cards
number of firms (supply)
non price determinant of supply
if the number of firms producing a good or service decrease then supply will decrease
if the number of firms producing a good or service increase then supply will increase
if the number of firms producing a good or service decrease then supply will decrease
if the number of firms producing a good or service increase then supply will increase
36
New cards
change in quantity supplied
change in price leads to movement along the supply curve
37
New cards
change in supply
change in supply due to a non price determinant leads to a shift in supply
38
New cards
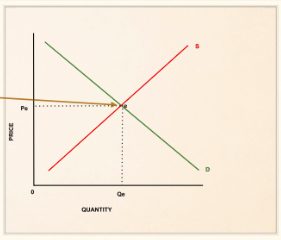
equilibrium
where supply meets demand, determines the quantity and price of a good, answers two of the basic economic questions of who gets the good or service and what is produced
39
New cards
equilibrium price
where quantity supplied is equal to quantity demanded, no surplus and no shortage
40
New cards
price rationing
free markets use prices to decide who gets the good or services
41
New cards
utility
satisfaction gained by consumers when they consume a good or service
42
New cards
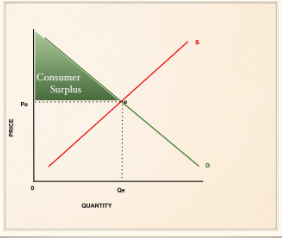
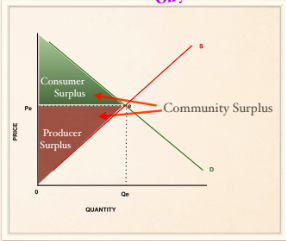
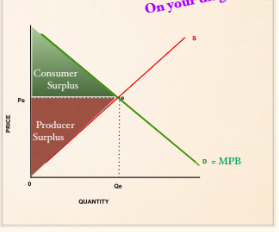
consumer surplus
extra utility gained by consumers when paying a price lower than they were willing to pay
43
New cards
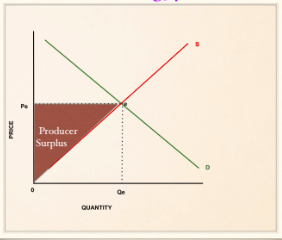
producer surplus
benefit producers receive when they receive a price above the one which they were willing to supply the good
44
New cards
community surplus
consumer surplus + producer surplus
45
New cards
marginal private benefit (MPB)
the utility consumers get when consuming one more unit of a good
d = mpb always
d = mpb always
46
New cards
marginal social benefit (MSB)
the total benefit to society from consuming one more unit of a good
d = msb IF the good or service doesn't harm or benefit a third party when consumed
d = msb IF the good or service doesn't harm or benefit a third party when consumed
47
New cards
marginal private cost (MPC)
the cost to a firm from producing one more unit of a good
s = mpc always
s = mpc always
48
New cards
marginal social cost
the cost to society of producing one more unit of a good
s = msc IF the production of the good or service doesn't harm or benefit society when produced then there is no further cost to society as a whole
s = msc IF the production of the good or service doesn't harm or benefit society when produced then there is no further cost to society as a whole
49
New cards
allocative efficiency
when the cost to society equals the benefit to society
MSC = MSB
resources are allocated in the most efficient way from societies POV
community surplus is maximized
the argument for a market economy
MSC = MSB
resources are allocated in the most efficient way from societies POV
community surplus is maximized
the argument for a market economy
50
New cards
arguments for a free market
allocative efficiency
freedom of choice
variety of goods
prices and wages are set by supply and demand
innovation
keeps prices low
freedom of choice
variety of goods
prices and wages are set by supply and demand
innovation
keeps prices low
51
New cards
signalling and incentive function
increase in price is the SIGNAL
chance to make greater profits is the INCENTIVE to increase supply
chance to make greater profits is the INCENTIVE to increase supply
52
New cards
reallocation in a free market
disequlibrium which leads to excess demand, leads consumers to pay a higher price for the good or service, suppliers see the increase in price and begin to increase supply which is the signalling and incentive function
movement along the supply curve as suppliers increase prices and supply, as price goes up, demand goes down, movement along a new demand curve until a new equlibrium is reached
movement along the supply curve as suppliers increase prices and supply, as price goes up, demand goes down, movement along a new demand curve until a new equlibrium is reached
53
New cards
assumptions underlying the demand curve
substitution effect
income effect
law of diminishing marginal utility
income effect
law of diminishing marginal utility
54
New cards
substitution effect
if price of a good goes down, consumers will switch from other substitute goods to this good because the price is comparatively lower
55
New cards
income effect
if prices go down, then our real income (income that is adjusted to price changes) has increased because we can buy more goods and services. we feel wealthier and tend to buy more of the same goods or services
56
New cards
law of diminishing marginal utility
as we consume additional units of something, the utility we derive from each unit decreases
57
New cards
assumptions underlying the supply curve
increasing marginal costs
law of diminishing marginal returns
law of diminishing marginal returns
58
New cards
increasing marginal costs
when increasing the output of a good or service marginal costs (the cost of producing one more good or service) will go down at first, and then go up because of the law of diminishing marginal returns
59
New cards
law of diminishing marginal returns
at first when you add labor the output per worker will go up, but if you keep hiring workers the ouput per worker will go down