Chapter 2-Central Tendency and Variability
1/9
There's no tags or description
Looks like no tags are added yet.
Name | Mastery | Learn | Test | Matching | Spaced |
|---|
No study sessions yet.
10 Terms
Central tendency
Typical or most representative value of a group of scores
Mean
Arithmetic average; sum of all the scores divided by the number of scores
Usually, the best method of measuring central tendency
Balancing point of a group of scores
Steps for calculating the mean
Add up all the scores: ΣX
Divide by the number of scores:ΣX/N
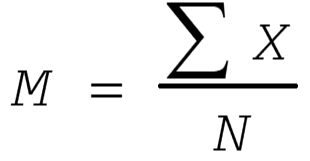
Formula for the mean (definitional)
M=ΣX/N

Mode
most common single number in a distribution; the most frequently occurring value
Best measure of central tendency for nominal variables
Median
The middle score, when all scores are arranged from lowest to highest
Best measure of central tendency for distributions that contain outliers (e.g., income, housing prices)
When describing a nominal variable, the best measure of central tendency to use is the:
Mode
Variance
The amount of spread of the scores around the mean; how spread out the scores are around the mean
The average of each score’s squared difference from the mean
Steps for computing the variance:
Subtract the mean from each score to get deviation scores: X-M
Square each of these deviation scores to get squared deviation scores:(X-M)2
Add up the squared deviation scores to get the sum of squared deviation scores (or sum of squares): Σ(X-M)2
Divide the sum of squared deviation scores by the number of scores to get variance: Σ(X-M)2/N
Formula for the variance (definitional):
SD2=Σ(X-M)2/N