BIO375 Midterm 2
1/77
Earn XP
Description and Tags
Name | Mastery | Learn | Test | Matching | Spaced | Call with Kai |
|---|
No analytics yet
Send a link to your students to track their progress
78 Terms
Mechanism
What cues and internal processes are the immediate cause of this expression of the behavior?
Development
What processes acted during the individual’s lifetime to cause the trait?
Evolutionary history
What sequence of events happened in ancestors leading to present day trait?
Function
What are the fitness consequences of the trait and why?
Conditions needed for selection
1. Variation in trait
2. Variation in biological fitness
3. A relationship between trait and fitness
Conditions needed for selection to lead to evolution
Heritability of the trait – the resemblance between parents and offspring due to genetics
Competition
Presence of another individual has a negative effect on success (fitness)
Exploitative competition
Another individual has detrimental effect, but only by using up a common resource
Ideal Free Distribution
Individuals will distribute among patches such that energy intake rate will be equal; that is, in proportion to the quality of the patches.
Energy intake rate (R)
Quality (Q)
R=Q(individual)/D(individual)
Assumes:
Free to move among patches (no barriers or major costs)
Full knowledge of resources and competitors in each patch
Equal competitors
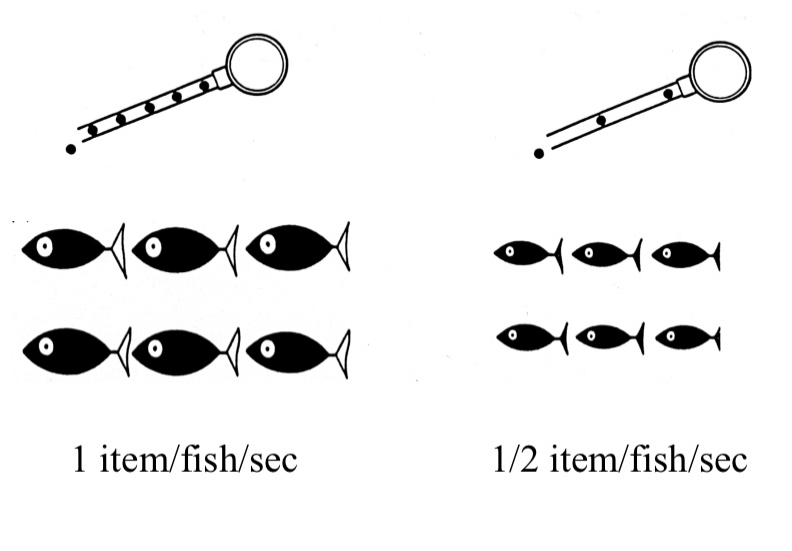
Example of ideal free distribution
Mallard Ducks
Bread crumbs of equal size were tossed at equal rates between two sites at the pond. The ducks were counted at each station, and were found to distribute themselves about 50/50 between both sites during this feeding cycle.
If bread crumbs were tossed 2x faster at one site (still same crumb size) the amount of ducks went down predictably at the poorer site until the rate of energy intake was equal in proportion to the patch.
If bread crumbs were tossed at equal rates but one site gains bigger bread crumbs this IDF model happens once again, but a little slower as the ducks figure out their surroundings.
How do they know where to go?
INTO MECHANISM WE GO
Mallards have a ‘rule of thumb’ to determine where to travel, matching throwing rate with number of ducks. The bread crumb size momentarily threw them off, but they adjusted.
Example of mechanism: MALLARD DUCKS
Mallards have a ‘rule of thumb’ to determine where to travel, matching throwing rate with number of ducks. The bread crumb size momentarily threw them off, but they adjusted.
Types of cues
Social cues – Discrete information (number of competitors)?
Sampling – Assess reward directly and sample patches?
Public information – Graded information (observe success of competitors)?
Example of mechanism: STICKLEBACK
Observer fish placed between two feeders; the control was given no food cues, so the fish stayed in the center (stickleback smells no food in the water).
Now there are six fish on one side and two fish on the other, with the observer fish in the middle. The fish seem to prefer to stick into a larger group based off of this control.
In the first exp. More food is provided to the group of 2 than the group of 6 on the other side. Where did the observer go? To the 2 fish.
Sticklebacks use public information to decide where to forage
‘Rule of thumb’
Animals can assess reward rate directly by observing competitors
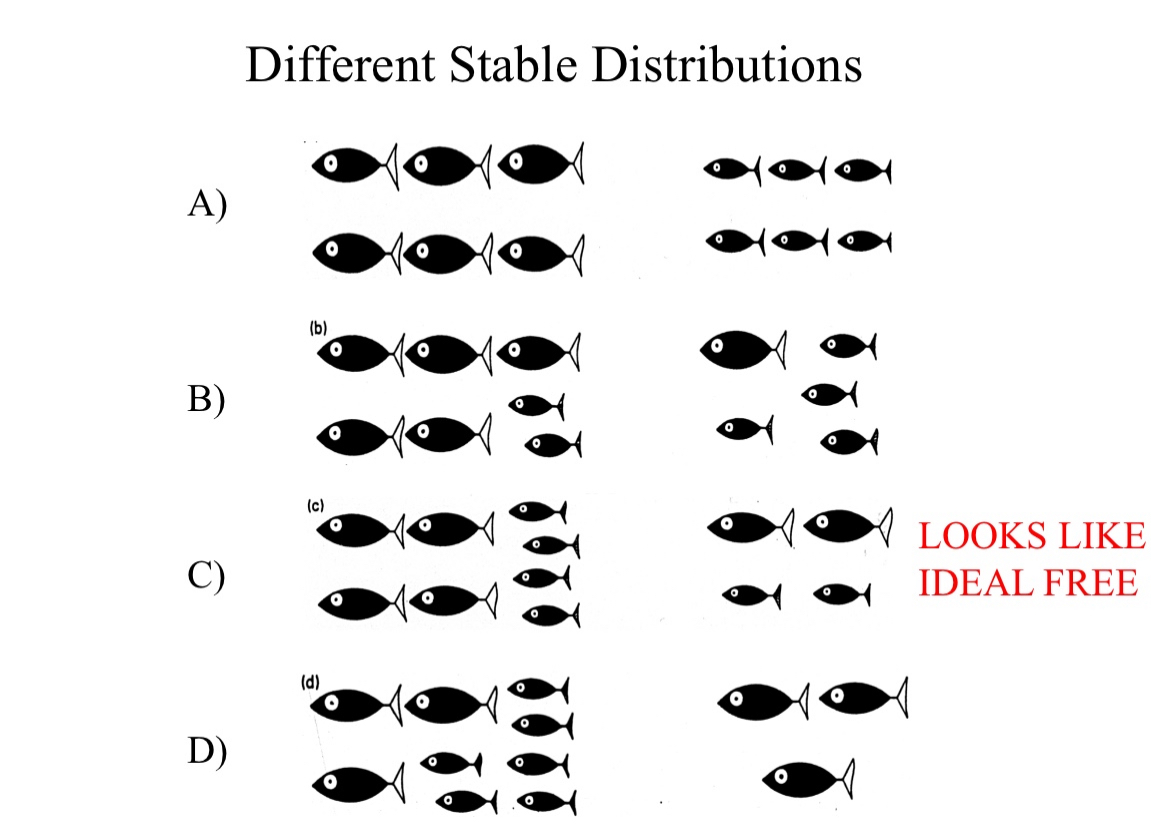
Unequal competitor model
Will only be ideal free if gain per individual is same in all patches
This distribution is stable but NOT ideal free
Just like the second image here, showing a distribution of large and small fish together – equal gains between patches, but not within patches
Stable and looks like IDF, but it is not!
Different stable strategy indeed
Example for unequal competitor model: STICKLEBACKS
Measured food intake of fish, identified better competitors
Tested a mixed school of competitors with two patches of different value
Result was most often that better competitors were in ideal free, and poor competitors in ideal free, producing an outcome matching the ideal free quite closely.
The poor and better competitors were in ideal free separate from one another, two separate stable systems. This created an overall stable strategy that closely resembles a normal ideal free situation.
Example for unequal competitor model: COHO SALMON
Measured “competitive weight”: food eaten by salmon in single patch in artificial stream
Gave salmon choice of two patches, manipulated food resources in patches
They assorted close to the IDF with unequal competitors model, poor and better competitors sorting separately, but then shifted to a new unique stable strategy.
The poorer competitors began to do better than the better ones. This suggests competitive ability changes during trial or from patch to patch.
The ideal free THOMPSONS GAZELLE: foraging dispersions
Thompson’s gazelle (Eudorcas thomsonii)
Forages on heterogeneous patches of grass
Forages in loose, diffuse herds
No aggression or dominance
If in IDF:
use of patches in a consistent proportion regardless of overall density
This occurred!
But at higher densities, poorer patches seemed to be favored. Why?
Predators! More visible in poorer patches – non-foraging gazelle went there
Foraging gazelles liked to be near the non-forgaing ones for predator detection
Interference competition
Impact on another’s fitness due to exclusion from resources
Coevolution
The evolutionary change that occurs when selection on traits in a focal organism is caused by the traits of another organism and vice-versa.
Conflicting demands
When an activity simultaneously increases one component of fitness but decreases another
OR
When limited resources (e.g., time, energy) must be allocated to two or more fitness-enhancing traits
Fitness proxy example
W=SxF
S = probability of survival
F = fecundity (reproduction)
W = total fitness
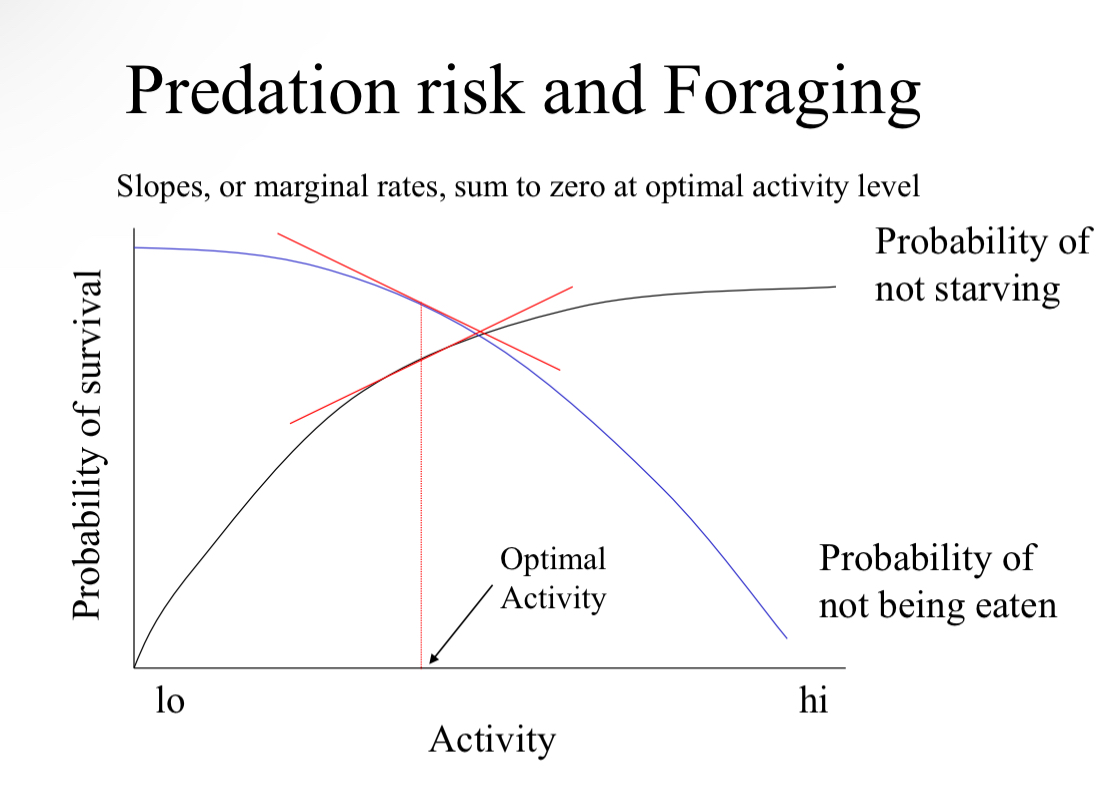
Probability of not starving and probability of not being eaten both increase S
S = 1 - [Pr(starvation) + Pr(predation)]
Predation risk and foraging
Optimal activity is determined when the slops sum to zero
Balance of probability of starving and being eaten
Optimal activity level will shift with the density of food and predators
Example of predation risk versus foraging: EGYPTIAN GERBIL
Must balance between being food and eating food
SLOPE of probabilities important
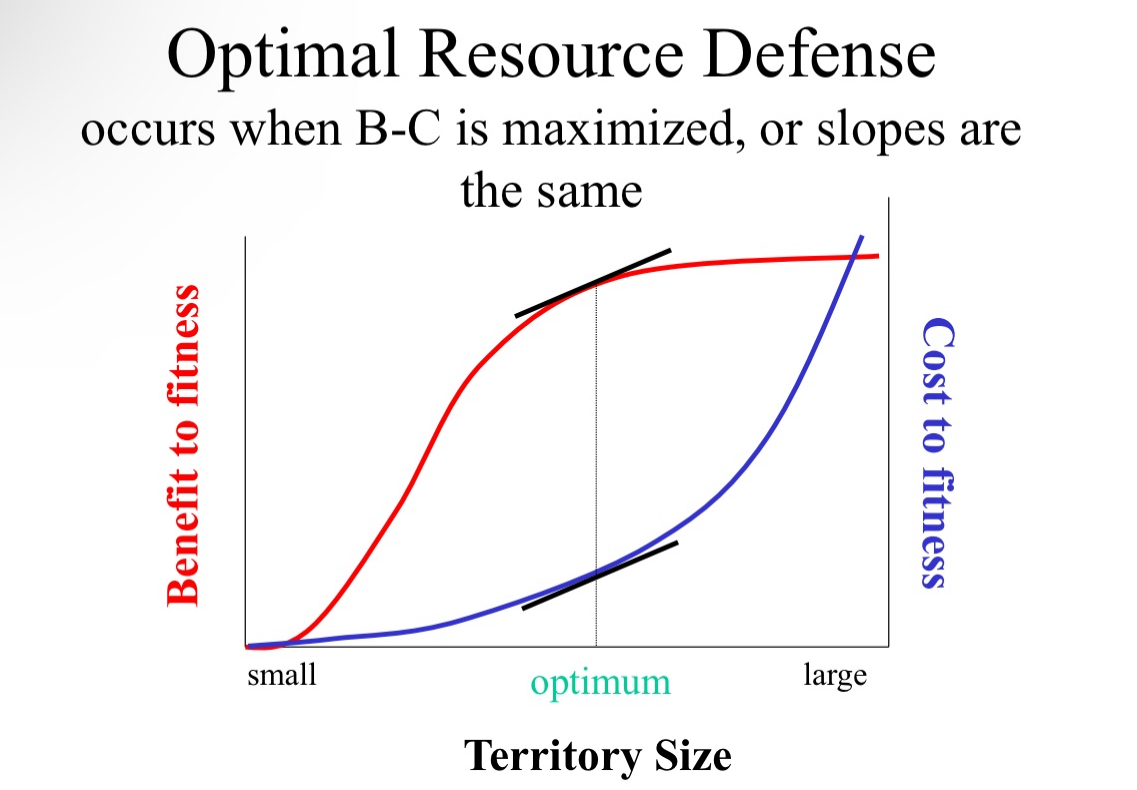
Optimal resource defense
Defending a resource is both beneficial and costly.
– Benefits
• More resources (increase survival or reproduction)
• More mates (increase reproduction)
– Costs
• Energy expended
• Risk of injury
We should expect stabilizing selection: optimal territorial defense
Stabilizing selection will occur
Example for optimal territory defense: SANDERLINGS
Variation in size of area defended
Variation in amount of food and number of intruders
If there is higher food there is a steeper benefit curve
This translates to a smaller patch of territory being more optimal to defend
Less length to travel for more prey, no need to protect that extra land at the cost of possible injury
Therefore, territory should decrease when food supply increases
Negative benefit cycle
If food supply decrease they would need to increase their territory to find such food
This was supported, sanderlings in good areas have smaller territories – there are also a lot more intruders though!
How do territories respond to more intruders?
An increase cost of defense is experienced with more intruders
This would mean a shift towards smaller territory once again
Sanderlings would keep smaller territories when there are more intruders as well
So these sanderlings in better areas have smaller areas due both to an increase of food supply and an increase in intruders.
This study also found that intruder pressure is more important to sanderlings, and they will decrease their territory for this even when there is not necessarily more food to eat in their smaller patch.
If there are no intruders, even if the prey density does not decrease, sanderlings will increase their territory size as well.
Example for optimal territory defense: CONVICT CICHLIDS
Measured the consequences of territorial behavior in the lab; found that benefits of larger territory had a diminishing returns curve
The number of intruders also increase with larger territory
Once again, intermediate size maximized growth
Stabilizing selection is a girls best friend truly
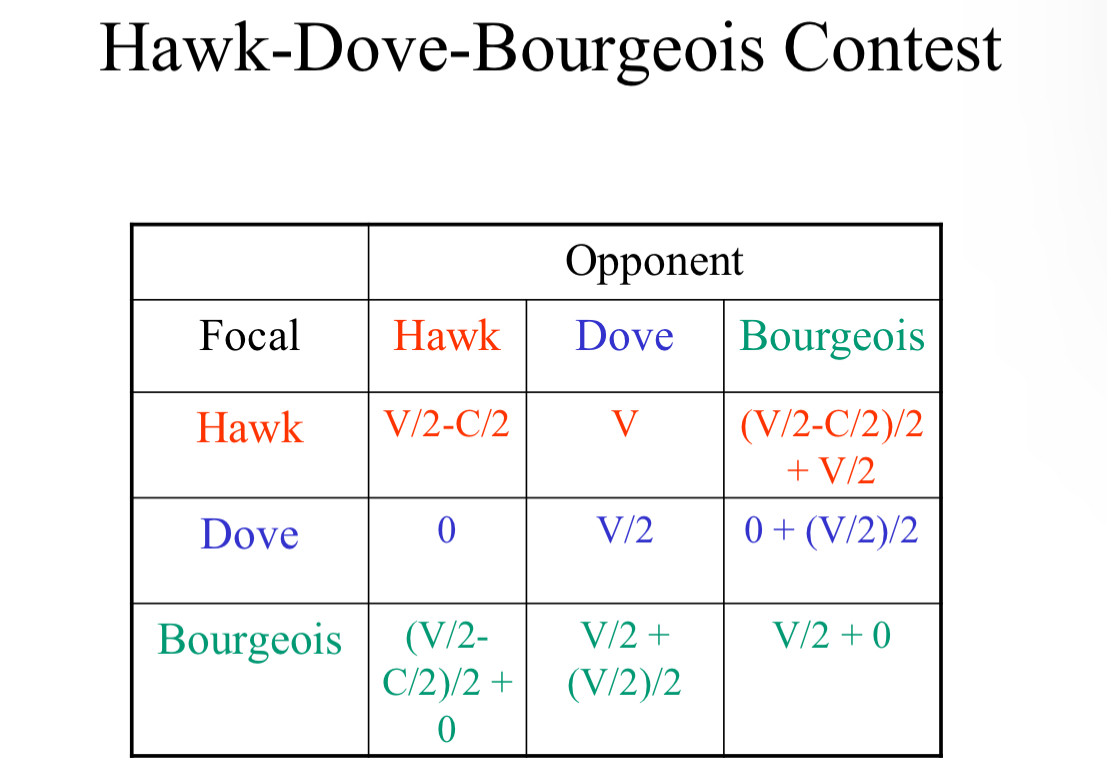
G A M E T H E O R Y [Hawk–Dove Game]
Evolutionarily Stable Strategy: A behavior that has higher fitness than any other and so cannot be invaded by another behavior,
or
the stable mix of behaviors where no particular type can do better than the other.
Let us consider two behavioral types:
The HAWK: aggressive, will fight opponent if also aggressive
The DOVE: not aggressive, will run away if opponent is aggressive
HAWK always wins against DOVE, no injury to either
HAWK beats HAWK 50% of the time, risk of injury if loses
DOVE beats DOVE 50% of the time, pay some cost of display
Assumptions
– Everyone within a strategy is equal
– No one knows what opponent will do
– Strategies are fixed (genetic)
Fitness variables
V = Resource gained by winner
C = Cost of injury to loser if there is a fight
For HAWKvHAWK:
Each hawk will have: V/2-C/2
The resource gained and cost is divided by two because of the inherent interaction between two animals, and also the 50% chance of losing
For HAWKvDOVE:
The dove will have: 0
The hawk will have: V
The dove will always flee, gaining and losing nothing
The hawk will always win, with full resource gained
For DOVEvDOVE
There is no inherent cost so;
Doves will both have: V/2
The resource gained is cut in half due to the 50% chance of losing between the two birds as well
Hawk is better against Hawk than Dove is if C < V
[for my math illiterate homies: if cost is less than resource gained]
Dove is better against Hawk than Hawk is if C > V
[if the cost is greater than the resource gained]
Hawk is better against Dove than Dove is if V > 0.
[if the resource gained is greater than 0]
Hawk is the evolutionary stable strategy if resources gained is greater than the cost associated
Dove, though, is NEVER an evolutionary stable strategy [sorry dove]
This is an example of FIXED strategy: one response every time (genetic)
And Pure ESS: all one type in population
![<p>Evolutionarily Stable Strategy: A behavior that has higher fitness than any other and so cannot be invaded by another behavior,</p><p>or</p><p>the stable mix of behaviors where no particular type can do better than the other.</p><p>Let us consider two behavioral types:</p><p>The HAWK: aggressive, will fight opponent if also aggressive</p><p>The DOVE: not aggressive, will run away if opponent is aggressive</p><p>HAWK always wins against DOVE, no injury to either</p><p>HAWK beats HAWK 50% of the time, risk of injury if loses</p><p>DOVE beats DOVE 50% of the time, pay some cost of display</p><p>Assumptions</p><p>– Everyone within a strategy is equal</p><p>– No one knows what opponent will do</p><p>– Strategies are fixed (genetic)</p><p>Fitness variables</p><p>V = Resource gained by winner</p><p>C = Cost of injury to loser if there is a fight</p><p>For HAWKvHAWK:</p><p>Each hawk will have: V/2-C/2</p><p>The resource gained and cost is divided by two because of the inherent interaction between two animals, and also the 50% chance of losing</p><p>For HAWKvDOVE:</p><p>The dove will have: 0</p><p>The hawk will have: V</p><p>The dove will always flee, gaining and losing nothing</p><p>The hawk will always win, with full resource gained</p><p>For DOVEvDOVE</p><p>There is no inherent cost so;</p><p>Doves will both have: V/2</p><p>The resource gained is cut in half due to the 50% chance of losing between the two birds as well</p><p>Hawk is better against Hawk than Dove is if C < V</p><p>[for my math illiterate homies: if cost is less than resource gained]</p><p>Dove is better against Hawk than Hawk is if C > V</p><p>[if the cost is greater than the resource gained]</p><p>Hawk is better against Dove than Dove is if V > 0.</p><p>[if the resource gained is greater than 0]</p><p>Hawk is the evolutionary stable strategy if resources gained is greater than the cost associated</p><p>Dove, though, is NEVER an evolutionary stable strategy [sorry dove]</p><p>This is an example of FIXED strategy: one response every time (genetic)</p><p>And Pure ESS: all one type in population</p>](https://knowt-user-attachments.s3.amazonaws.com/ecbce0c4-3588-4ae7-82e0-45982796cc00.jpg)
Negative Frequency Dependent Selection
Relative fitness depends negatively on frequency of that strategy.
HAWKvDOVE when stable strategy is two equal strategy’s instead of one over the other
H = hawk
1 - H = dove
H(V-C)/2 + (1-H)V = (1-H)(V/2) + (H)0
The first part of the equation is fitness of hawks, and the second part is the fitness of the doves
‘H(V-C)/2’ is fitness of HAWKvHAWK
‘(1-H)V’ is fitness of HAWKvDOVES
‘(1-H)(V/2)’ is fitness of DOVESvDOVES
‘(H)0’ is fitness of DOVESvHAWKS
This equation produces a mixed ESS
Stable polymorphism of fixed strategies
Fixed Strategy
Genetic
Pure ESS
All one type in population
Mixed ESS
Stable polymorphism
Stochastic Mixed Strategy
Exhibit one of 2+ tactics with given probability
Resident wins phenomena?
In competition the resident of the territory typically wins as they have more to lose – they are aware of the wealth of resources and will fight harder to keep them
GAME THEORY H+D ADDED: BOURGEOIS
Hawk when resident, dove when intruder
What if population is all hawk?
Both bourgeois and dove invade!
What if population is all dove?
Both hawk bourgeois invade!
What if population is bourgeois?
Nothing can invade, so bourgeois is ESS!
Conditional Mixed Strategy
If condition A, then do tactic “Y”, otherwise do tactic “X”
Example: if owner plays hawk, the intruder plays dove
VALUE RESOURCE HYPOTHESIS; resident always wins example: REDWING BLACKBIRD
Removed territory owner, let replacement take over, then released owner back on territory a variable amount of time later, observed outcome
If bourgeois the replacement should always win
If the original owner has higher RHP, then they should always win
If there is value asymmetry, then the original owner should win after very short delay, but as the time away from their home increases the replacement should start to win
This is what happened!
The owner that was removed for only 1-4 days [with a new bird moving in and living there for those 1-4 days] always took back their territory, but the owner than had been removed from the territory for 6-7 days [and the new bird living there for those 6-7 days] did not. After so many days the new bird finds value in the territory, and the previous owner not as much as they had been away too long.
A third treatment was then utilized to strengthen the test!
The owners are removed for 8-10 days, but two different replacements are there over that span of time. The first replacement is left there in the territory for 6-7 days, then removed. A new bird moves in for 2-3 days after.
The owners once again reclaimed their nests! The newest residents hadn’t had long enough to value the territory they were in, and the owners [even though they had been away a great amount of time] still won.
This supports value resource hypothesis!
RHP
Resource holding power
Alternative types of assessment
Self assessment:
Contestants know how long they will fight, but don’t know opponent
Duration of fight thus depends only on loser’s RHP.
Sequential [mutual] assessment
Each contestant acts like “Dove” at first and displays, goal to assess RHP of rival (mutual assessment)
Contests escalate in intensity [become more hawk-like] until a difference in RHP is detected
Predictions:
i. Contest duration negatively related to difference in RHP
ii. Intensity of fight is negatively related to difference in RHP
mutual assessment example: FIDDLER CRAB FIGHTS
Burrows in sand are highly valued in fiddler crabs – for protection and attracting mates
Males defend them from intruders
In this exp. They staged fights and measured the factors that influence their duration
Duration of fight = DOF
DOF is negatively associated to ratio of claw sizes, which suggests mutual assessment
If there is bigger disparity between the winner and losers claw size, or a bigger difference, the fight will be shorter
Example for mutual assessment: MANTIS SHRIMP
They defend their burrows from others
Use their hard claw to fight
Size/strength is important to winning, fights can lead to serious injury
They first display their tail and claw before fighting
Shrimps molt every month, so there is 2-3 days where they are vulnerable and will not win or withstand a fight no matter their size
What should they do?
They still threaten!
Molting shrimp ‘bluff’ to their opponents and still show their tails, despite not being able to fight
They are more likely to display if the intruder is slightly smaller than if it is larger
As the intruder gets bigger than them they are more likely to flee, and smaller they are more likely to bluff
Individuals who have experienced a bluffer do not alter their behavior to molting shrimp
Why not?
They don’t know if another shrimp is molting or not!
They cannot assume whether or not a Shrimp is molting before the fight
Better to lose to a bluffer than get serious injury to a bigger nonbluffing shrimp
Imput matching rule
animals should distribute themselves across different patches of resources in a way where the ratio of individuals in each patch directly matches the ratio of the resource input rate in that patch
Explotative competetion
Individuals indirectly decreasing resources from one another in a patch due to limit of resources in that area.
Interference competition
When an individual directly prevents another from accessing resources
Communication
Transfer of information from signaler to receiver (trait in one animal modifies the behavior of another).
Signaler
Manipulate receiver [dishonesty]
Receiver
Avoid manipulation [enforce honesty]
Mutualism
Signaler and receiver both benefit from the transfer of information
COMMUNICATION EXAMPLE: VERVETS
Live in groups of 10-50, and use a variety of vocalizations
Different types of calls:
Predator alarm calls [snake call, eagle call, leopard call]; given when a predator is seen
Different behaviors associated with these three calls to avoid predation
These calls benefit both the signaler and receiver; mutualism in predator calls
There are also three calls [grunt, chutter, wrr] given to alert that another group is approaching, causing others to look at the caller and then scan in direction the caller is looking at
Deception:
A low ranking male has been seen to give leopard predator call when a group is approaching to avoid interaction with that group
Calls are used inappropriately about 2% of the time
The exp.!
They played back intergroup calls of a specific monkey in the group whenever there was no other group around to observe their response
The group learned this individual call and grew to ignore it
They also ignored all other group calls of that same individual
They responded to another individuals calls just fine, though
The call itself is not the issue, it is that they no longer believe the individual
They can distinguish between individuals calls and ignore those who ‘cry wolf’ often
Predator calls are ALWAYS responded to, though, no matter how many false ones
It would be too costly to ignore a predator call if it were to be true!
Mutualistic communication example: HONEYBEES
Waggle dance
They are not in competition, and foraging efficiency increases when there is effective recruitment to good food sources
They need to:
Get other bees to go to source
Get other bees to efficiently find source
Waggle dance!
Communicates direction and distance
Strong relationship between angle of waggle dance from vertical and direction of food
Outside of the hive the dance is oriented relative to the light
Distance is encoded into the dance
How do we know receivers understand?
Provided rich sugar solution with odor at a foraging station.
Foragers coming to station had eyes painted over, could still orient to sun in middle of day
In hive, had adjustable light bright enough to overwhelm orientation to gravity in normal bees, but not painted bees.
Progressively shifted the angle of the light
Counted the number of bees coming to stations with same type of sugar water and odor
-if bees use orders the angle of light will make no difference
-if bees use information in dance, because foragers are misdirecting dance relative to recruits when light is at an angle they will miss the food at the specific angle of the light
Result? Recruits ended up at the predicted angle of the misdirected waggle dance!
Controls with unpainted eyes kept the bees going to the right station
Bees do have a symbolic language and use this to mutually transfer beneficial information to others!
GAME THEORY: COMMUNICATION [mutualism]
Honest vs. Deceptive signal when pertaining to Gullible vs. Skeptical organisms
This is what occurs for mutualism!
Honest signals always receive benefit from a gullible individual
Honest signal signalers receive no gain from a skeptical individual, and a skeptical individual loses when rejecting an honest signal
Deceptive signal is a lose-lose situation on a gullible individual when it pertains to mutualism
Deceptive signalers lose and skeptical receivers gain in an interaction between the two.
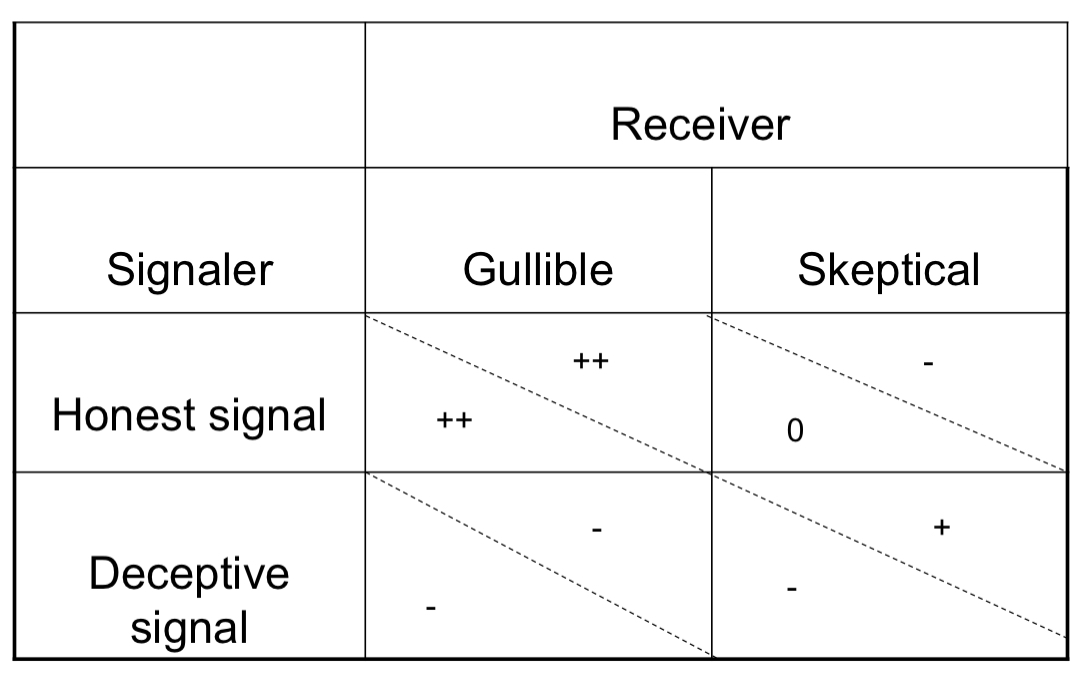
GAME THEORY: COMMUNICATION [conflict]
Honest vs. Deceptive signal when pertaining to Gullible vs. Skeptical organisms
This is what occurs for conflict!
Honest signals always receive benefit from a gullible individual
Honest signal signalers receive no gain from a skeptical individual, and a skeptical individual loses when rejecting an honest signal
Deceptive signalers receive a big gain over gullible receivers [who lose]
Deceptive signalers lose and skeptical receivers gain in an interaction between the two.
![<p>Honest vs. Deceptive signal when pertaining to Gullible vs. Skeptical organisms</p><p>This is what occurs for conflict!</p><p>Honest signals always receive benefit from a gullible individual</p><p>Honest signal signalers receive no gain from a skeptical individual, and a skeptical individual loses when rejecting an honest signal</p><p>Deceptive signalers receive a big gain over gullible receivers [who lose]</p><p>Deceptive signalers lose and skeptical receivers gain in an interaction between the two.</p>](https://knowt-user-attachments.s3.amazonaws.com/1358b449-4ee8-4f8f-ac98-e136f7b2078b.jpg)
Conflict
Favored trait in one individual is costly to another
Conflict gradient
creates additional variation in fitness in receivers
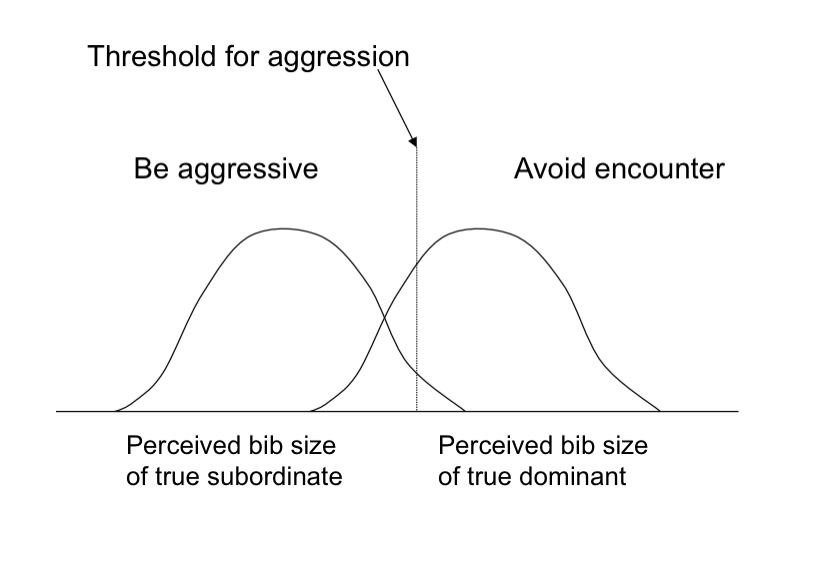
Conflict example: SISKIN
Siskins must decide whether to approach resource defended by another Siskin
Black throat patch provides info. On opponents relative status
The consequence of errors may influence both the response of the Siskin and the utility of the signal
Sources of error in discrimination
Relationship between signal and ability
Receiver’s estimate of patch size
Types of error (Should siskin ATTACK?)
False negative (Opponent’s actual ability is worse than perceived, so siskin avoids a fight it could have won)
False positive (Opponent’s actual ability is better than perceived, so siskin gets into a losing fight)
Types of error (Should siskin DEFER?)
False negative (Actual ability is better than perceived, so siskin gets into a losing fight)
False positive (Actual ability is worse than perceived, so siskin avoids an encounter it would have won)
Receiver cannot simultaneously minimize both types of error given same constraints on perceiving signal
Errors in discrimination
Sources of variance
Relationship between signal and ability
Receiver’s estimate of trait
Error types in discrimination
False positive and false negative
What these are depend on the trait and relative question
For example
Should A fight?
False P: underestimated opponent, A is beaten to a pulp
False N: overestimated opponent, A avoided fighting a wimp
Conflict example: BROWN HEADED COWBIRDS
Why dont parents discriminated against cowbirds?
Let’s think of the consequences of errors in discrimination!
What if the phenotypic appearance of the cowbird egg is very similar to that of their own
Could they risk a false positive, kicking their own babies out of their nest, over the false negative, raising a cowbird?
Rejectors tend to have eggs very different from cowbirds
Acceptors tend to have eggs very similar to cowbirds!
Coevolutionary arms race example: EUROPEAN CUCKOO BIRD
This bird adapts their parasitic eggs to the host eggs to cause it to be too costly to kick their eggs out of the nest!
The eggs just look too similar, the false positive chance is too high, and they raise the parasite hatchlings.
Cost of signaling example: FRUIT FLIES
Even though signaling can help reproductive success, there can also be a cost associated
Male fruit flies congregate and compete for female mates in group
Release pheromone streaks while displaying
Better quality males release more pheromone
Exposing males to other males resulted in more pheromone production and shorter lifespan in comparison to solitary males or those exposed only to females
Cost of signaling example: Tungara Frog
Males give two different songs: “Tun,” and “Tun chuck”
Females prefer “Tun chuck,” but so do predators!
Bats hear this call better
Males
Producers of many small, mobile gametes
(small, numerous gametes) are most often limited by the number of female gametes (and females) encountered (selection favors increasing the number of zygotes fertilized)
Females
Producers of a few large, immobile gametes
(small number of large gametes) are most often limited by the total resources they can devote to gametes and to their size (selection favors increasing zygote survival).
Anisogamy
Dimorphism in gamete size
Isogamy
No dimorphism in gamete size
Gamete size equation
R =. Resources to devote to gametes
X = gamete amount
R/X = gamete size
If R/X is large = X must be small
If R/X is small = X must be large
This is a fundamental conflicting demand between size and number.
Gamete Size a trade-off between benefits of producing more offspring (with smaller gametes) and benefits of producing better offspring (bigger gametes)
Selection favors both smaller and larger gametes, but it is much stronger on small gamete-producers than on large.
Disruptive selection!
Small gamete producers favored because they contribute to more zygotes
Large gamete producers favored because their zygotes survive better
This is how we arrive to anisogamy!
Polymorphism in gamete size
As small gamete-producers make more, even smaller gametes, this is costly to large gamete-producers but creates selection among them favoring even larger gametes
Disruptive selection
Traits selected are both of the extremes
Visually the graph goes from an ‘n’ shape parabola to a system of two humps as the extreme traits are separated and select for, and the intermediate is selected against.
Looks kinda like an ‘m’
Evolutionary Conflict
When a beneficial trait in one organism has a detrimental effect on another
Examples:
Predator/prey
Fighting
Antagonistic communication
Anisogamy
Obligate anisogamy
Why don’t large gametes fuse with other large gametes?
THINK LIKE GAME THEORY
When a preference like this first arises, it will be rare:
1. Big gametes with preference will have trouble finding other big gametes with a preference
2. Because of the numbers of small gametes around, most big gametes will be fertilized already
3. Like fusing with like will lead to inbreeding—reduces genetic variation which reduces the advantage of sex.
SEXUAL SELECTION
The relationship between a trait and mating success [a component of total fitness]
We need
Variation in trait
Variation in mating success [a specific component of fitness having to do with the number of zygotes produced]
Relationship between the two
Evolution vis SS occurs when the trait is HERITABLE
Variance
sum of the squared deviations from the mean (Σd2) divided by the number of observations (n)
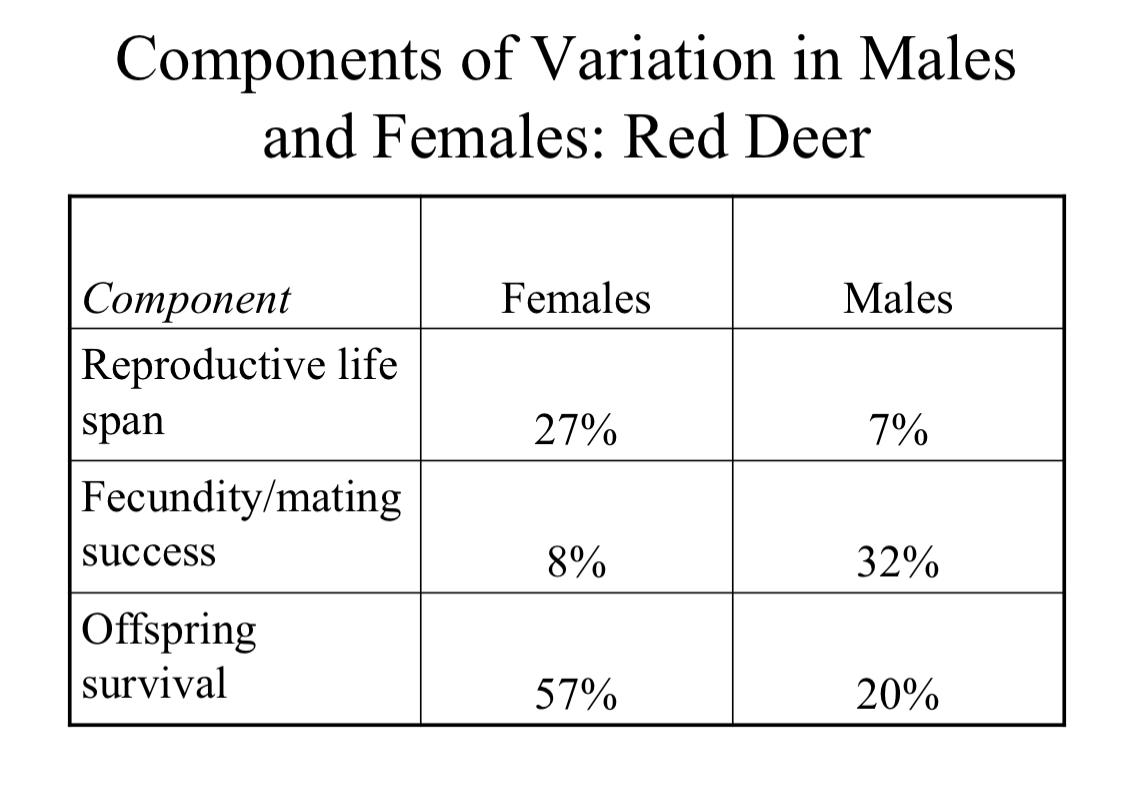
Variation in males and females example: RED DEER
High variance in mating success means many males do not get matings. Identical to many males dying.
Force of sexual selection affects morphology, behavior, and rate of speciation.
Intrasexual Selection
Male-male competition
Intersexual Selection
Female choice
fitness proxies
measure of fitness that meets 3 criteria
1 – must be linked to goal
2 – have a reasonable link to true fitness
3 – be reasonably easy to measure
Fitness
Lifetime production of offspring
Sperm competition
a process where sperm from different males compete to fertilize a female's eggs