Unit 2 Stats
1/19
There's no tags or description
Looks like no tags are added yet.
Name | Mastery | Learn | Test | Matching | Spaced |
|---|
No study sessions yet.
20 Terms
median
The median is the middle value in a data set when the values are arranged in ascending or descending order. If there is an even number of observations, the median is the average of the two middle values. Median is best for data that includes outliers,
mode
Data entry that has the highest frequency. Best central tendency for qualitative data. The tallest bar on a histogram
mean
Avg. value = sum of all data entries ÷ number of entries. Best used for quantitative data with no outliers
symmetric distribution
When the median of a data set is equal to the mode, and the data looks symmetrical on a histogram
uniform distribution
when every data point is the same and there is no mode
skewed left
Long “tail” on the left. Mean < median. Bars further from the x-axis are longer
skewed right
Long “tail” on the right. Mean > median. Bars closer to the x-axis are longer
range
max value - minus value
deviation
each data point value - mean. sum of deviations is always zero
negative deviation
the deviation is less than zero
positive deviation
the deviation is greater than zero
average deviation
sum of deviation ÷ amount of data points. always equals zero
deviation squared
square each deviation, divide sum of deviation by amount of data points,
interval estimate
mean - deviation squared # = lower limit
mean + deviation squared # = upper limit
variance
average deviation
standard deviation
square root of avg. deviation or avg. deviation
population mean
the greek letter µ (mu) is used to represent the:
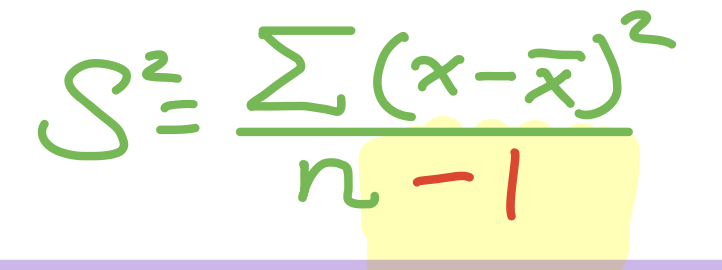
sample variance
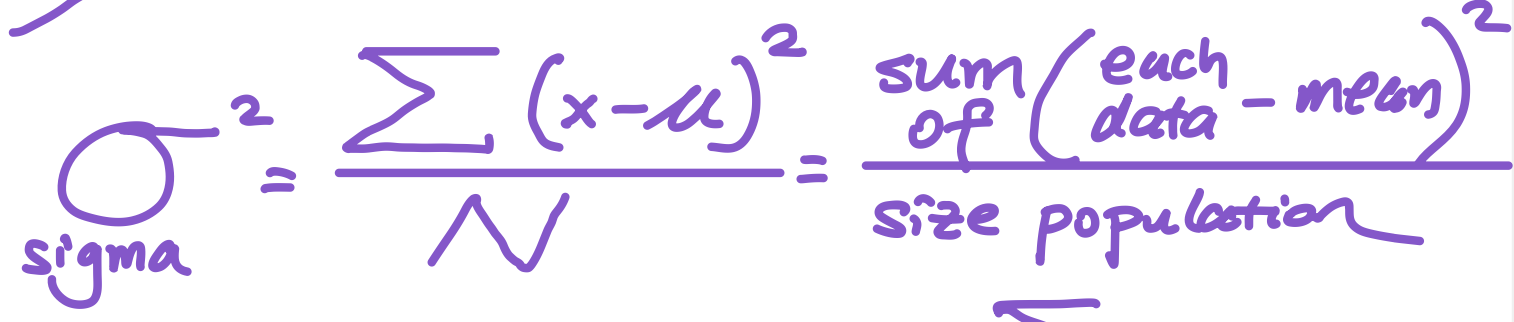
population variance
sample mean
x̄