Biostatistics Midterm
1/66
There's no tags or description
Looks like no tags are added yet.
Name | Mastery | Learn | Test | Matching | Spaced |
|---|
No study sessions yet.
67 Terms
tidyverse
coherent system of packages for data manipulation, exploration, and visualization that share a common design philosophy
The probability of event A is
P(A)
A probability can range from
0 to 1
P(A) can be estimated by
m/n
n is number of trials or experiments
m is the number of times A occurs
As n increases
m/n approaches P(A)
Probability
frequency of occurrence of an event
Calculating probability
Numerator: How many times does the event occur
Denominator: how many times could the event occur
numerator and denominator for a probability of some characteristic
numerator: number of people with that characteristic
denominator: total number of people in the populatio
The complement of event A is
anything that is NOT
P(A^c)
1-P(A)
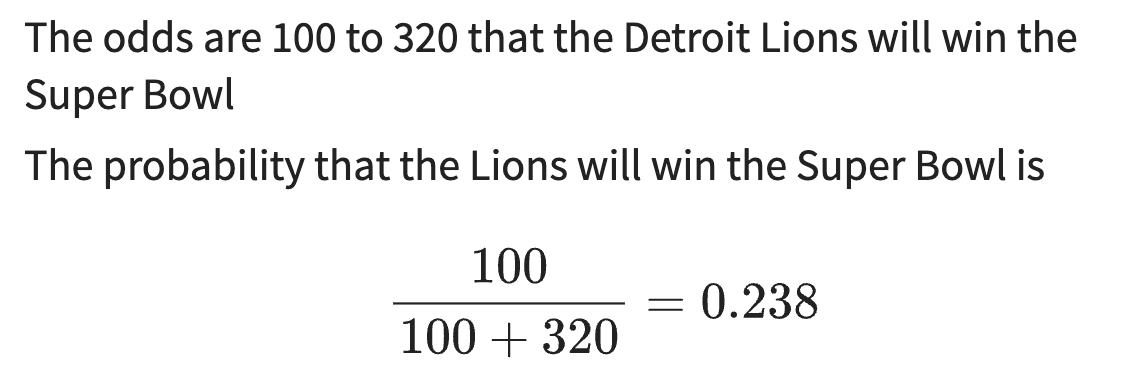
Odds
P(A)/P(A^c)
Odds to probability
Joint probability
probability that two separate events both occur
Calculating joint probability
numerator: how many times do both events occur
denominator: how many times could both events occur?
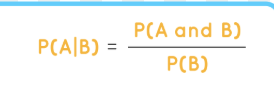
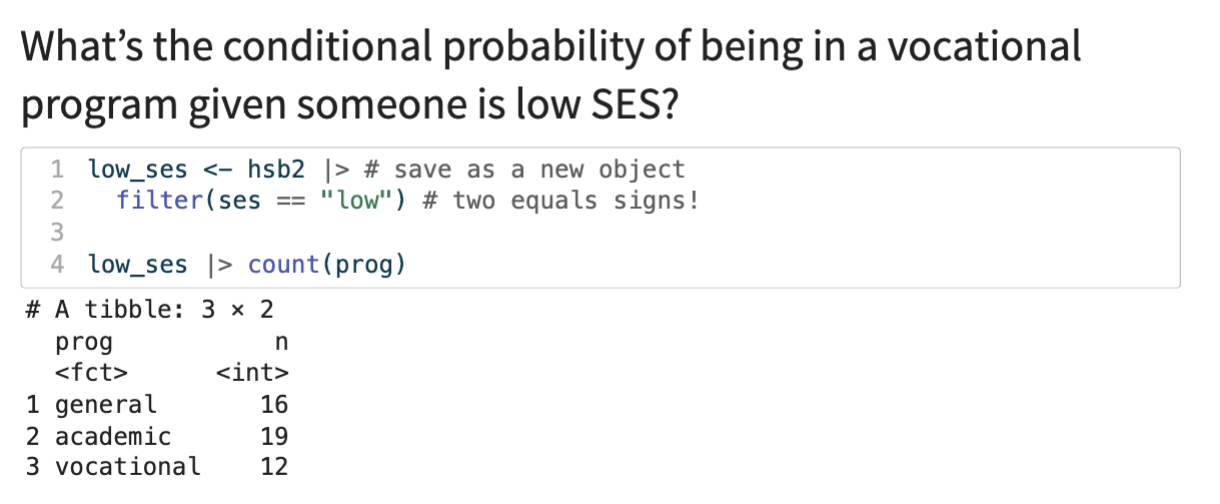
Calculating conditional probability
restrict the sample size to only include those individuals, THEN calculate the probability
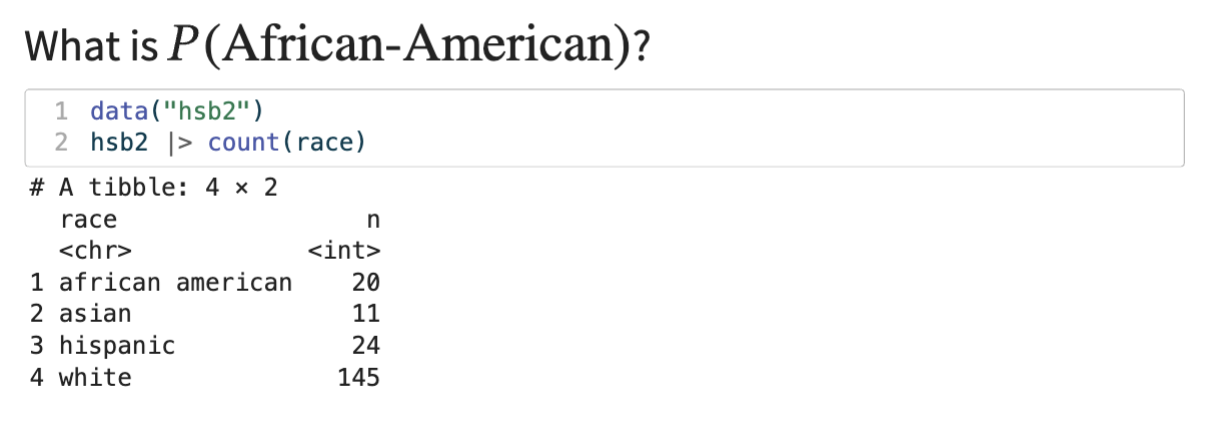
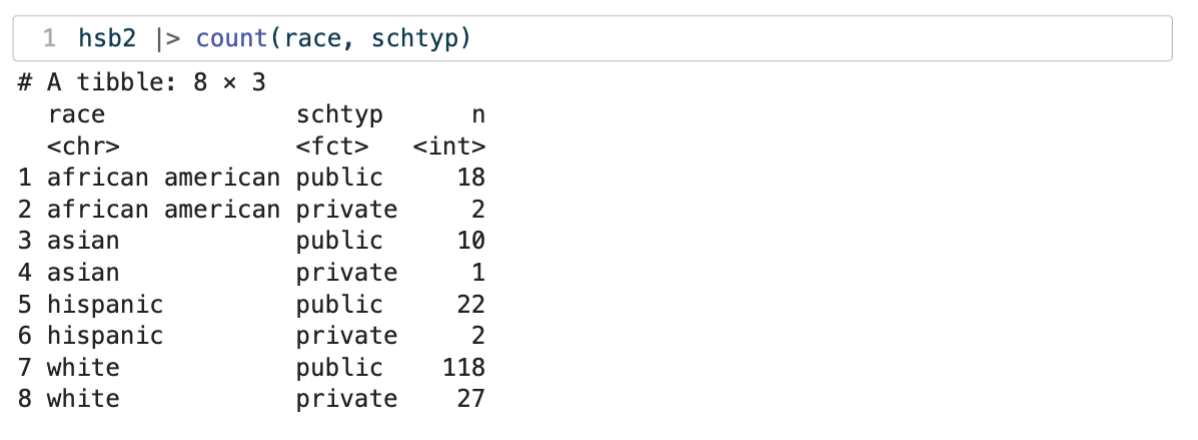
count()
used to tally up the number of observations per level of a variable
count() and joint probabilities
we cant count() by two variables to get the numbers for a table to calculate joint probabilities
filter()
to get the subset of data we want to condition on
Conditional probability in R
Prevalence
probability of having disease
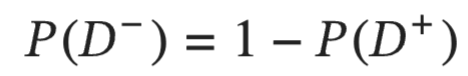
complement of the prevalence
the probability of NOT having disease
Sensitivity
conditional probability of testing positive given they have the disease
Specificity
conditional probability of testing negative given they do not have the disease
false negative
given a person truly has disease, what is the probability that they test negative?
false positive
given a person truly does not have disease, what is the probability that they test positive?
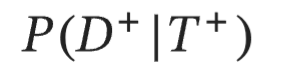
Positive Predictive Value (PPV)
if you test positive, what is the probability you actually have the disease
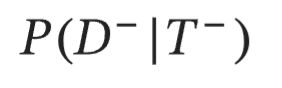
Negative Predictive Value (NPV)
if you test negative, what it the probability that you actually do not have the disease
mean
the average
median
the middle value (50th percentile)
Mode
the most frequent value
na.rm = TRUE
tells R to ignore missing values
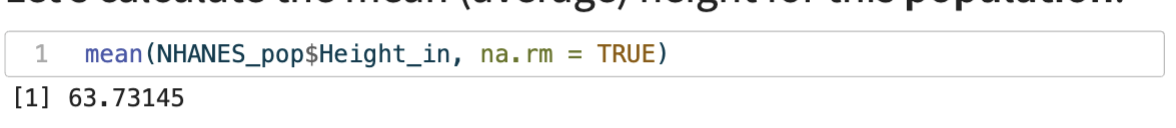
calculating mean in R example
Range
the difference between the largest and smallest values
Variance
the average squared-distance each observation is from the mean
standard deviation
measure of how spread out or dispersed the values in a data set are from the mean
standard deviation in R example

parameter
measurement describing the entire population
simple random sample
every member of the population has the same chance of being selected or sampled
Stratified sample
split the population into strata where observations within each strata look similar, then sample from each strata
cluster sample
split the population into similar clusters full of different looking observations
sample_n()
draws a random sample of size
replace = FALSE
once an observation is selected, it can not be selected again
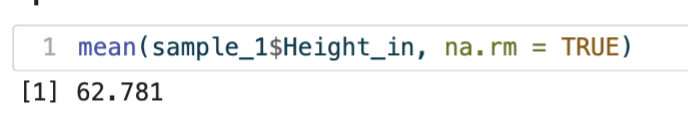
simple random sample example in R

example of mean in in R
Random variable
an observation that has a single numerical value that is determined by chance, as the outcome
probability distribution
gives the probability of observing any possible value of a random variable
Discrete distributions
a probability distribution that assigns probabilities to a set of distinct, separate, and countable outcomes of a random variable
ex. number of pets in a household
population proportion
true fraction of individuals in an entire population that share a specific characteristic
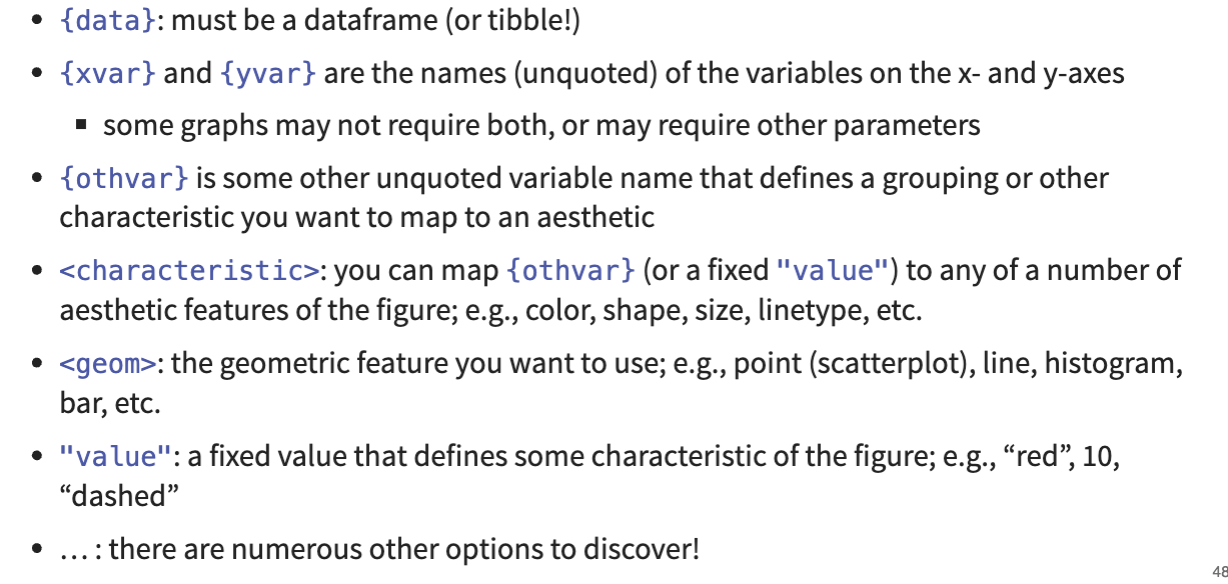
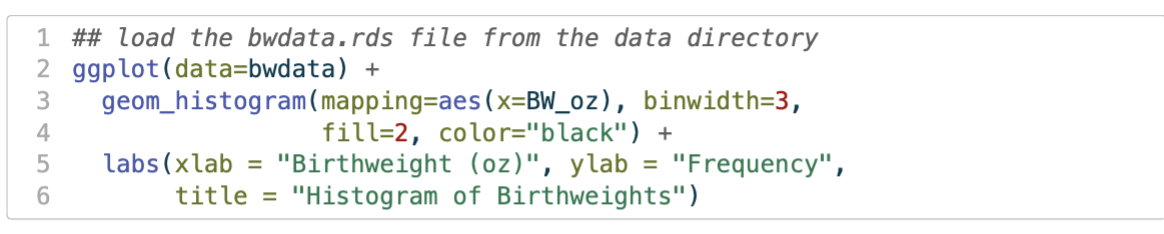
basic structure of ggplot


what are all the variables
Continuous Random Variables
can take on any value within a range
ex. annual radiation exposure level of an x-ray technician
continuous random variable in R
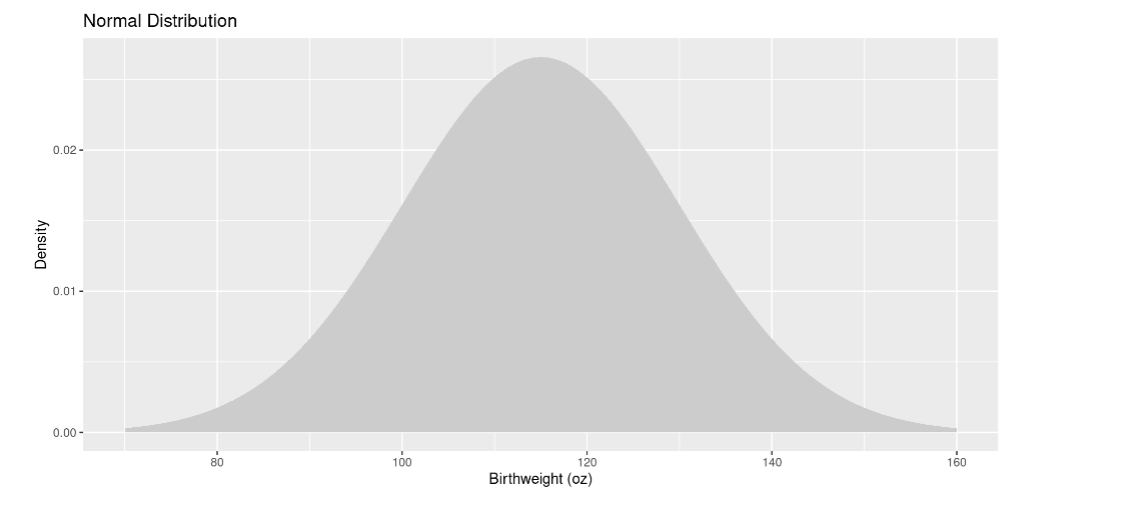
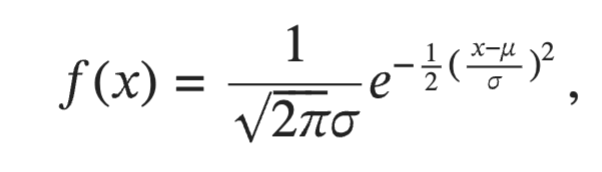
Normal distribution
the most common continuous distribution
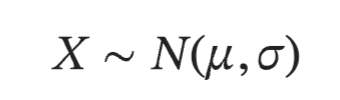
Normal distribution parameters
Mean and standard deviation
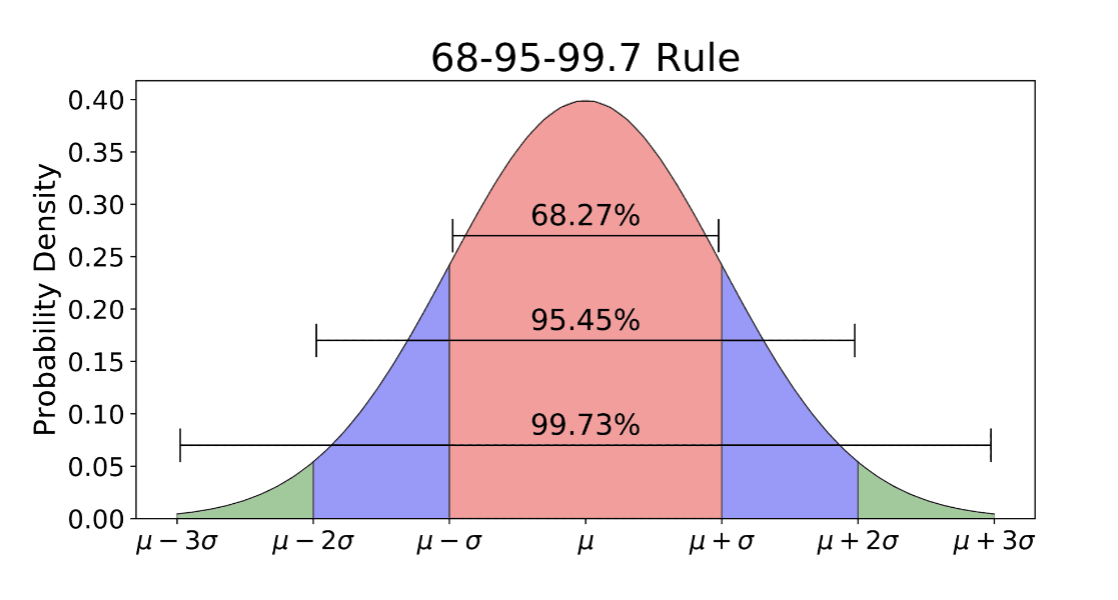
Normal distributions are
symmetric around their mean and unimodal
Normally distributed RVs are
continuous and can take any value from -infinity to infinity
Finding probabilities involved Normal Random Variables
find the area under the curve corresponding to the values we are interested in
areas under normal distributions formula


lower.tail = TRUE
tells us we want the probability that is LESS THAN the value we give R (left side of the distribution)
lower.tail = FALSE
tells us we want the probability that is GREATER THAN the value we give R (right side of the distribution)
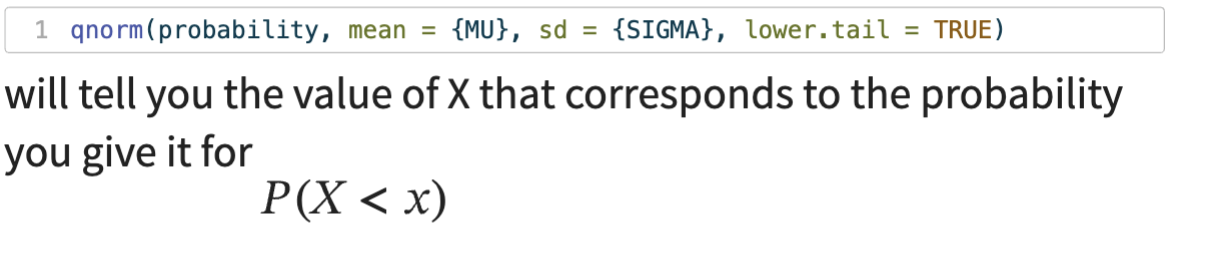
Normal RVs
qnorm
fine the value that gives you a specific probability
pnorm
find a probability that a normal random variable is less than or greater than a value
Standard Normal Distribution
a special case of the normal distribution with a mean of 0 and a standard deviation of 1, represented by the letter Z
Standardization
normal probability re-written in terms of “how many standard deviations from the mean are we interested in?”
Z score
tells us how many standard deviations away from the mean an observation is