Overview: Evolution Biology and Population Genetics
0.0(0)
Card Sorting
1/82
There's no tags or description
Looks like no tags are added yet.
Last updated 5:55 AM on 5/22/23
Name | Mastery | Learn | Test | Matching | Spaced | Call with Kai |
|---|
No analytics yet
Send a link to your students to track their progress
83 Terms
1
New cards
The levels of variability
* Phenotypic variation
* Chromosomal polymorphism
* Variation at the molecular level
* Chromosomal polymorphism
* Variation at the molecular level
2
New cards
Phenotypic variation
Variability in phenotypes that exists in a population (Example: height, weight, and body shape, hair, eye color, and the ability to roll your tongue) Divided into quantitative and qualitative traits.
3
New cards
Chromosomal polymorphism
A condition where one species contains members with varying chromosome counts and shapes
4
New cards
Variation at the molecular level
Includes enzyme polymorphism and variation at the DNA level. Allows organisms to respond to a wide range of environmental stimuli.
5
New cards
Enzyme polymorphism
The presence of two or more variant forms of a specific DNA sequence that occurs among different individuals or populations. Alleles are differentiated by the size of the molecules
6
New cards
Variation at the DNA level
Involves mini and micro satellites, and DNA sequencing. Describes the variation in the DNA sequence of genomes.
7
New cards
DNA sequencing
Sequenced using mtDNA, Nuclear DNA - SNP, Reduced-representation sequencing (RRS)
8
New cards
mtDNA
Maternal inheritance (DNA inherited only from the mother, not from the parents). DNA changes result from mutations. All individuals are related to each other maternally.
9
New cards
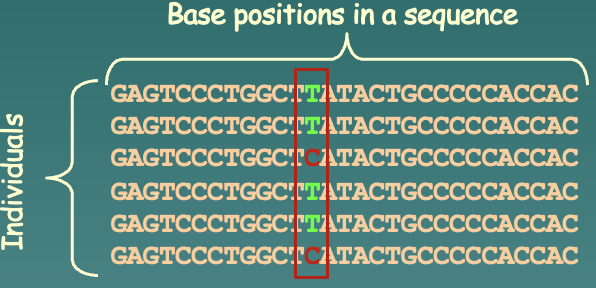
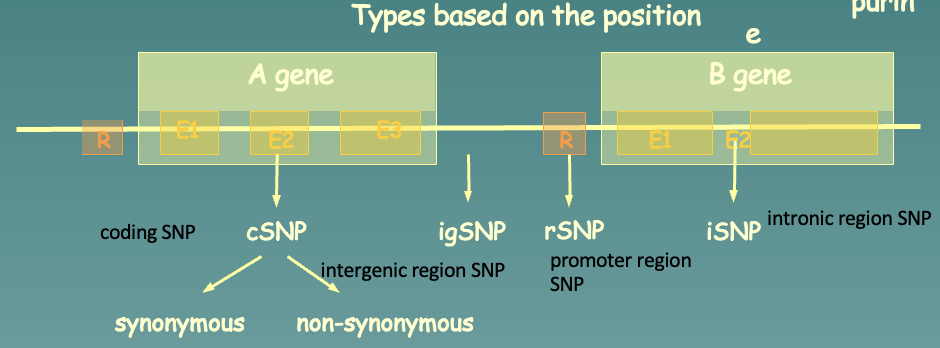
Nuclear DNA - SNP
The DNA of individuals are compared, specifically with SNP (Single Nucleotide Polymorphism), found at a specific position
10
New cards
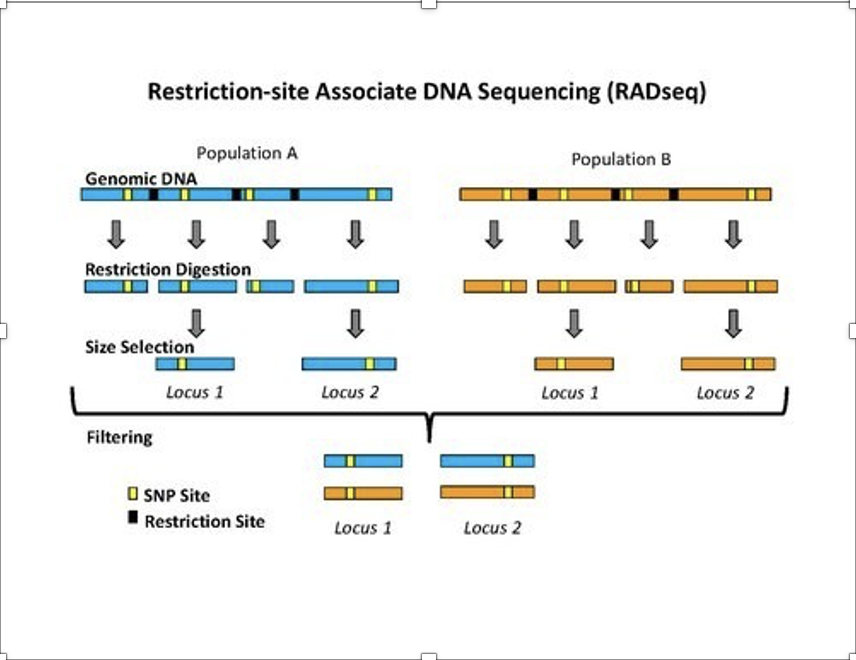
Reduced-representation sequencing (RRS)
A genomics technique that sequences a locus of the genome using restriction enzymes to cut DNA into smaller fragments. It is used in to identify genetic variation within and between populations.
11
New cards
The ideal/ Mendelian population
Has…
* Infinite population size
* Random mating
* No mutation
* No selection (same environmental effect on all phenotypes)
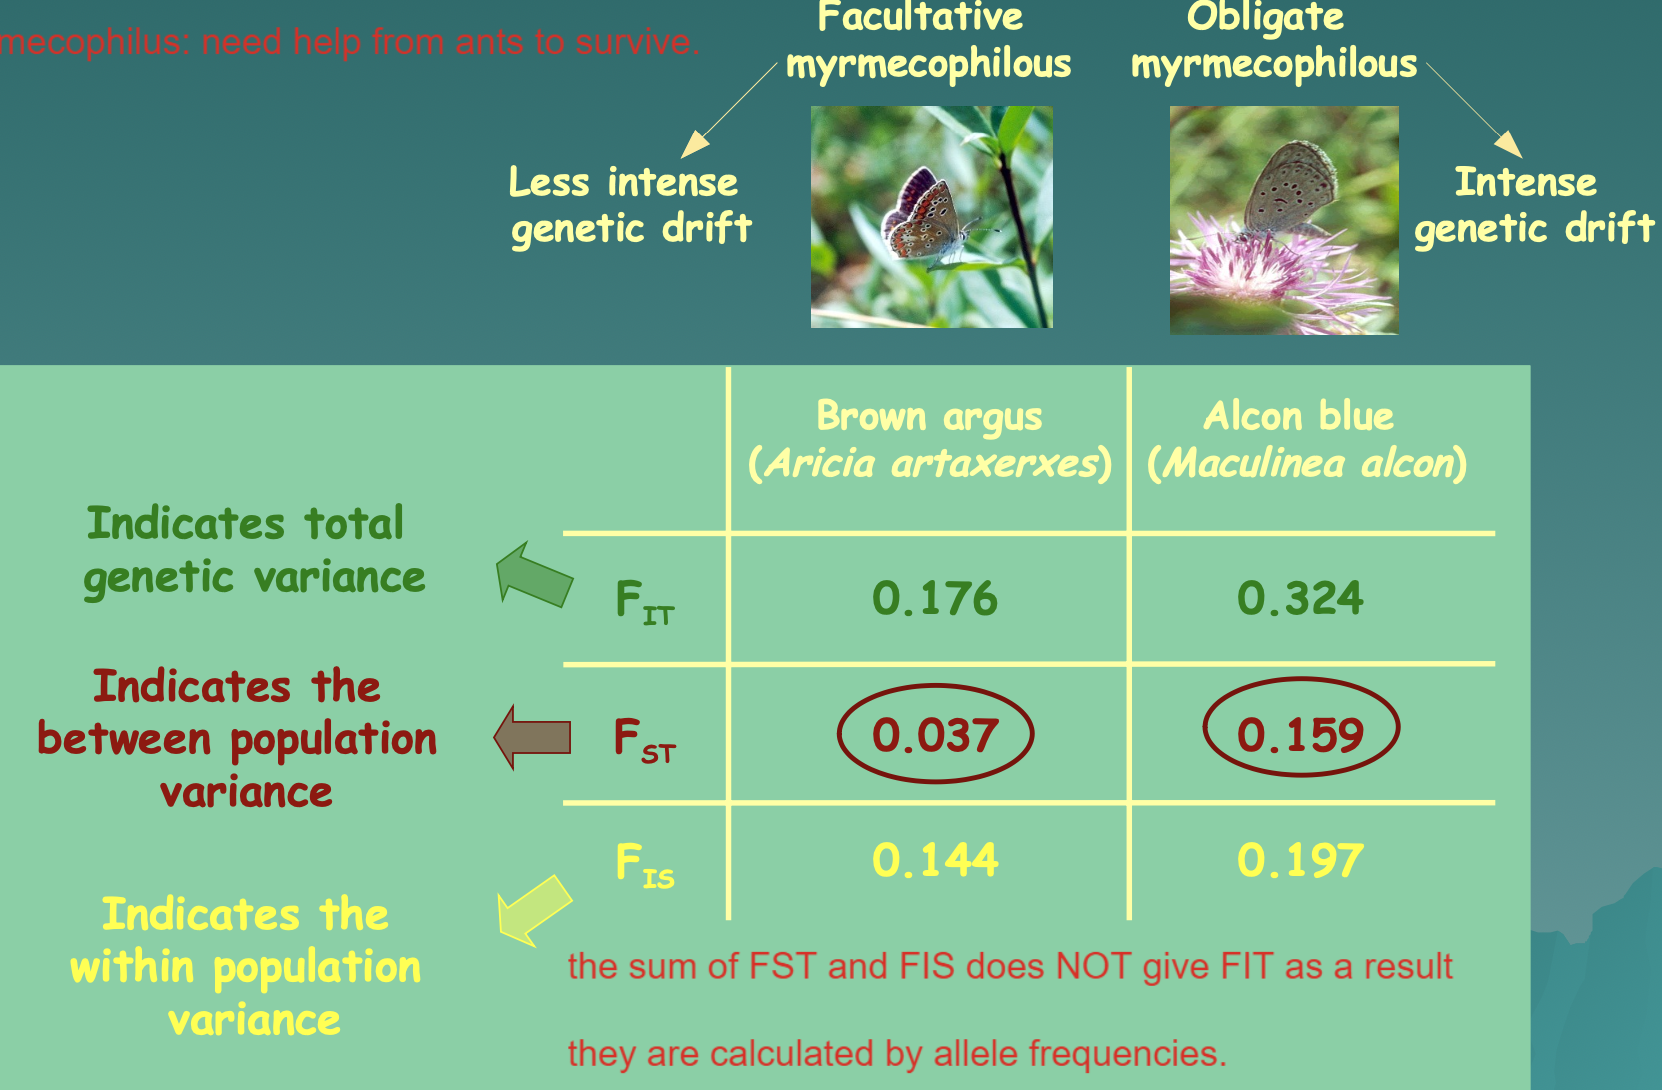
* No migration
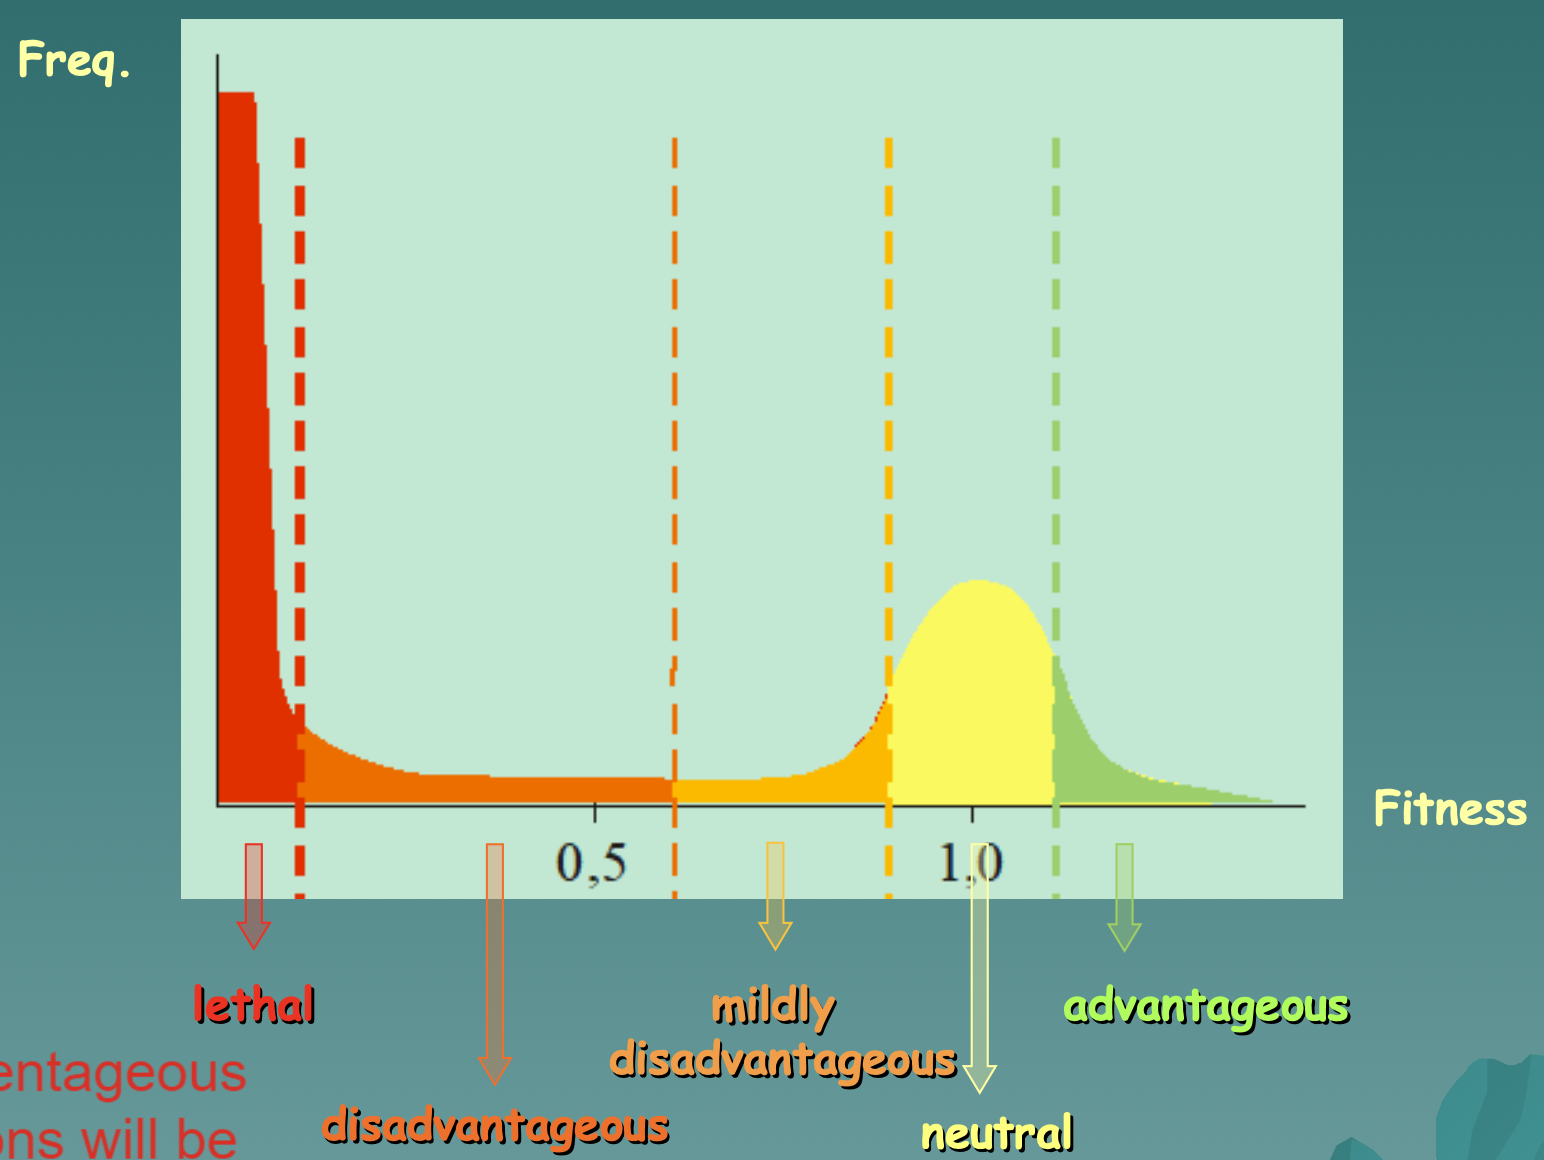
* In Hardy-Weinburg equilibrium
* Infinite population size
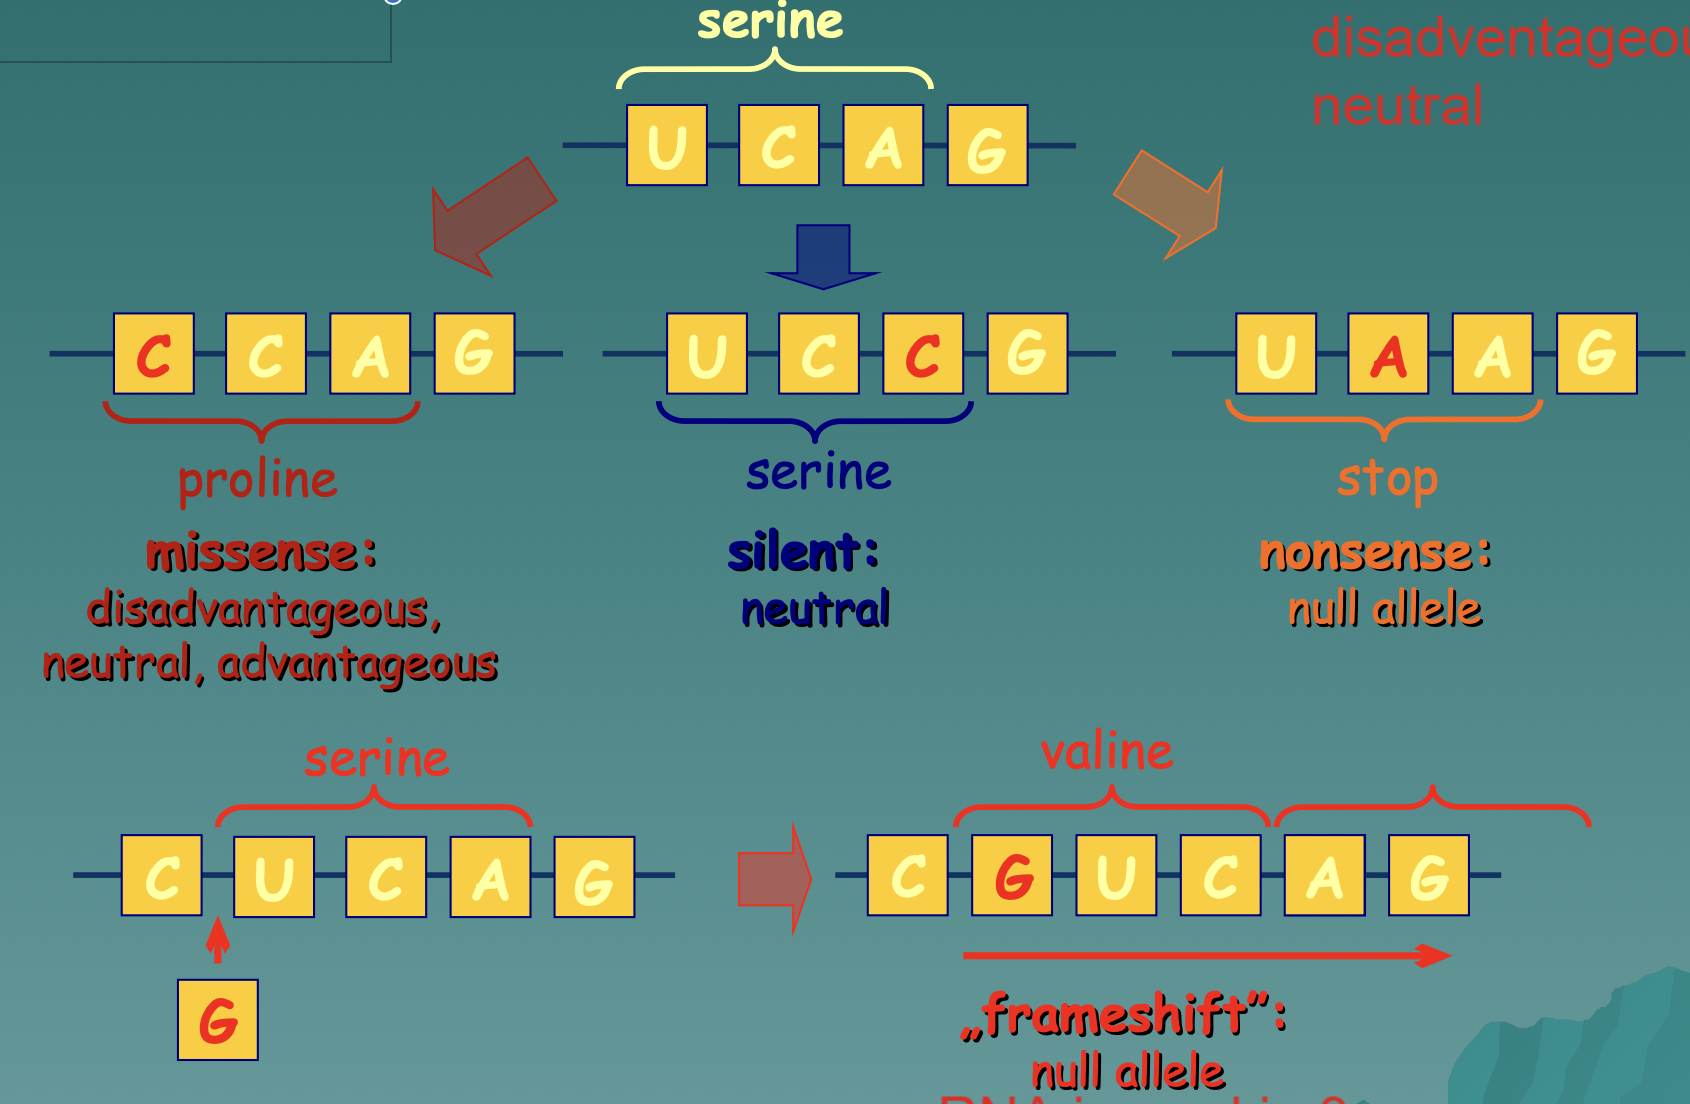
* Random mating
* No mutation
* No selection (same environmental effect on all phenotypes)
* No migration
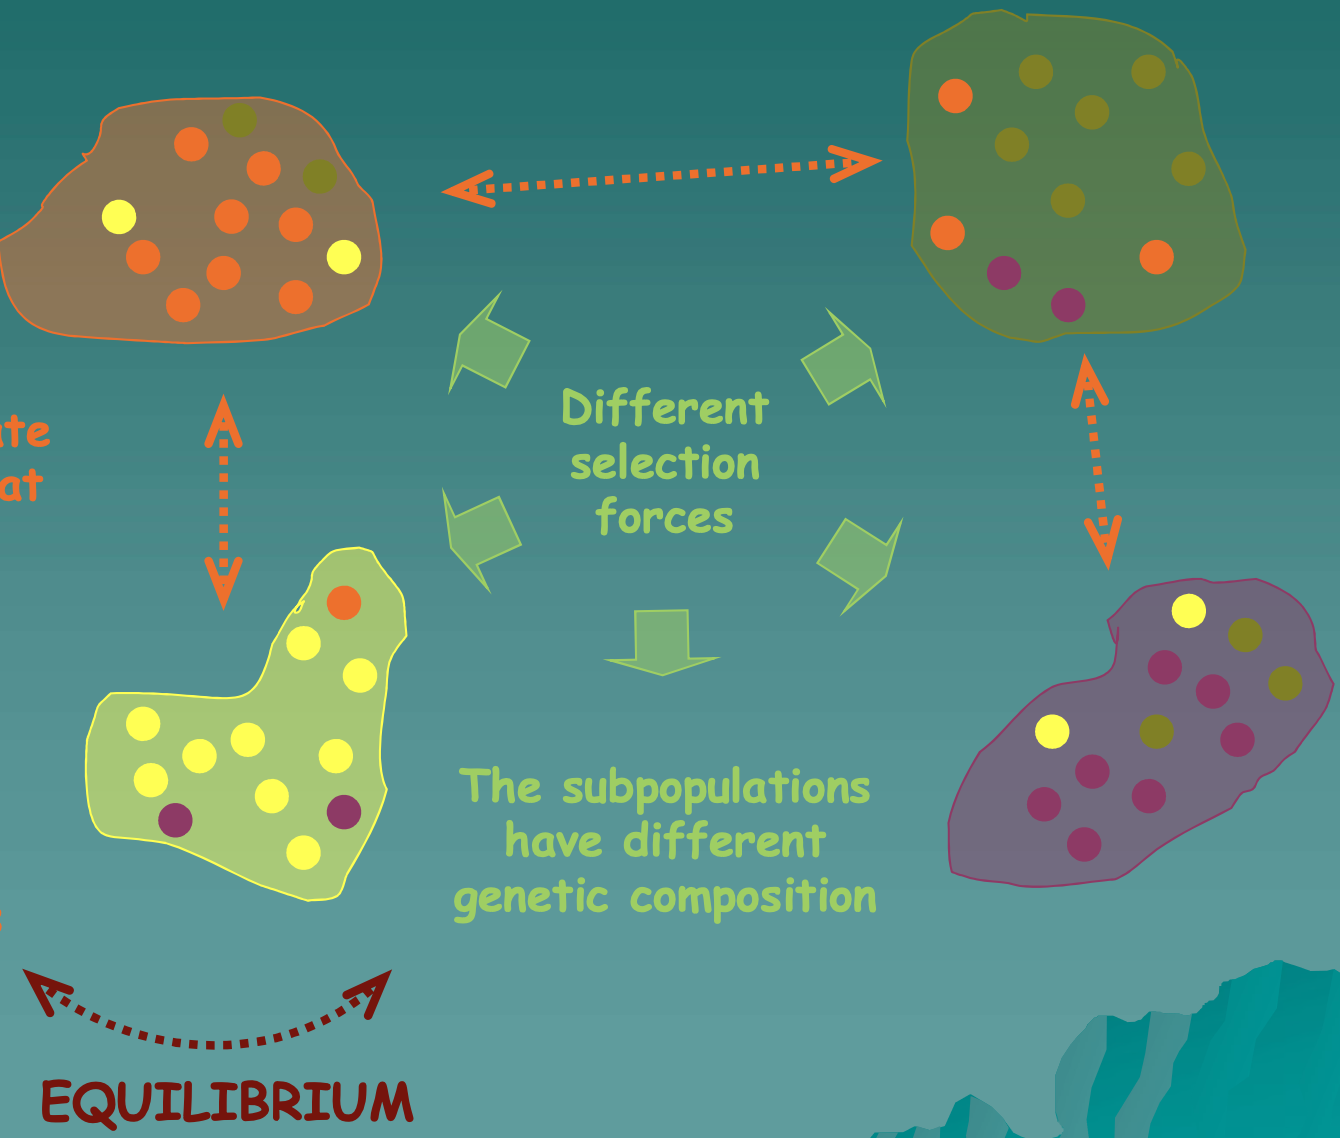
* In Hardy-Weinburg equilibrium
12
New cards
Different strategies to avoid mating between kin
Recognition of kin, Promiscuity, Migration
13
New cards
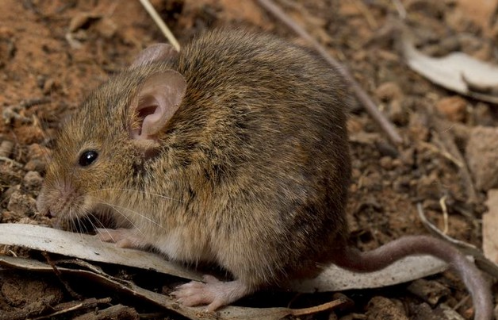
Recognition of kin
Example: Mouse (Mus musculus)
* Recognize kin based on the smell of their urine
* If the urine smells the same, they won’t mate
* Recognize kin based on the smell of their urine
* If the urine smells the same, they won’t mate
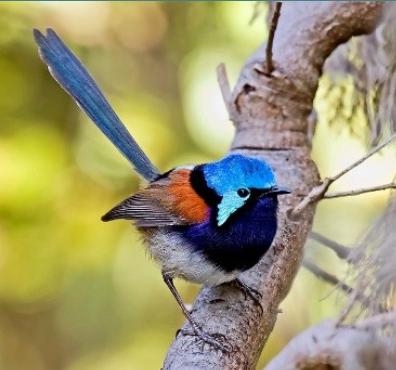
14
New cards
Promiscuity
Example: Fairy wren (Malurus elegans)
* Birds mate with those other than their partner
* 70% of offspring is not from the attendant male
* Birds mate with those other than their partner
* 70% of offspring is not from the attendant male
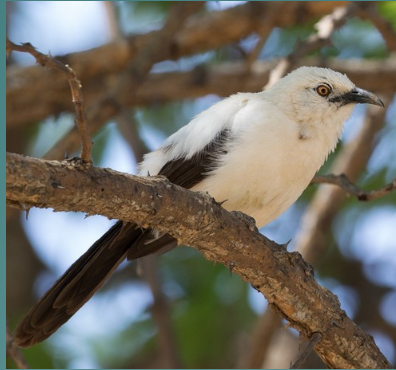
15
New cards
Migration
Example: Pied babbler (Turdoides bicolor)
* Lives in groups, young birds leave the group
* Lives in groups, young birds leave the group
16
New cards
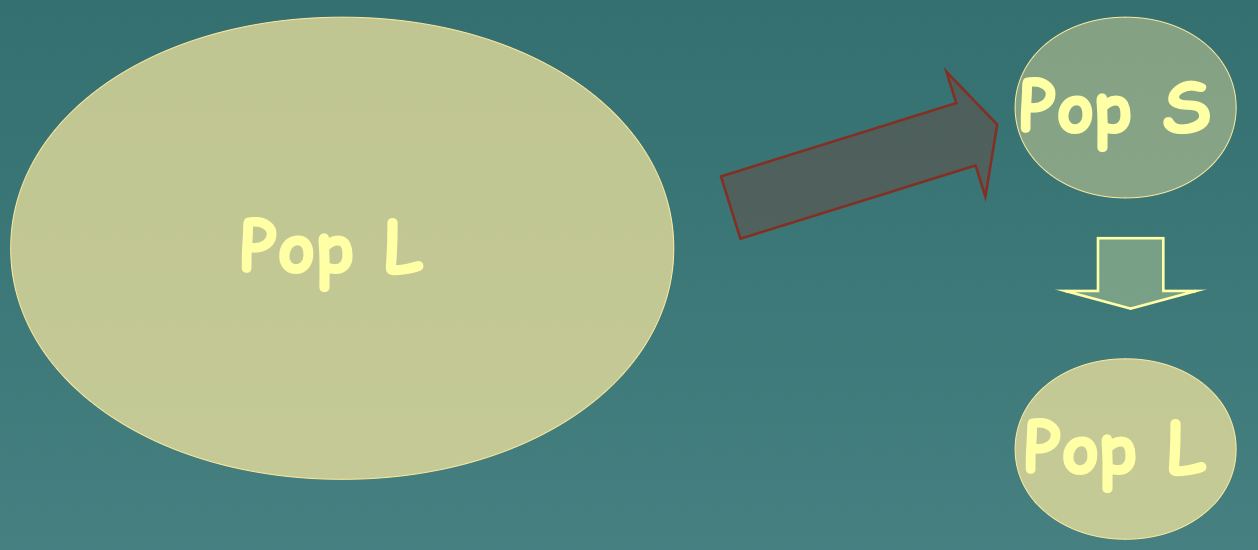
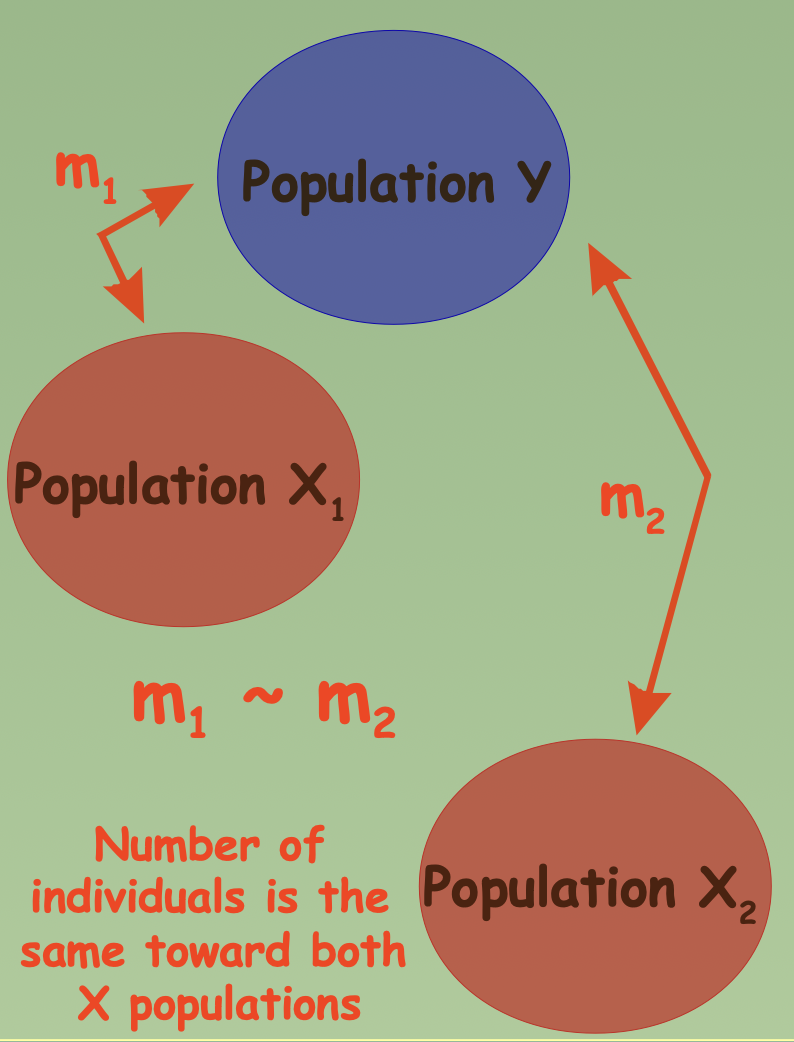
Continent- Island model
One population is much larger, so it can be assumed that population y (larger) to x (smaller) would be larger
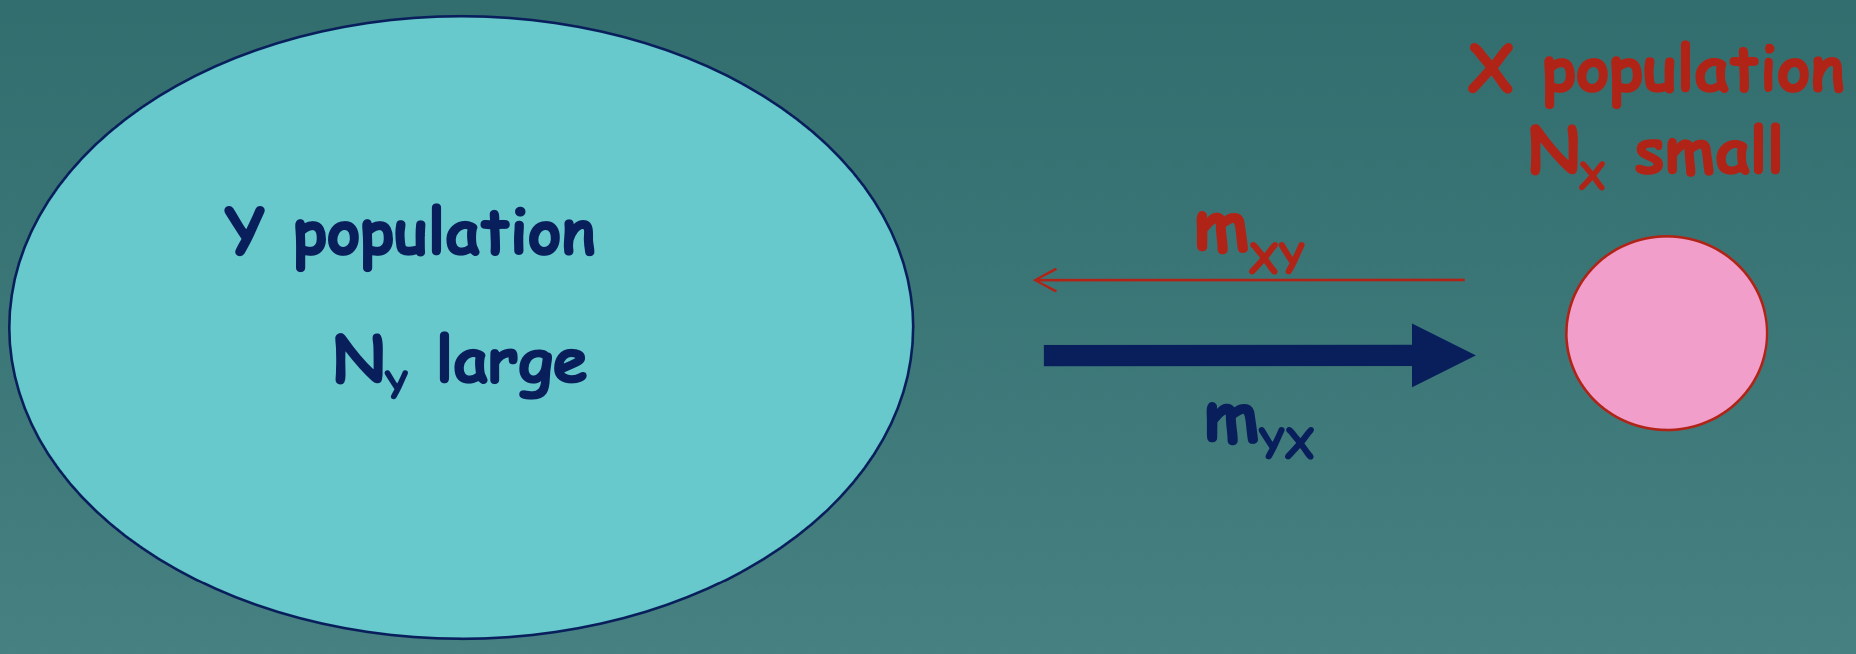
17
New cards
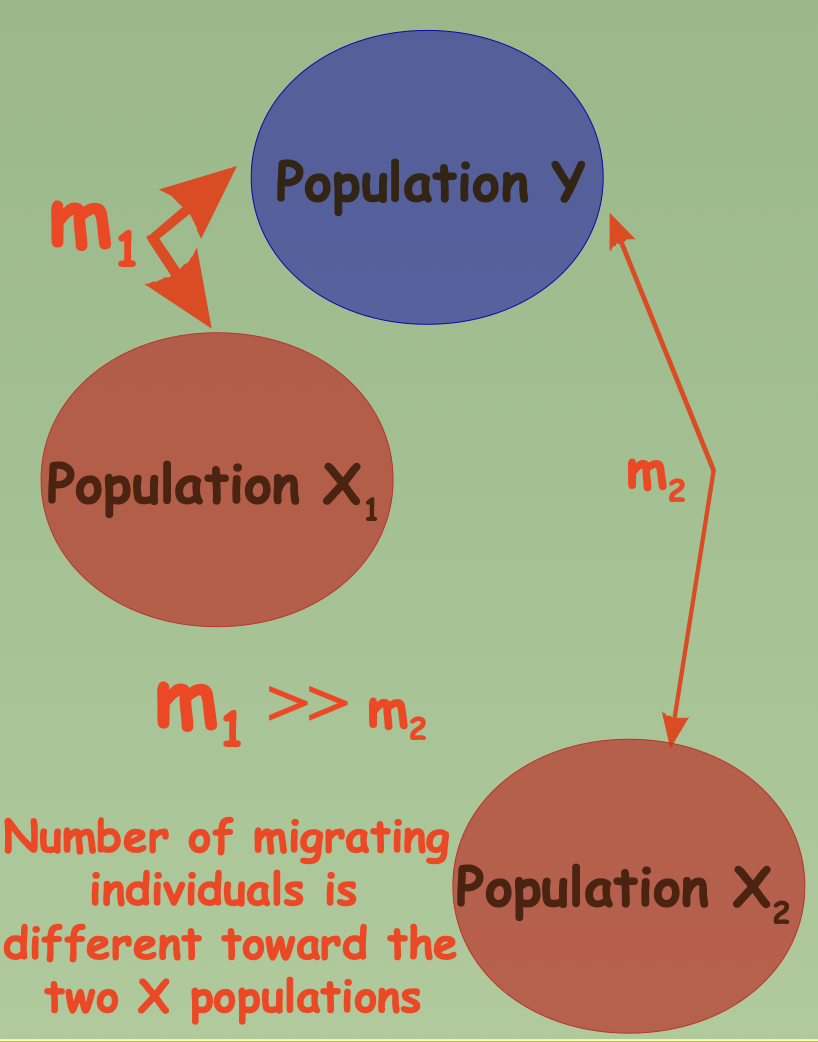
Continent island model: Asymmetric gene flow
Due to this, the small population becomes more and more similar to the large population. Resulting in a loss of genetic identity for the small population.
18
New cards
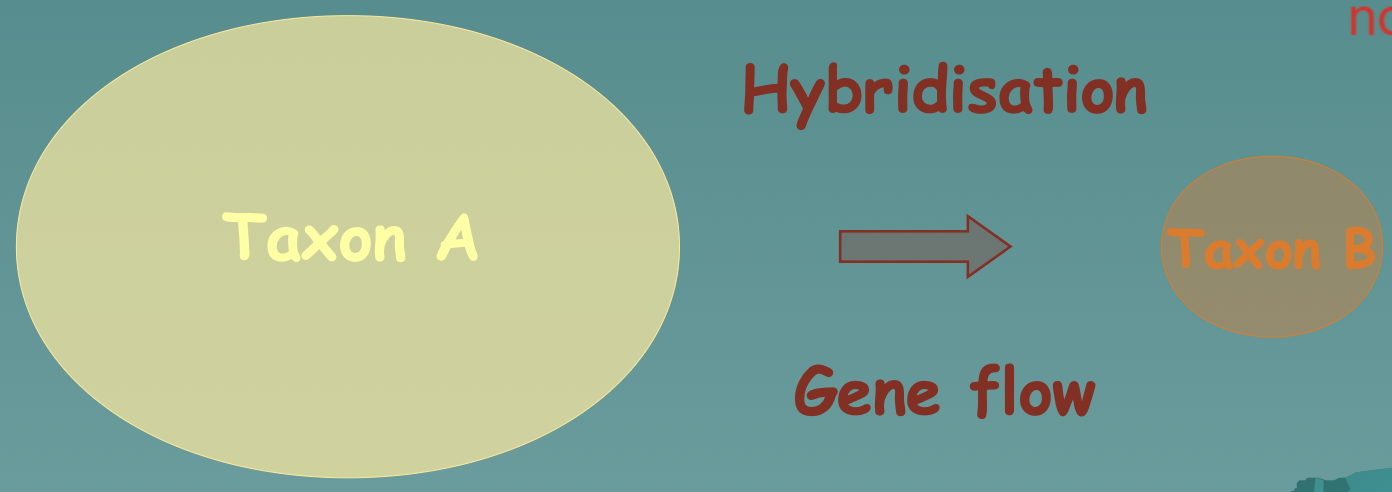
Introgression
* The result of the continent-island model coupled with hybridization The asymmetric gene flow and hybridization cause the smaller taxa to lose its genetic identity.
* a gene transfer process between two species, typically as a result of hybridisation and backcrossing
* a gene transfer process between two species, typically as a result of hybridisation and backcrossing
19
New cards
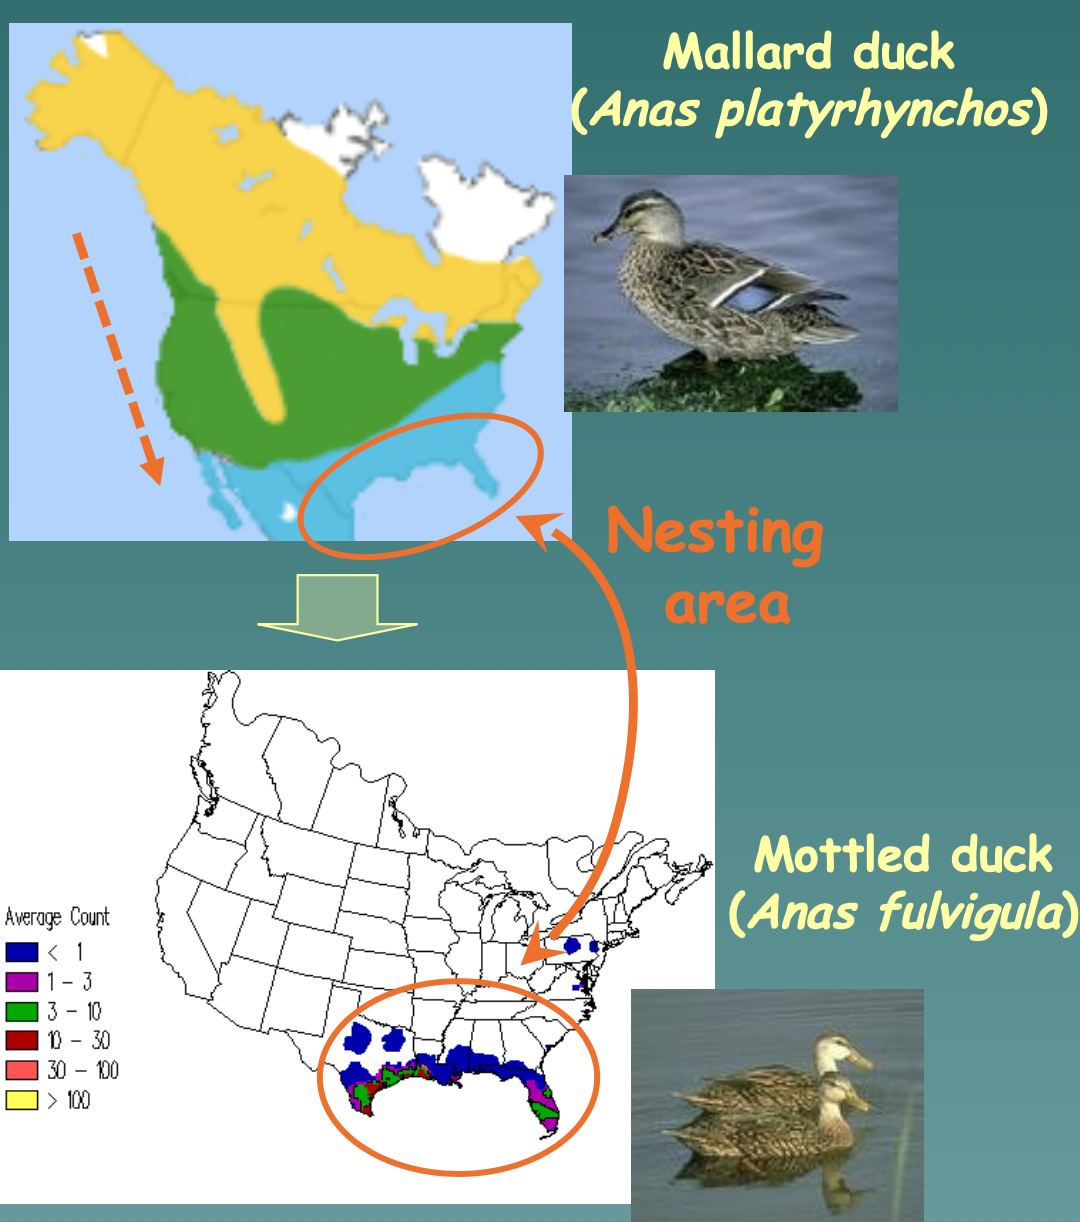
Examples of introgression
* Mallard duck (Anas platyrhynchos) → Mottled duck (Anas fulvigula)
* Domestic cat (Felis catus) → Wild cat (Felis silvestris)
* Song of the common chaffinch (Fringilla coelebs)
* Domestic cat (Felis catus) → Wild cat (Felis silvestris)
* Song of the common chaffinch (Fringilla coelebs)
20
New cards
Island models
Wright’s island model, Isolation by distance, Stepping stone model
21
New cards
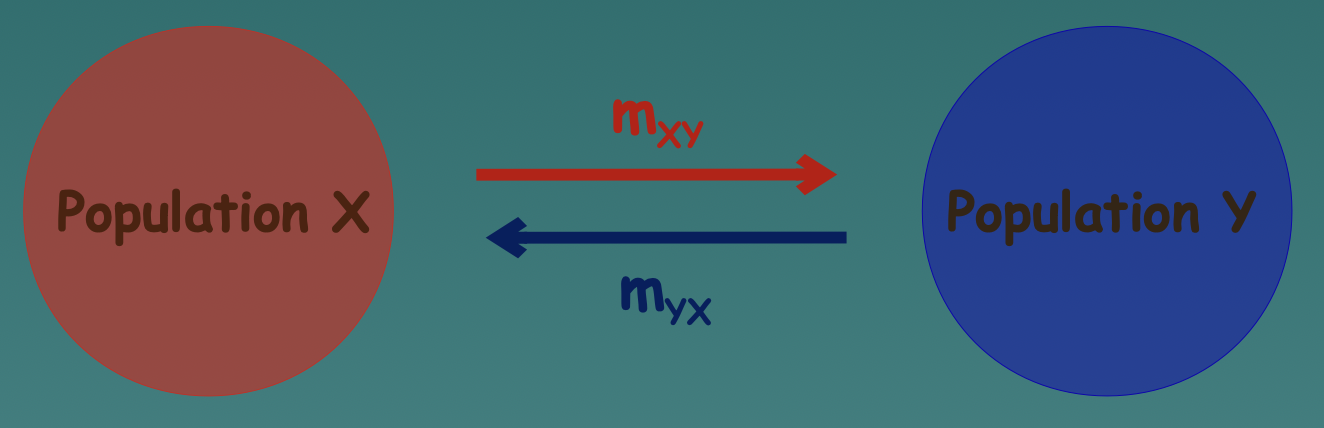
Wright’s island model
* Involves 2 populations with diff genetic content but similar pop. size.
* The migration rate is very similar, causing symmetric gene flow.
* The allele frequency change will have around equal impact.
* The migration rate is very similar, causing symmetric gene flow.
* The allele frequency change will have around equal impact.
22
New cards
Wright’s island model 2
23
New cards
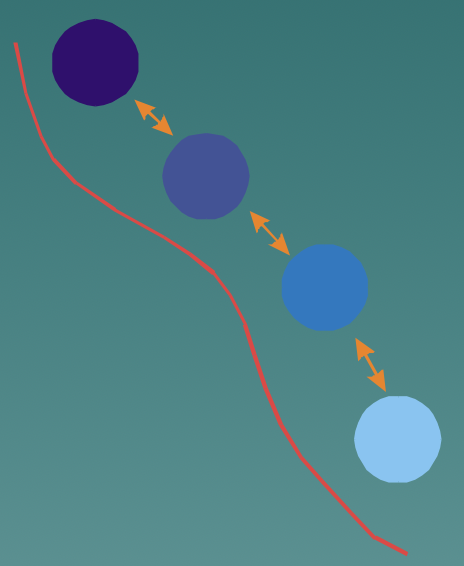
Isolation by distance model
Genetic difference increases with distance
24
New cards
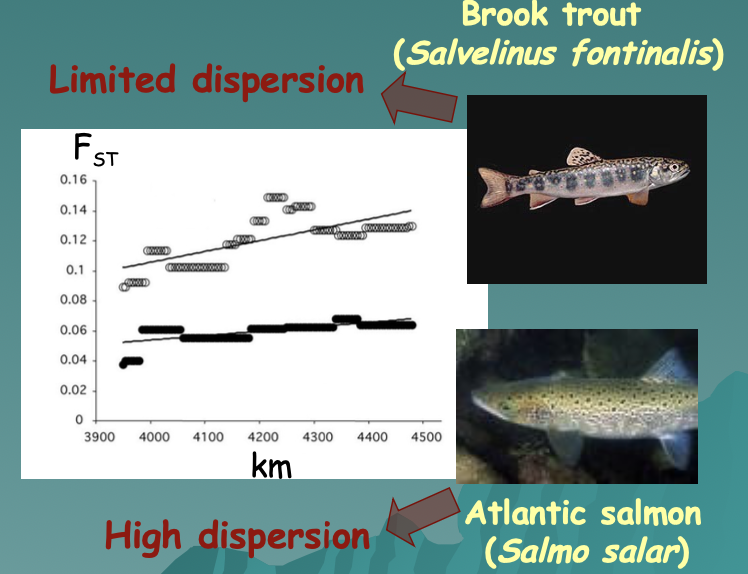
Isolation by distance example
* Brook trout (Salvenius fontonalis), having limited dispersion → Atlantic salmon (Salmo salar), having high dispersion
* Eurasian otter (Lutra lutra)
* Eurasian otter (Lutra lutra)
25
New cards
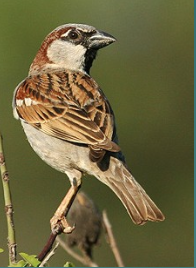
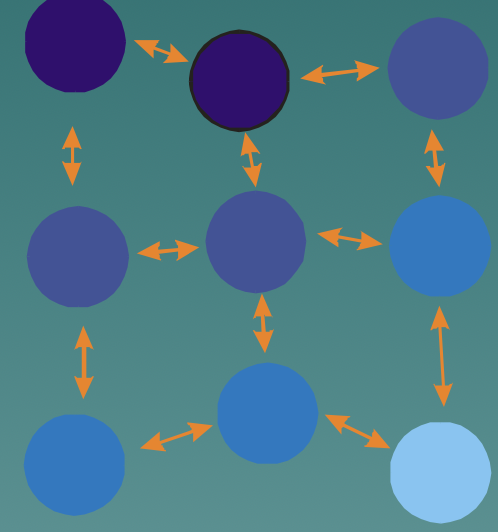
Stepping stone model
* Individuals can only migrate between neighboring populations.
* Has two types: One-dimensional model, and two dimensional model.
* Results in Geographic cline: A gradual change in the genetic or phenotypic composition of the populations
* Example: House sparrow (Passer domesticus)
* Has two types: One-dimensional model, and two dimensional model.
* Results in Geographic cline: A gradual change in the genetic or phenotypic composition of the populations
* Example: House sparrow (Passer domesticus)
26
New cards
Stepping stone model: One-dimensional model
The arrangement of the populations is linear
27
New cards
Stepping stone model: Two-dimensional model
The populations are arranged like a net (between neighboring populations)
28
New cards
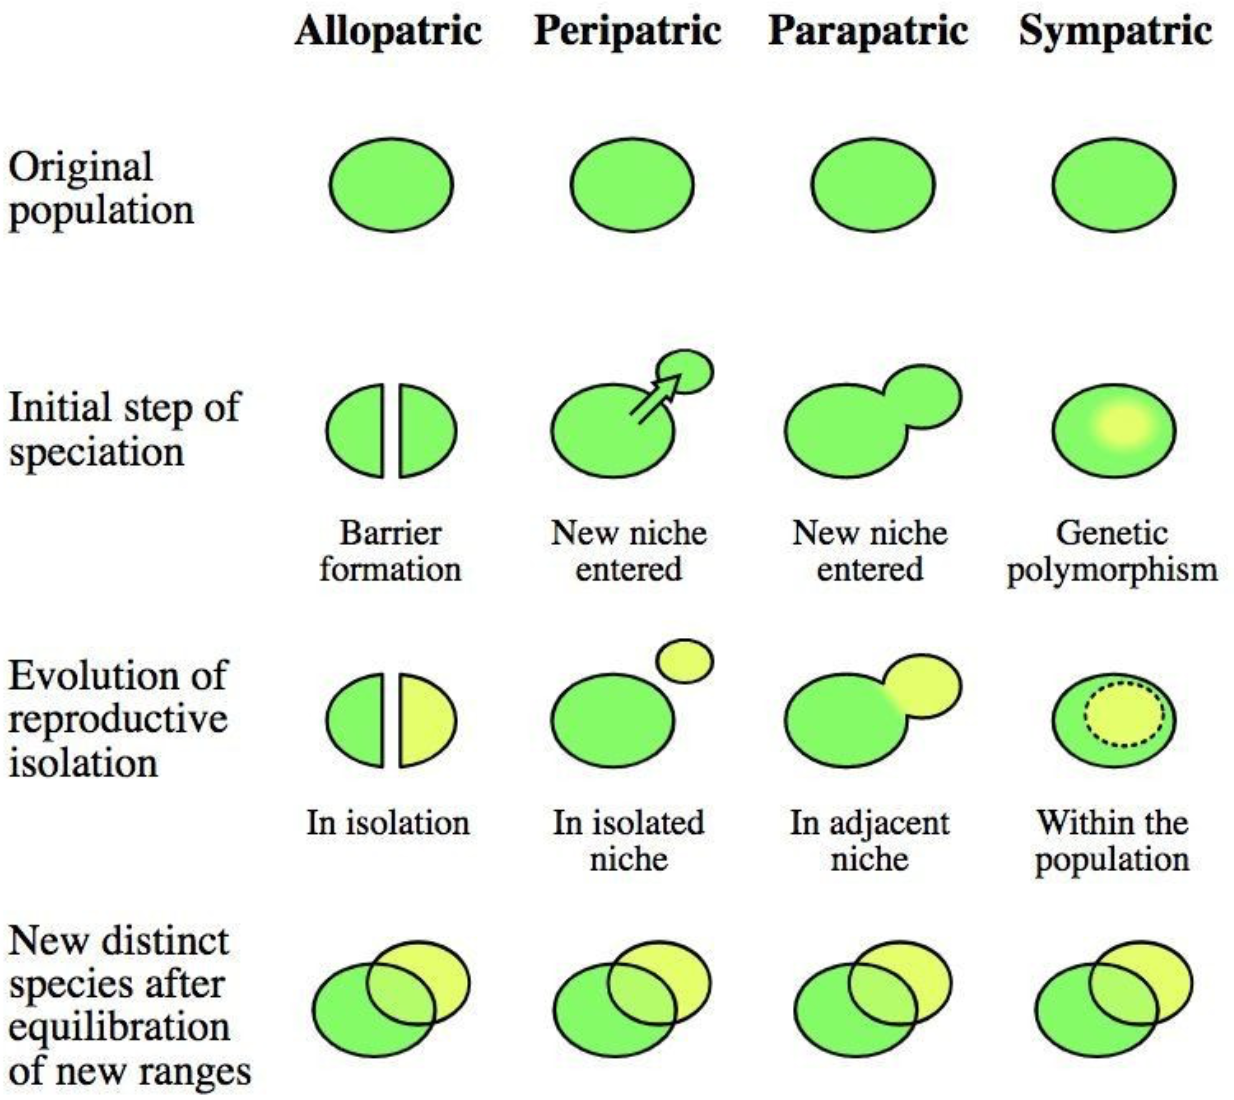
Types of speciation
Allopatric, Parapatric, Sympatric
29
New cards
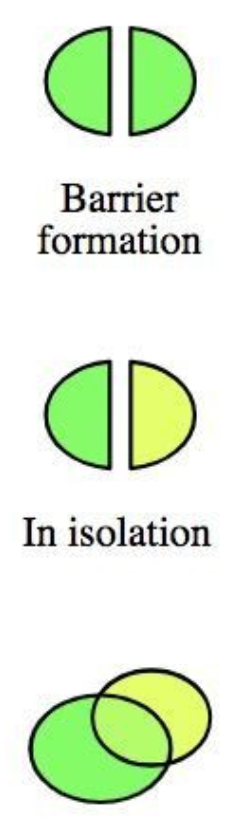
Allopatric speciation
The first step is the geographical separation of populations
30
New cards
Parapatric speciation
Selection in different directions affecting neighboring populations
31
New cards
Sympatric speciation
All forms of species formation that do not have geographical isolation in the initial stages
32
New cards
Erasmus Darwin
* Supported the background to Darwin’s theory of evolution
* Wrote Zoonomia: Species are descended from a common ancestor
* Raised the idea of natural selection
* Wrote Zoonomia: Species are descended from a common ancestor
* Raised the idea of natural selection
33
New cards
Charles Lyell
* Supported the background to Darwin’s theory of evolution
* Supported uniformitarianism
* Provided geological and fossil evidence of Darwin’s theory
* Supported uniformitarianism
* Provided geological and fossil evidence of Darwin’s theory
34
New cards
Thomas Malthus
* Supported the background to Darwin’s theory of evolution
* Wrote An essay on the Principle of Population: Human population increase exponentially: nature compensates with wars, famines, diseases
* Wrote An essay on the Principle of Population: Human population increase exponentially: nature compensates with wars, famines, diseases
35
New cards
The basis of Darwin’s Theory of Evolution
1. The Diversity of species
2. The idea of natural selection
36
New cards
Darwin’s Theory of Evolution
1. __Limited resources__ → Check the increasing potential of populations
2. Individuals of a population __vary in__ their __phenotypic traits__, much of the variability is heritable → Affects individual survival, reproduction → __Affects fitness__
3. __Natural selection__ → Individuals are more suited to the environment will survive on and pass their more favorable traits
4. Natural selection causes the population to __evolve gradually__ → adapt to the environment → evolutionary change accumulates in different lineages → __speciation__
37
New cards
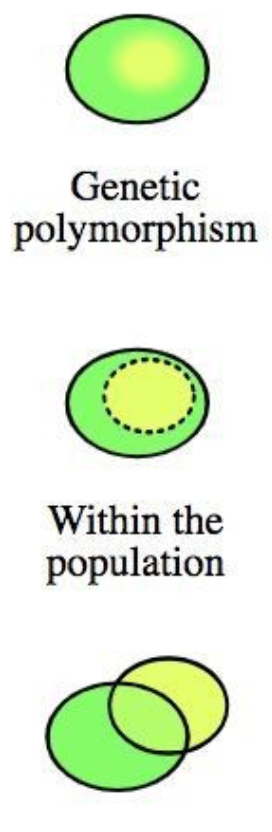
Phenotypic variation
* Variability in phenotypes that exists in a population. (Ex: height, weight, and body shape, hair, eye color, and the ability to roll your tongue)
* Quantative and Qualitative traits
* Vp = Vg + Ve + Vge
Phenotypic variance= genotypic+ environmental+interaction
* Quantative and Qualitative traits
* Vp = Vg + Ve + Vge
Phenotypic variance= genotypic+ environmental+interaction
38
New cards
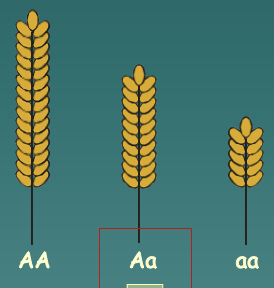
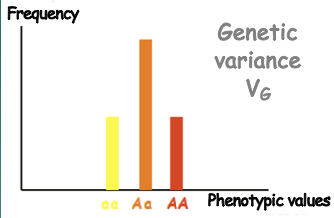
Genotypic/genetic variation
* The final phenotypes of heterozygous offspring (Example: AA, Aa, aa)
* Vg = Va + Vd + Vi
* Interactions between genes
* Vg = Va + Vd + Vi
* Interactions between genes
39
New cards
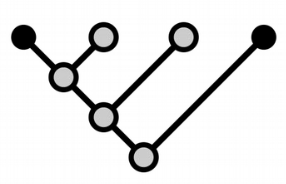
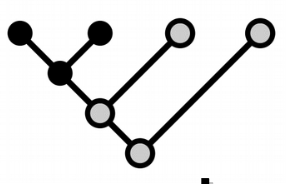
Cladogram
A diagram showing a hypothetical relationship between groups of organisms (Branch length is not important)
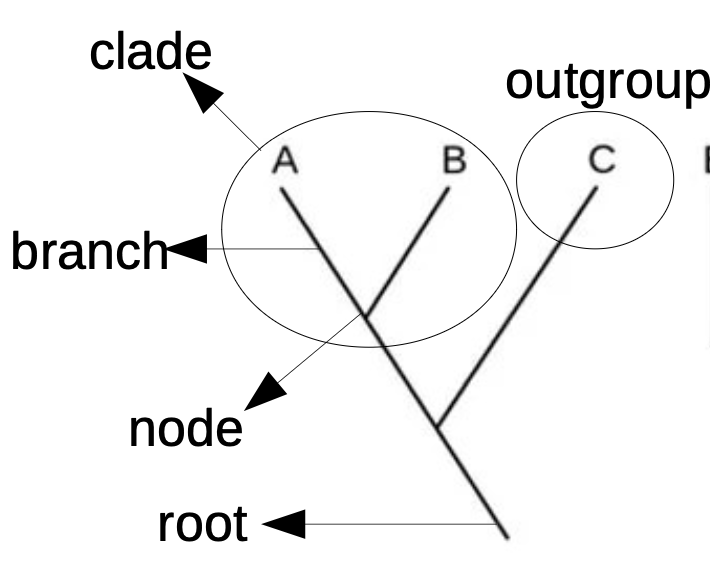
40
New cards
Chronogram
Branch lengths are proportional to time
41
New cards
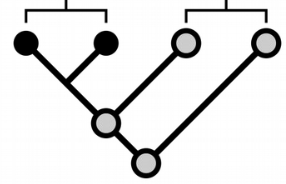
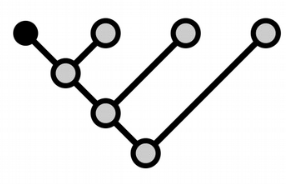
Monophyletic group
Phylogenetically equivalent sister groups derived directly from a common ancestor

42
New cards
Paraphyletic group
A grouping in which the members of a group can be traced back to a common ancestor, but the group does not include all descendants of the common ancestor
43
New cards
Polyphyletic group
An artificially created taxon (supraspecific category) whose members, although similar, cannot be traced back to a common ancestor, but have evolved from different ancestral forms through convergent or parallel evolution.

44
New cards
Character states
The concepts used in phylogenetic character analysis are always relational, expressing the direction (polarity) of character change.
Homology, Homoplasy, Plesiomorphy, Simplesiomorphy, Apomorphy, Autapomorphy, Synapomorphy
Homology, Homoplasy, Plesiomorphy, Simplesiomorphy, Apomorphy, Autapomorphy, Synapomorphy
45
New cards
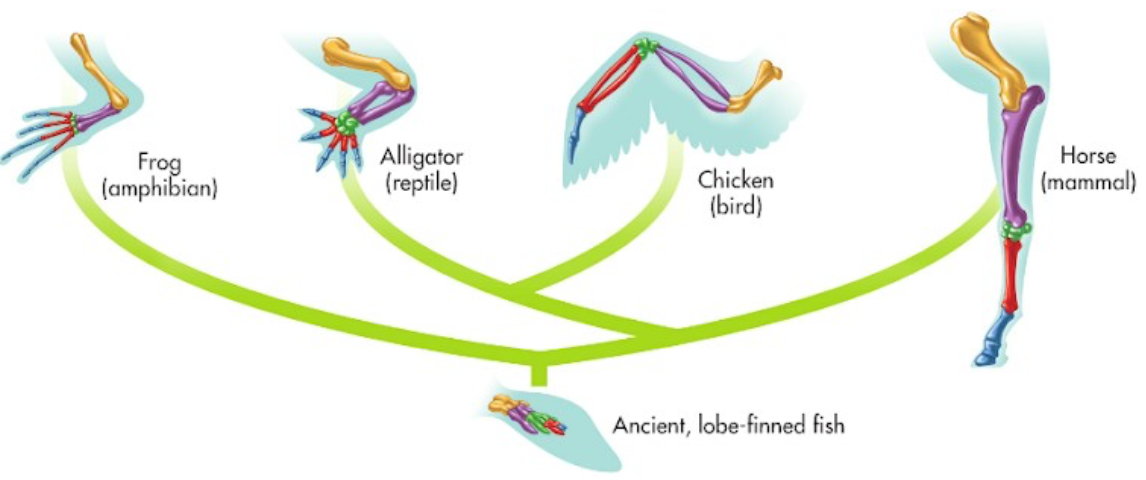
Homology
The basic structural (or functional) similarities between taxa that existed in their straight or distant ancestors, so that they have not changed substantially in their lineage, but have been modified adaptively at most (Ex: Five-toad limbs, insect antennae, plant leaves)
46
New cards
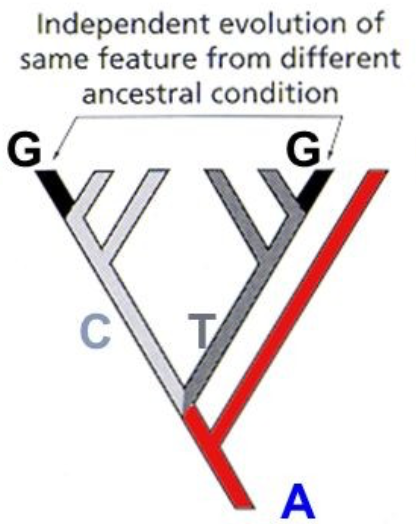
Homoplasy
Morphological features showing similarity but not common origin (Ex: animal eyes, wings)
\
\
47
New cards
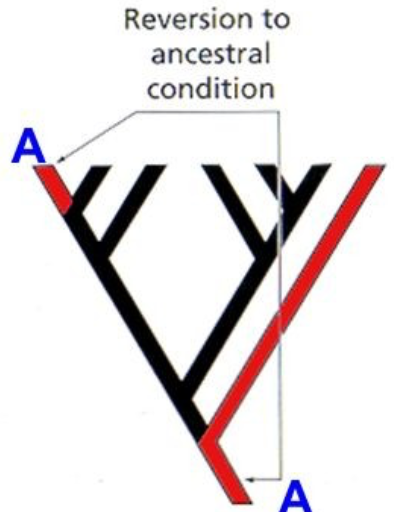
Reversion
A type of homoplasy. If the secondary similarity is created by a return to a previous state of character.
48
New cards
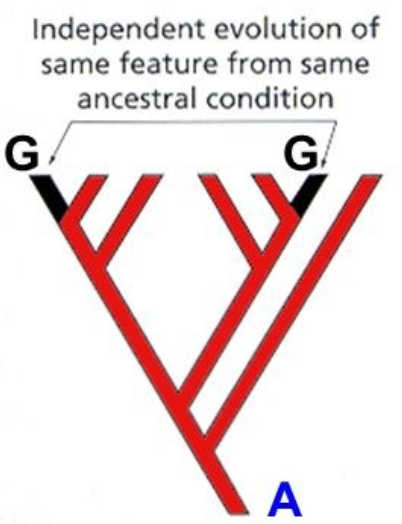
Parallelism
A type of homoplasy. If the similarity is the result of independent parallel evolution from a more or less similar initial state. (Ex: Four chambered-heart in birds and mammals)
49
New cards
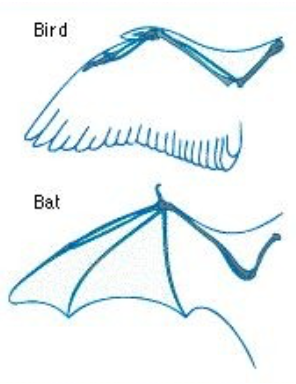
Convergence
A type of homoplasy. If the similarity is the result of a development from a different prior condition to a similar one, usually as a result of a transition to a similar lifestyle.
50
New cards
Plesiomorphy
Relatively ancient, primitive or ancestral character state. (Ex: Legs of reptiles)
51
New cards
Symplesiomorphy
A shared plesiomorphic character state. Ancestral character shared by all members of a clade which does not make this the clade different from other clades (Ex: backbone)

52
New cards
Apomorphy
Modified character state that comes from the previous (plesiomorphic) character state. (Ex: leglessness in reptiles)
53
New cards
Autapomorphy
A trait carried exclusively by a given taxon (species or any rank of unit above species), usually result of a specialization change. (Ex: marsupium of marsupials
54
New cards
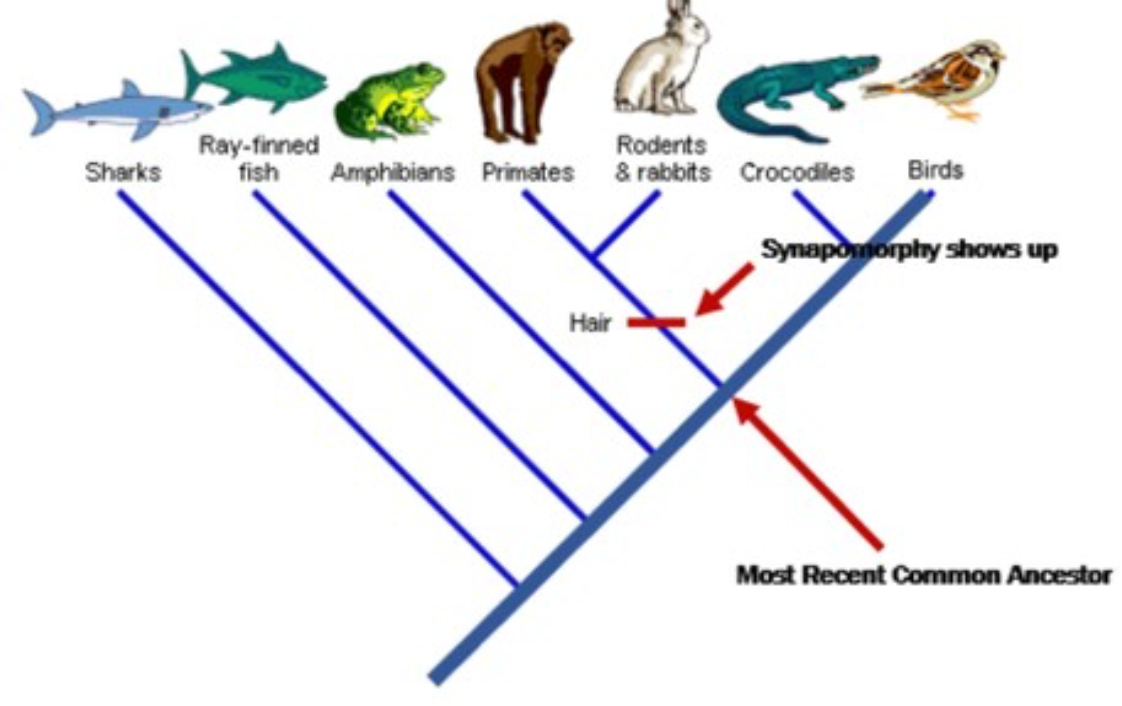
Synapomorphy
The common derivative trait of two or more groups. These groups had/ have a common ancestor that already had this character. When it was formed, this character was autapomorphic.
55
New cards
**Coevolution**
Development of two species (or supra-species taxa) ininteraction with each other.
56
New cards
Mutualistic coevolution
* + / +
* Partners mutually increase each other’s fitness. If the connection lasts long enough, it can lead to cospeciation.
* Examples:
* Attini Ant- Lepiotaceae fungus mutualism: Ants care for fungi, parts of fungi fed to babies
* Figs - Fig wasps
* Yukka - yucca moths
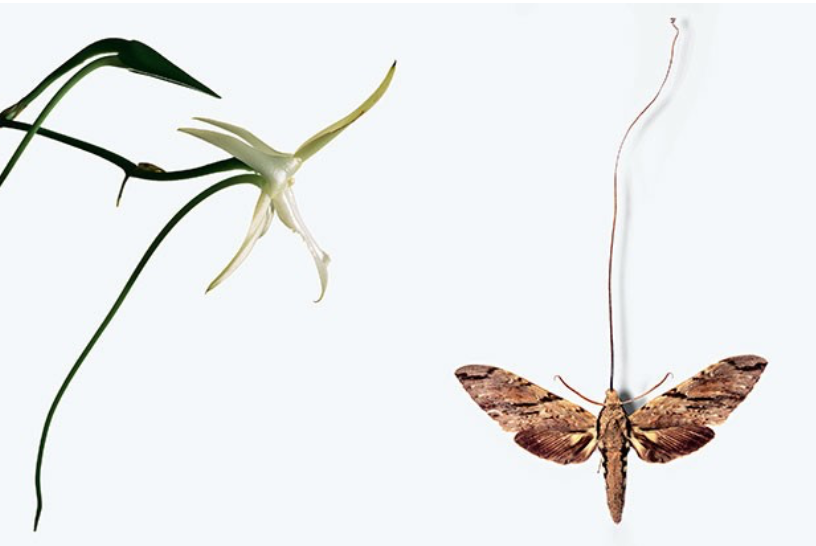
* Specific pollination
* Darwin’s orchid (Angraecum sesquipedale) - Morgan’s sphinx moth (Xanthopan morgani praedicta) (flowers are specific to pollinators)
* Partners mutually increase each other’s fitness. If the connection lasts long enough, it can lead to cospeciation.
* Examples:
* Attini Ant- Lepiotaceae fungus mutualism: Ants care for fungi, parts of fungi fed to babies
* Figs - Fig wasps
* Yukka - yucca moths
* Specific pollination
* Darwin’s orchid (Angraecum sesquipedale) - Morgan’s sphinx moth (Xanthopan morgani praedicta) (flowers are specific to pollinators)
57
New cards
Antagonistic coevolution
* - / +
* Partners reduce each other’s fitness. (Ex: Parasitism, plants/phytophages, predators/prey)
* Examples:
* Sap sucking
* *Tetraopes* beetles – milkweeds (*Asclepias*): Beetles contain toxic carotenoids
* Common garter snake (Thamnophis sirtalis) – rough-skinned newr (Taricha granulosa): Predator/prey
* Common cuckoo (*Cuculus canorus*): Parasite
58
New cards
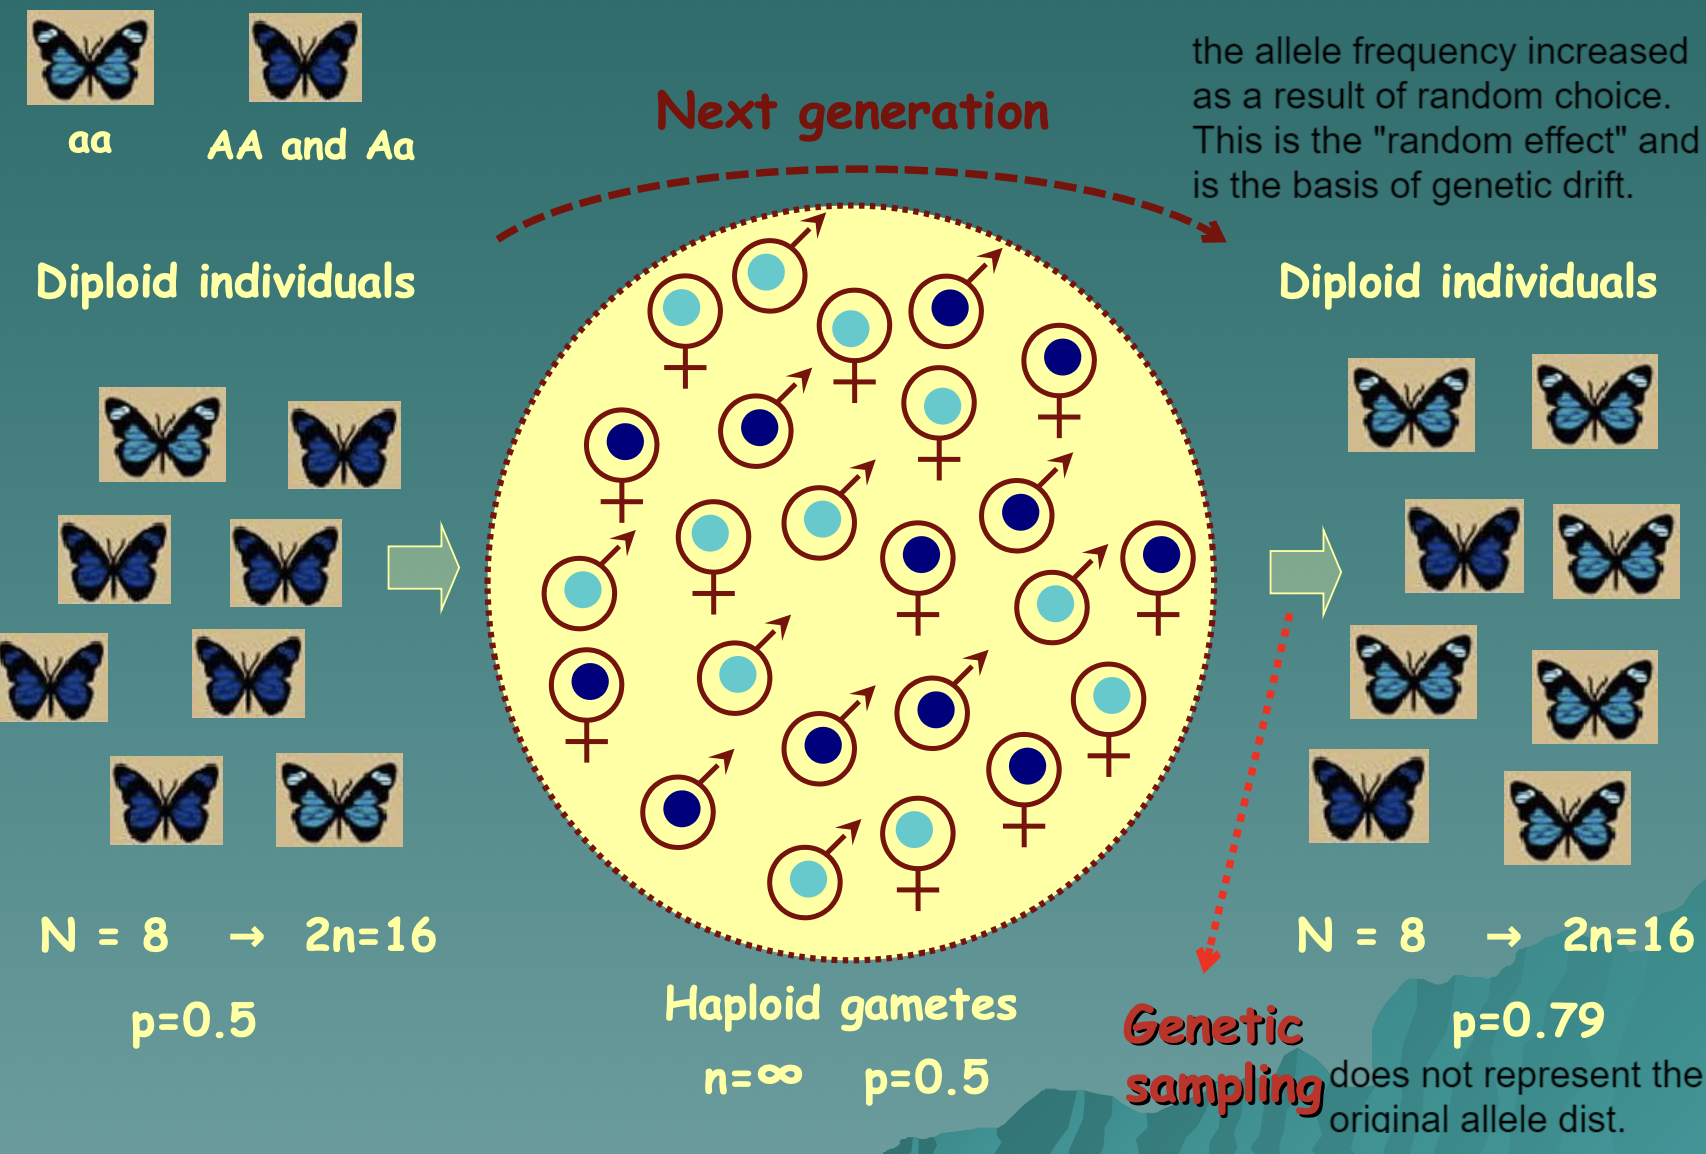
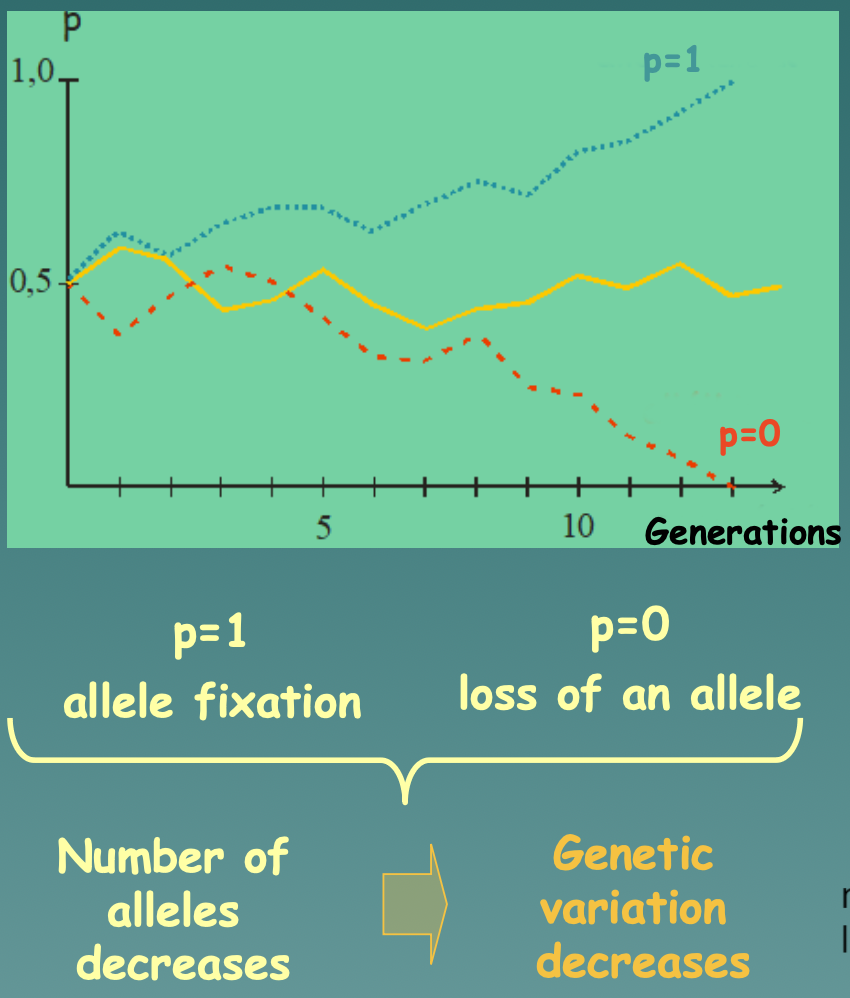
Genetic drift: Changes in allele frequency
The random fluctuations in the frequency of alleles in a population due to chance events. It can lead to changes in the genetic makeup of a population over time, and can be particularly important in small populations.
59
New cards
Genetic sampling Error
Unlike populations in Hardy-Weinburg Equilibrium, real populations have…
* Finite population sizes
* Random effects
* Resulting in an error of genetic sampling (not representing original allele distribution)
* Finite population sizes
* Random effects
* Resulting in an error of genetic sampling (not representing original allele distribution)
60
New cards
Random walk
Random changes in allele frequency through several generations
61
New cards
Bottleneck Effect
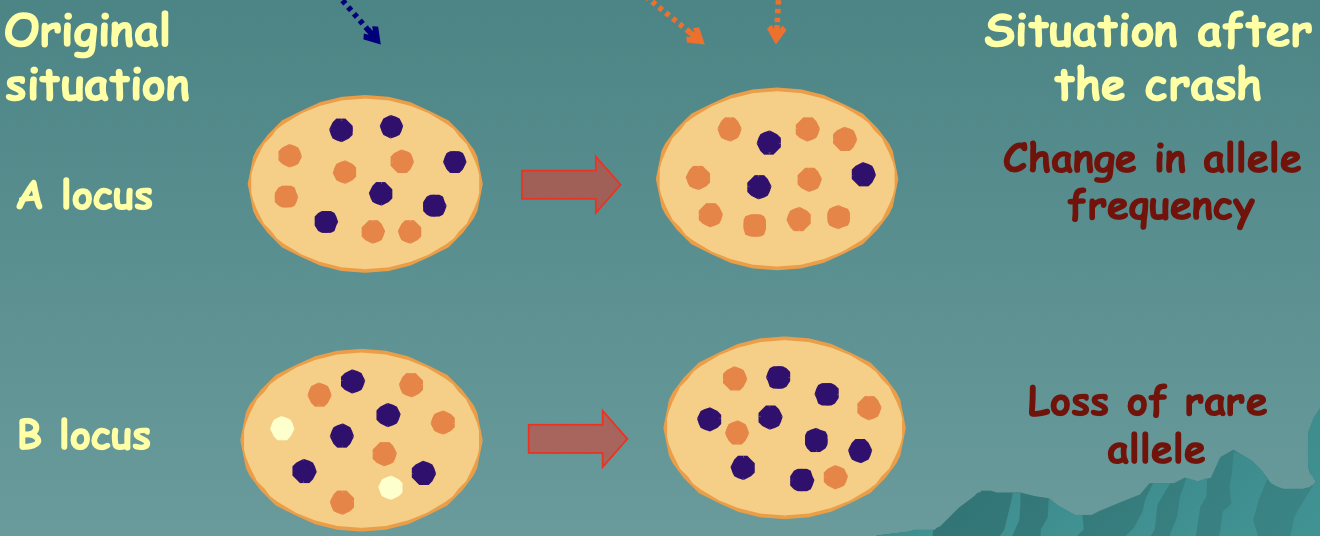
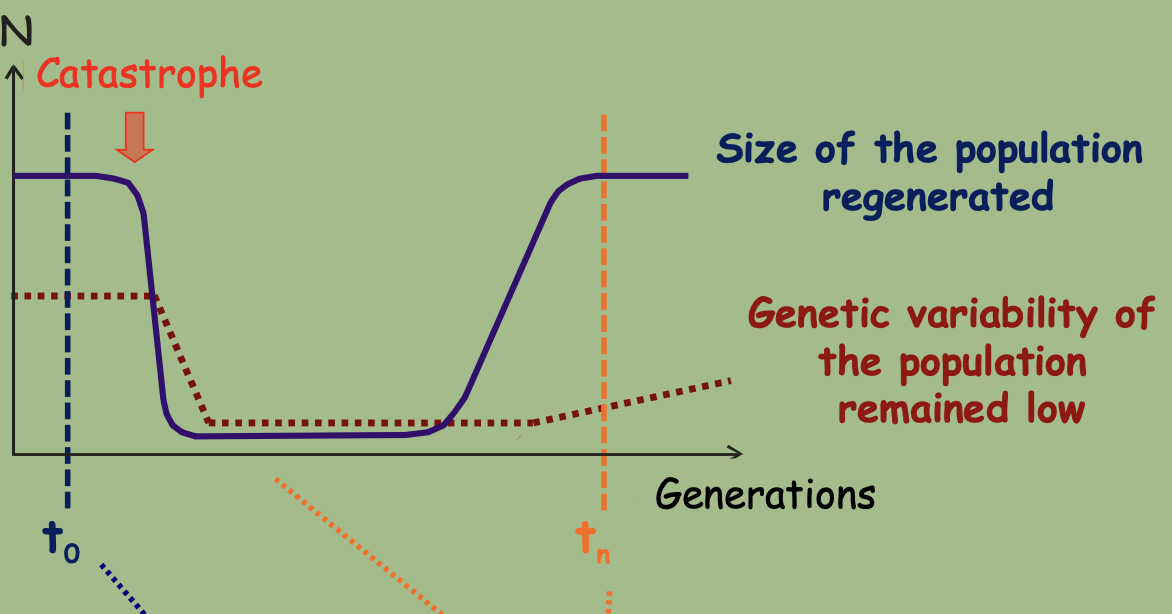
The population will have a given individual number and a given genetic variability. A catastrophe will cause a decrease in numbers leading to a decrease of genetic variability. This is also a random effect.
* Ex: Cheetah, Northern elephant seal
* Ex: Cheetah, Northern elephant seal
62
New cards
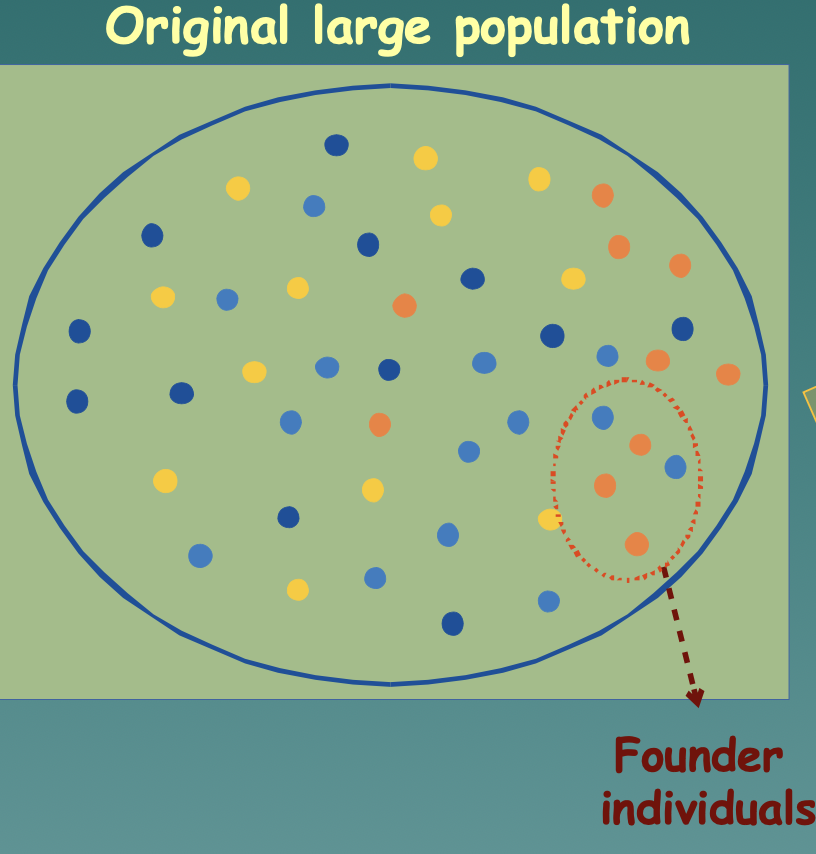
Founder Effect
A new habitat becomes available, and individuals that move there experience lower amounts of genetic variation (allele loss)
* Grey Fox → Channel Island Fox
* Amish population
* Grey Fox → Channel Island Fox
* Amish population
63
New cards
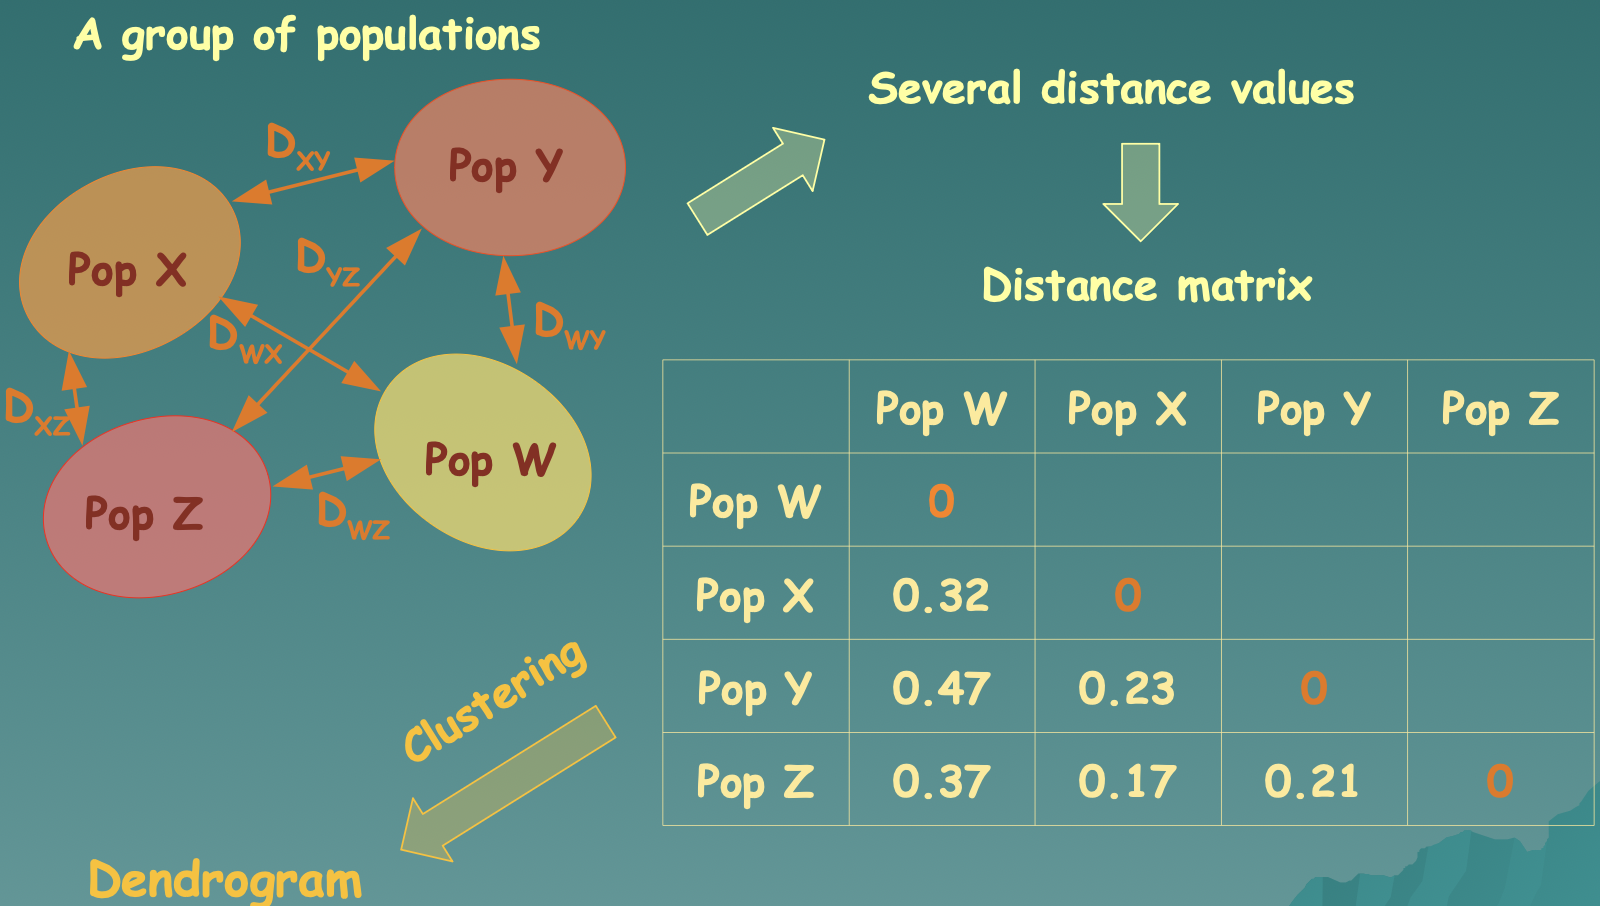
Genetic distances
* A way to measure genetic differentiation
* Several ways to calculate this, based on allele frequency data between pairs of populations
* Several ways to calculate this, based on allele frequency data between pairs of populations
64
New cards
Fixation Index
* A way to measure genetic differentiation
The fixation index (Fst) is a measure of population differentiation due to genetic structure. Fst values range from 0 to 1, with higher values indicating greater genetic differentiation between populations.
The fixation index (Fst) is a measure of population differentiation due to genetic structure. Fst values range from 0 to 1, with higher values indicating greater genetic differentiation between populations.
65
New cards
The Effect of Mutation on Fitness
\
66
New cards
Types of mutations
Gene mutation (substitution), Gene duplication, Chromosome mutation, Genome mutation
67
New cards
Gene mutation (substitution)
A permanent alteration in the DNA sequence that makes up a gene. Substitution is a type of gene mutation where one nucleotide is replaced by another. Substitutions can be missenense (-, due to proline), silent (0, due to serine), or nonsense (null, due to stops), or frameshift (0, due to valine)
68
New cards
Gene Duplication
A gene is duplicated to produce two or more copies of the same gene. This can occur through various mechanisms such as unequal crossing over, retrotransposition, and chromosomal duplication.
69
New cards
Chromosome mutation
Any change in the structure or number of chromosomes in an organism's cells.
* Inversion- when a segment breaks off and reattaches within the same chromosome, but in reverse orientation
* Translocation- When a piece of one chromosome breaks off and attaches to another.
* Chromosome fusion- When telo- and acrocentric chromosomes fuse by their centromeres
* Inversion- when a segment breaks off and reattaches within the same chromosome, but in reverse orientation
* Translocation- When a piece of one chromosome breaks off and attaches to another.
* Chromosome fusion- When telo- and acrocentric chromosomes fuse by their centromeres
70
New cards
Genome mutation
A change in the DNA sequence of an organism's genome.
71
New cards
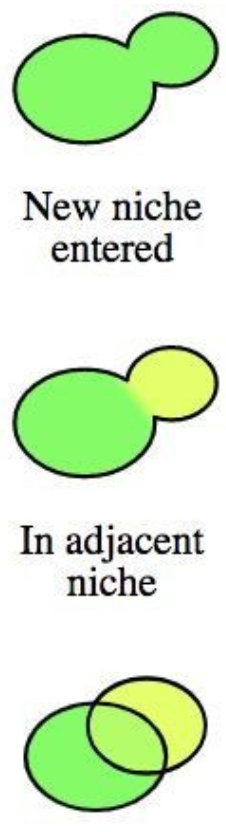
Niche-selection
When a habitat is heterogeneous with different patches and individuals living in several patches. The individuals migrate among habitat patches, decreasing genetic differences
72
New cards
Selection coefficient (s)
The intensity of selection acting against the genotype (s + w = 1)
73
New cards
1. Precambrian
* Oldest: 3.5 billion years ago
* Just prokaryotes – Archaea colonies (Endosymbiont theory)
* Just prokaryotes – Archaea colonies (Endosymbiont theory)
74
New cards
2. Cambrian
* 10 million years ago
* Marine animals w/ solid skeleton appeared
* Arhtropoda, Brachiopoda, Mollusca, Echinodermata, Agnatha
* Marine animals w/ solid skeleton appeared
* Arhtropoda, Brachiopoda, Mollusca, Echinodermata, Agnatha
75
New cards
3. Ordovician
* Ozone layer
* First terrestrial organisms: spores and sporangia of plants related to recent liverworts
* First terrestrial organisms: spores and sporangia of plants related to recent liverworts
76
New cards
4. Silurian
Small vascular plants, their sporangia sat on short, leafless, dichotomically branched stems, had no real roots
77
New cards
5. Devonian
* First terrestrial arthropods
78
New cards
6. Carboniferous
* Extensive forests on land: tree-sized ferns, ground pines,horse-tails → carbon-age coal deposits
* Amphibians
* Amphibians
79
New cards
7. Permean
* Amphibians have been pushed back into wet habitats,reptiles have spread
* First mammalian reptiles
* First mammalian reptiles
80
New cards
8. Mesozoic
(Triassic, Jurassic, Cretaceous)
* Species considered as the first mammal
* Marsupials,placental at the end of the Cretaceous
* Species considered as the first mammal
* Marsupials,placental at the end of the Cretaceous
81
New cards
9. Cenozoic
* Diversification: angiosperms, insects, birds
* Adaptive radiation: snakes, mammals, teleost fish
* Adaptive radiation: snakes, mammals, teleost fish
82
New cards
10. Tertiary
* Antarctica has moved to the South Pole, glaciated →breaking evolutionary relationships (e.g. marsupials)
83
New cards
11. Quaternary
* Glacial periods
* Megafaunal extinction
* Megafaunal extinction