Monitoring cell growth
1/11
There's no tags or description
Looks like no tags are added yet.
Name | Mastery | Learn | Test | Matching | Spaced |
|---|
No study sessions yet.
12 Terms
Why is monitoring cell growth important?
Monitoring cell growth is important for diagnosing cancer (abnormal growth), treatment response (most drugs inhibit), identify new drug targets, and develop personalised treatment plans (isolate patient cells and test).
What two ways can drugs act in regards to cancer?
There are 2 different ways a drug can act in regards to cancer;
Cytostatic - cell cycle arrest, little to no programmed cell death.
Cytotoxic - cell cycle exit, apoptosis and necrosis.
Cytotoxic treatment causes tumours to shrink, whereas cytostatic causes them to stay the same/grow slower.
What is quantifying cell numbers?
One way to measure cell growth is to simply quantify the cell number before and after treatment. This can be done manually with a hemocytometer or via staining the cells then quantifying after by solubilising the dye (how deep the colour is = more cells). However, looking at numbers is not looking at the cell cycle - cell number increased by proliferation but lost due to decreased adhesion or lower survival.
Quantifying the cells with dye does not tell you much by itself - cancer cells have so much DNA damage that they are always apoptosing so it is difficult to monitor treatments/factors that affect it.
What is FACs analysis?
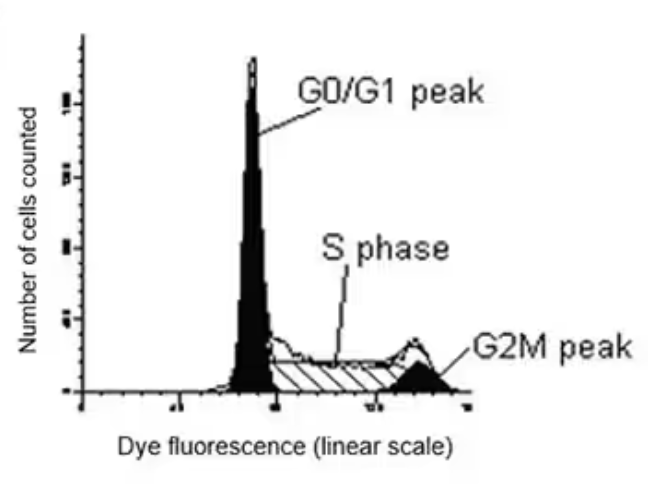
FACs analysis is fluorescent probes added to measure DNA in a stoichiometric manner. Probe molecules bound to DNA are proportional to the number of chromosomes. You can look at diploid cells (G0/G1 - most probe bound), cells synthesising DNA(S - least amount as each cell has variable amount of DNA) and cells pre-mitosis (G2/M). Propidium iodide intercalates between DNA bases. DAPI is bound to dsDNA in AT clusters.
Cell death could cause less than the normal amount of DNA staining.
In order to stain DNA, all the RNA must be removed with RNase.
What does FACs analysis look like in different situations?
A normal cell in the cell cycle looks like a peak in G0/1, plateau in S phase, then a small peak in G2/M. This looks the same with mutant RAS, but with a slight G1 arrest. If RTKs were inhibited, MAPK signalling is inhibited which is meant to drive cyclin D expression, thus G1/S arrest occurs - larger/wider peak at G1. This would be the same if CDK4/6 is inhibited. If chromosomal segregation is inhibited, G2/M arrest since chromosomes cannot separate during anaphase - large/wider peak at G2/M.
How do non-specific CDK inhibitors affect FACs?
Non-specific CDK inhibitors (ie: inhibit multiple CDKs) have cell line dependent effects. Since most CDKs are involved in G1/S (CDK2, 4, 6), it would be expected to cause an arrest here, but if a cell lacks Rb, then they may get a G2/M arrest. This is relevant since most CDK inhibitors today are non specific.
What is the response to CDK inhibitors?
Inhibition of CDKs does not cause cell death (cytostatic). However, given enough time, the prolonged arrest may cause a response that leads to cell death. CDK inhibitors are not used by themselves since they do not cause death, but rather in combination with other therapies.
Breast cancer is driven by oestrogen receptors. It binds to gene targets, such as cyclin D. This forms cyclin D/CDK4. CDK4 inhibitors can be used with inhibitors for oestrogen receptor activation to treat breast cancer.
What is DAPI and BrdU labelling?
The cell cycle can be studied using DAPI which stains all DNA blue. BrdU labelling (green) is when BrdU (fluorescent nucleotide) gets incorporated in DNA replication, followed by Ab binding to stain S-phase generated new chromosomes. These can be used in combination, with blue representing normal DNA and green representing cells entering S-phase.
What is the difference between FACs and BrdU labelling?
FACs allow visualisation of all cell cycle phases. BrdU/EdU is only the S phase. Both are highly quantitative but both require the cells to be fixed (only a snapshot).
What is Fucci?
Fluorescent ubiquitination-based cell cycle indicator (Fucci) allows cells to express different constructs that are naturally degraded during different phases of the cell cycle. For example, in G1 MKO-Cd1 which is red and gets broken down as cells enter the S phase. Then, mAG-Gemini in S is green. At the border between G1/S there is an orange colour and between M/G2 is white. This can be used live or on snapshots. Fucci can visualise 3D structures of cells to see how proliferation occurs over time and space - most cells are in G1, on the edge is where proliferation is occurring.
What are the advantages and disadvantages of Fucci?
Fucci allows live cell imaging, and is complex model compatible. However they are hard to quantify unless with FACs, not all cells stain or not compatible with human tumour samples, and cell lines are required that actively divide well (some cell lines do not grow quickly at all).
What is the importance of Ki67?
Ki67 is a marker for cell proliferation. It is expressed in all stages of the cell cycle, but not G0 - tell if cells are actively proliferating. It is involved in various processes related to cell division such as chromosome condensation. The more Ki67, the faster the tumour is growing - it is a good marker for treatment comparison. It is used in snapshots, but is good for histology and patient samples. It is easily quantifiable.