AP Statistics Unit 1
1/22
There's no tags or description
Looks like no tags are added yet.
Name | Mastery | Learn | Test | Matching | Spaced | Call with Kai |
|---|
No analytics yet
Send a link to your students to track their progress
23 Terms
individuals
objects that are described by a set of data; may be people, animals, or things
variable
any characteristic of an individual; can take different values for different individuals
categorical variable
places an individual into one of several groups or categories
quantitative variable
takes numerical values for which arithmetic operations such as adding and average make sense
distribution
tells us what values the variable takes and frequency
1st S in SOCS
spread: give the lowest and highest value in the dataset
O in SOCS
outliers: are there any values that stand out as unusual?
C in SOCS
center: approximate average value of the data (only an estimation)
2nd S in SOCS
shape: does the graph show symmetry or skewness?
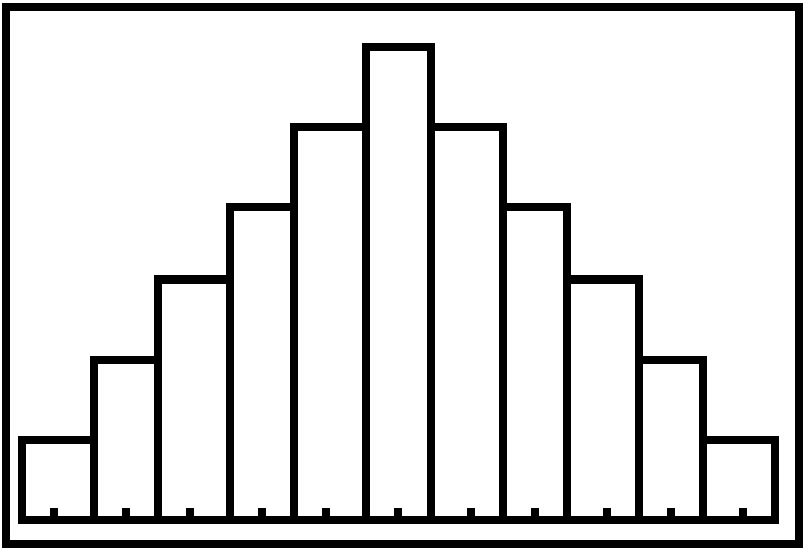
symmetric; mean = median
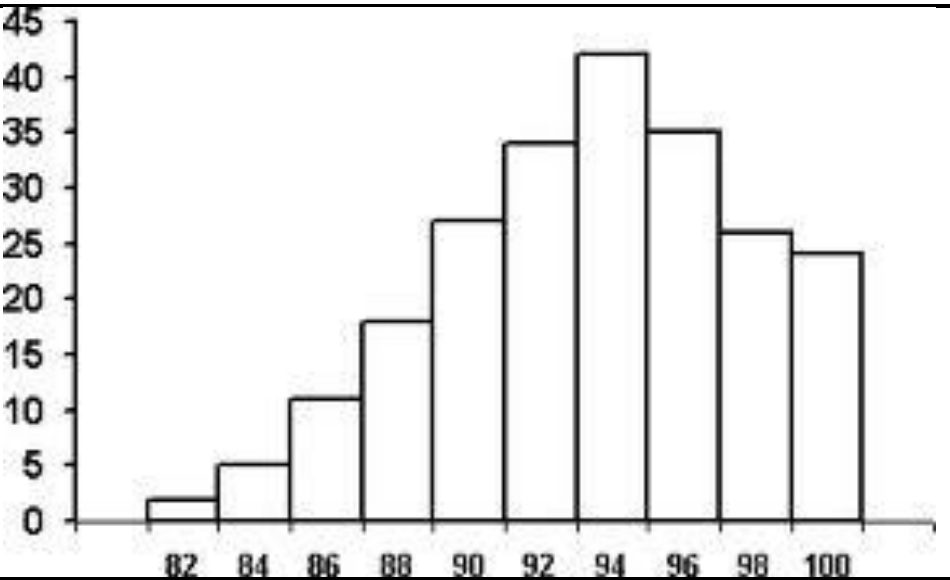
skewed left; mean < median
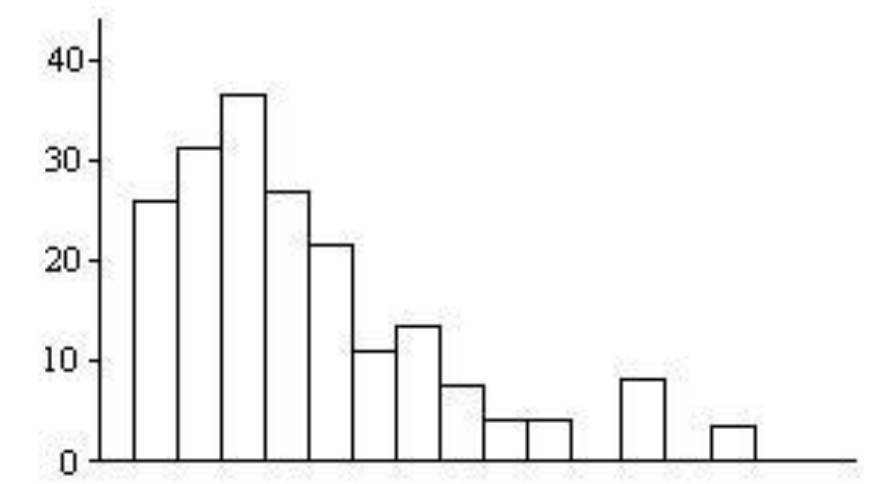
skewed right; mean > median
time plot
plots each observation against the time it was measured (time is always on the x-axis)
five number summary
minimum - q1 - m - q3 - maximum
quartiles (Q1 and Q3)
Q1: middle number of the values that are less than the median
Q3: middle number of the values that are greater than the median
IQR
interquartile range; the distance between the first and third quartiles
Outliers
the 1.5 x IQR: outlier if value is more than 1.5 x IQR below the first quartile or above the third quartile
boxplot
graph of the 5 number summary
standard deviation
S or Sx: average of the squares of the deviations of the observations from their mean
z-score
numerical measurement that describes a value’s relationship to the mean of a group of values and is measured in terms of standard deviations from the mean
percentile ranking
what percentage is less than or equal to a given value in a distribution; useful for relative position
ogive
graphical representation of the cumulative relative frequency distribution for quantitative variables
density curve
area below the curve should be 100% or 1; on or above the horizontal axis