BIS2B MT1
1/79
There's no tags or description
Looks like no tags are added yet.
Name | Mastery | Learn | Test | Matching | Spaced | Call with Kai |
|---|
No analytics yet
Send a link to your students to track their progress
80 Terms
Properties of life
order and organization
energy processing
growth and development
evolutionary change
regulation (homeostasis)
reproduction
response to stimulii
what is the smallest unit of life?
The smallest unit of life is a cell, which is capable of performing all the fundamental functions of living organisms.
what is ecology?
Ecology is the study of interactions between organisms and their environment, including relationships within and between species, as well as with abiotic factors.
biotic interactions
are interactions among living organisms, such as predation, competition, and mutualism. (bee feeding from flower)
abiotic interactions
are interactions between living organisms and non-living elements of their environment, such as temperature, water, and nutrients. (precipitation or rainfall)
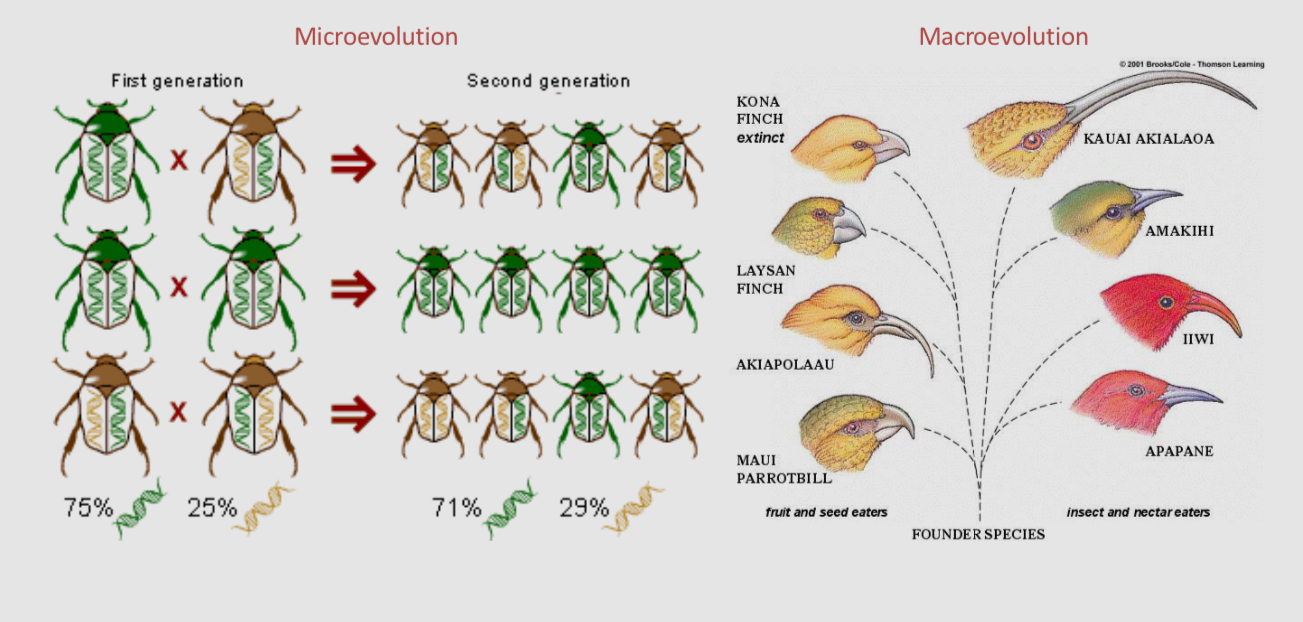
what is evolution?
Evolution is the process through which populations of organisms change over time through genetic variation, natural selection, and adaptation.
What do ecology and evolution have in common?
mate choice, natural selection, competition, phenotype, mutualism, mutation
what is biodiversity?
the variety of life on earth
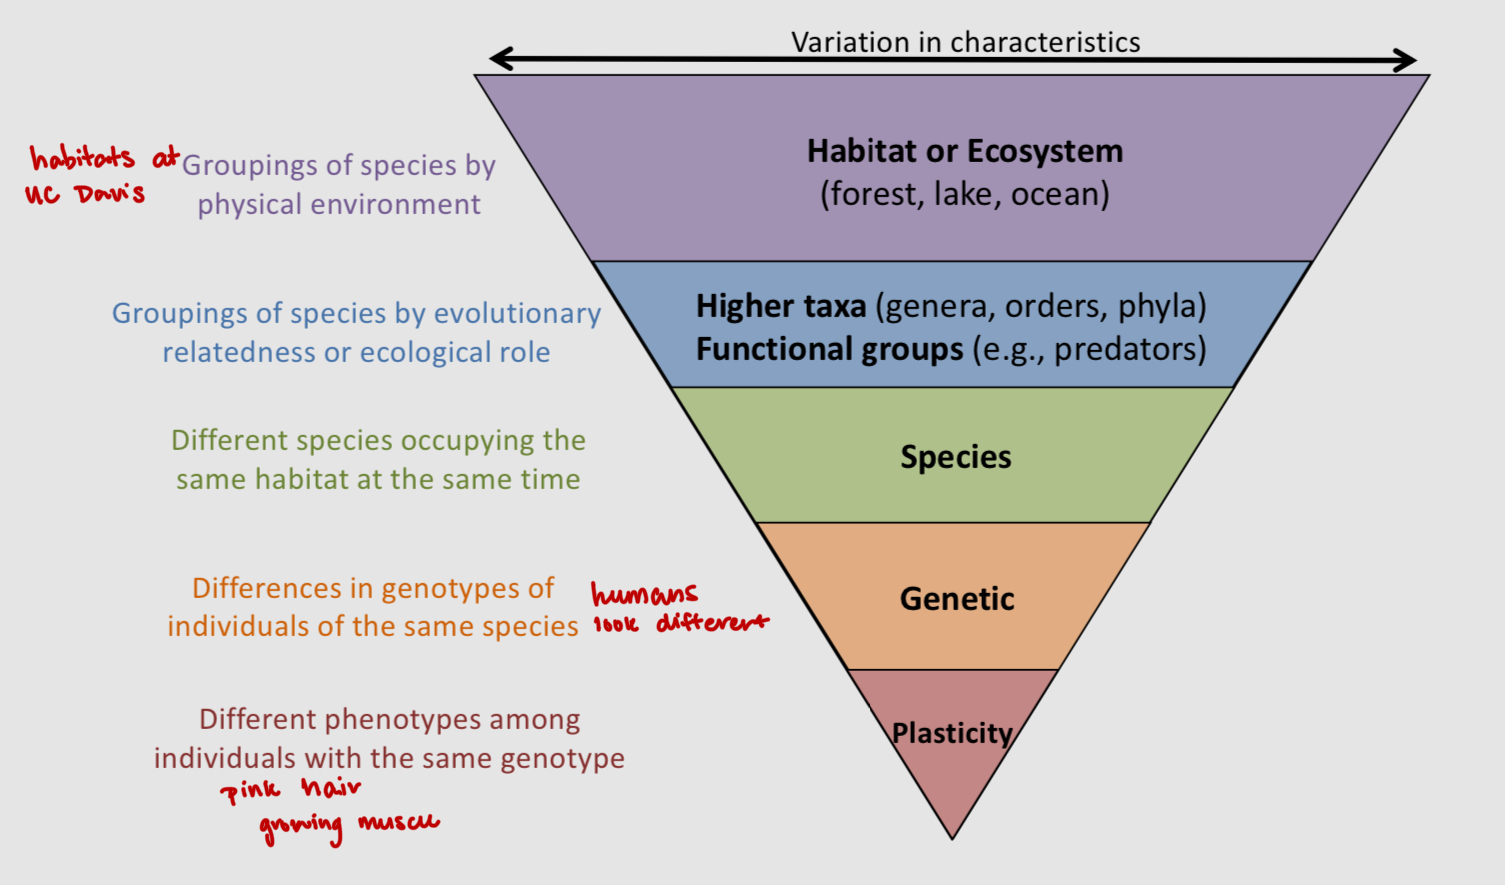
How do we organize and classify biodiversity?
Biodiversity is organized and classified using taxonomic categories such as species, genus, family, order, and higher ranks that reflect evolutionary relationships like class, phylum, and kingdom. Morphological variation widens as we climb up the categories.
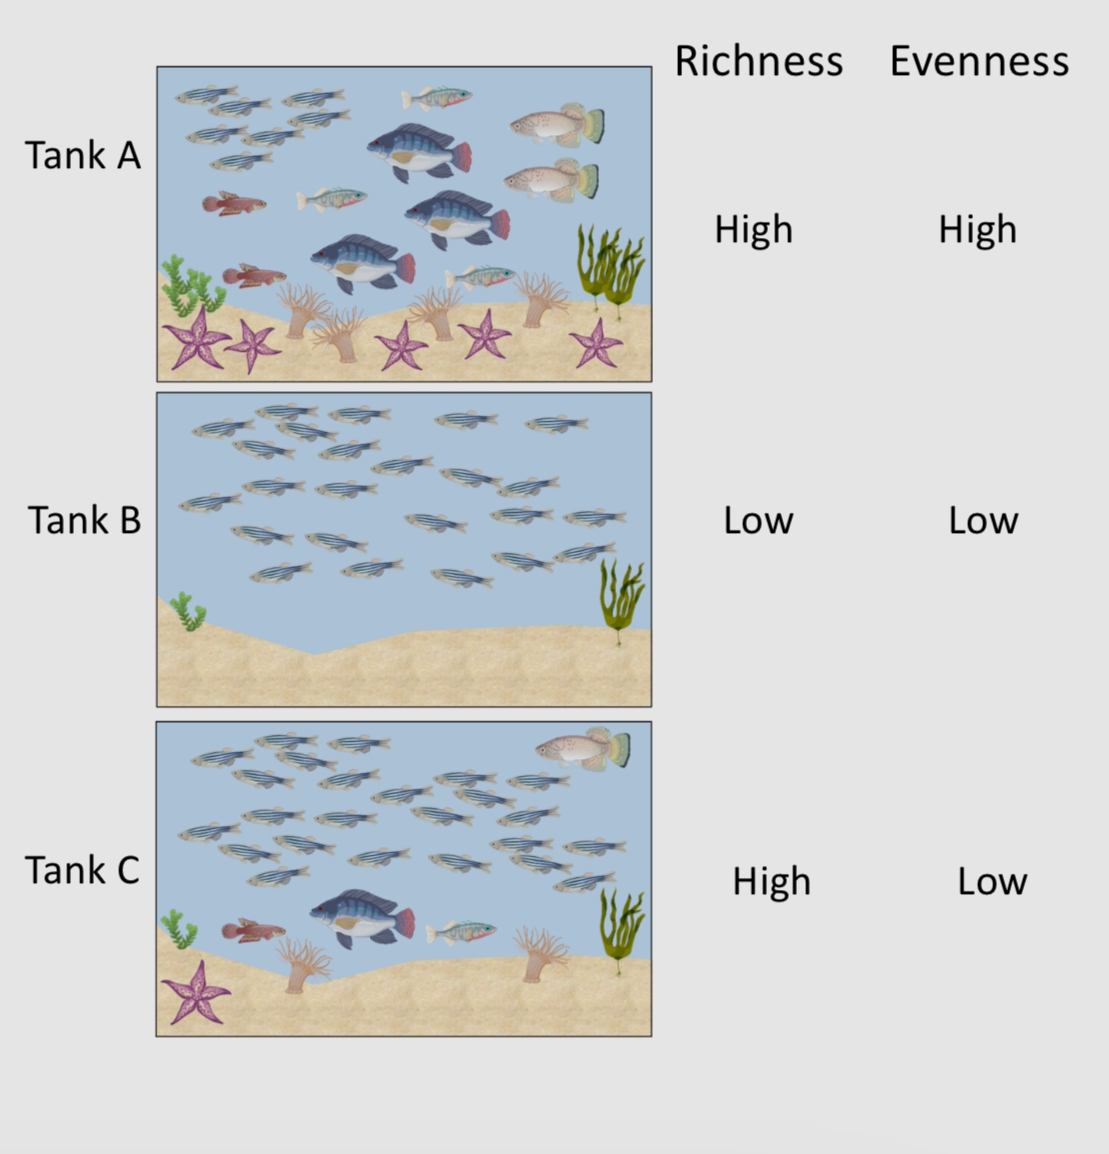
species richness
the number of different species present in a given area, contributing to overall biodiversity.
species evenness
the relative abundance of each species
species diversity example
includes both species richness and species evenness in a community, providing insights into the complexity and health of ecosystems.
biodiversity “hotspots”
places with many species that are endemic (occur in no other regions)
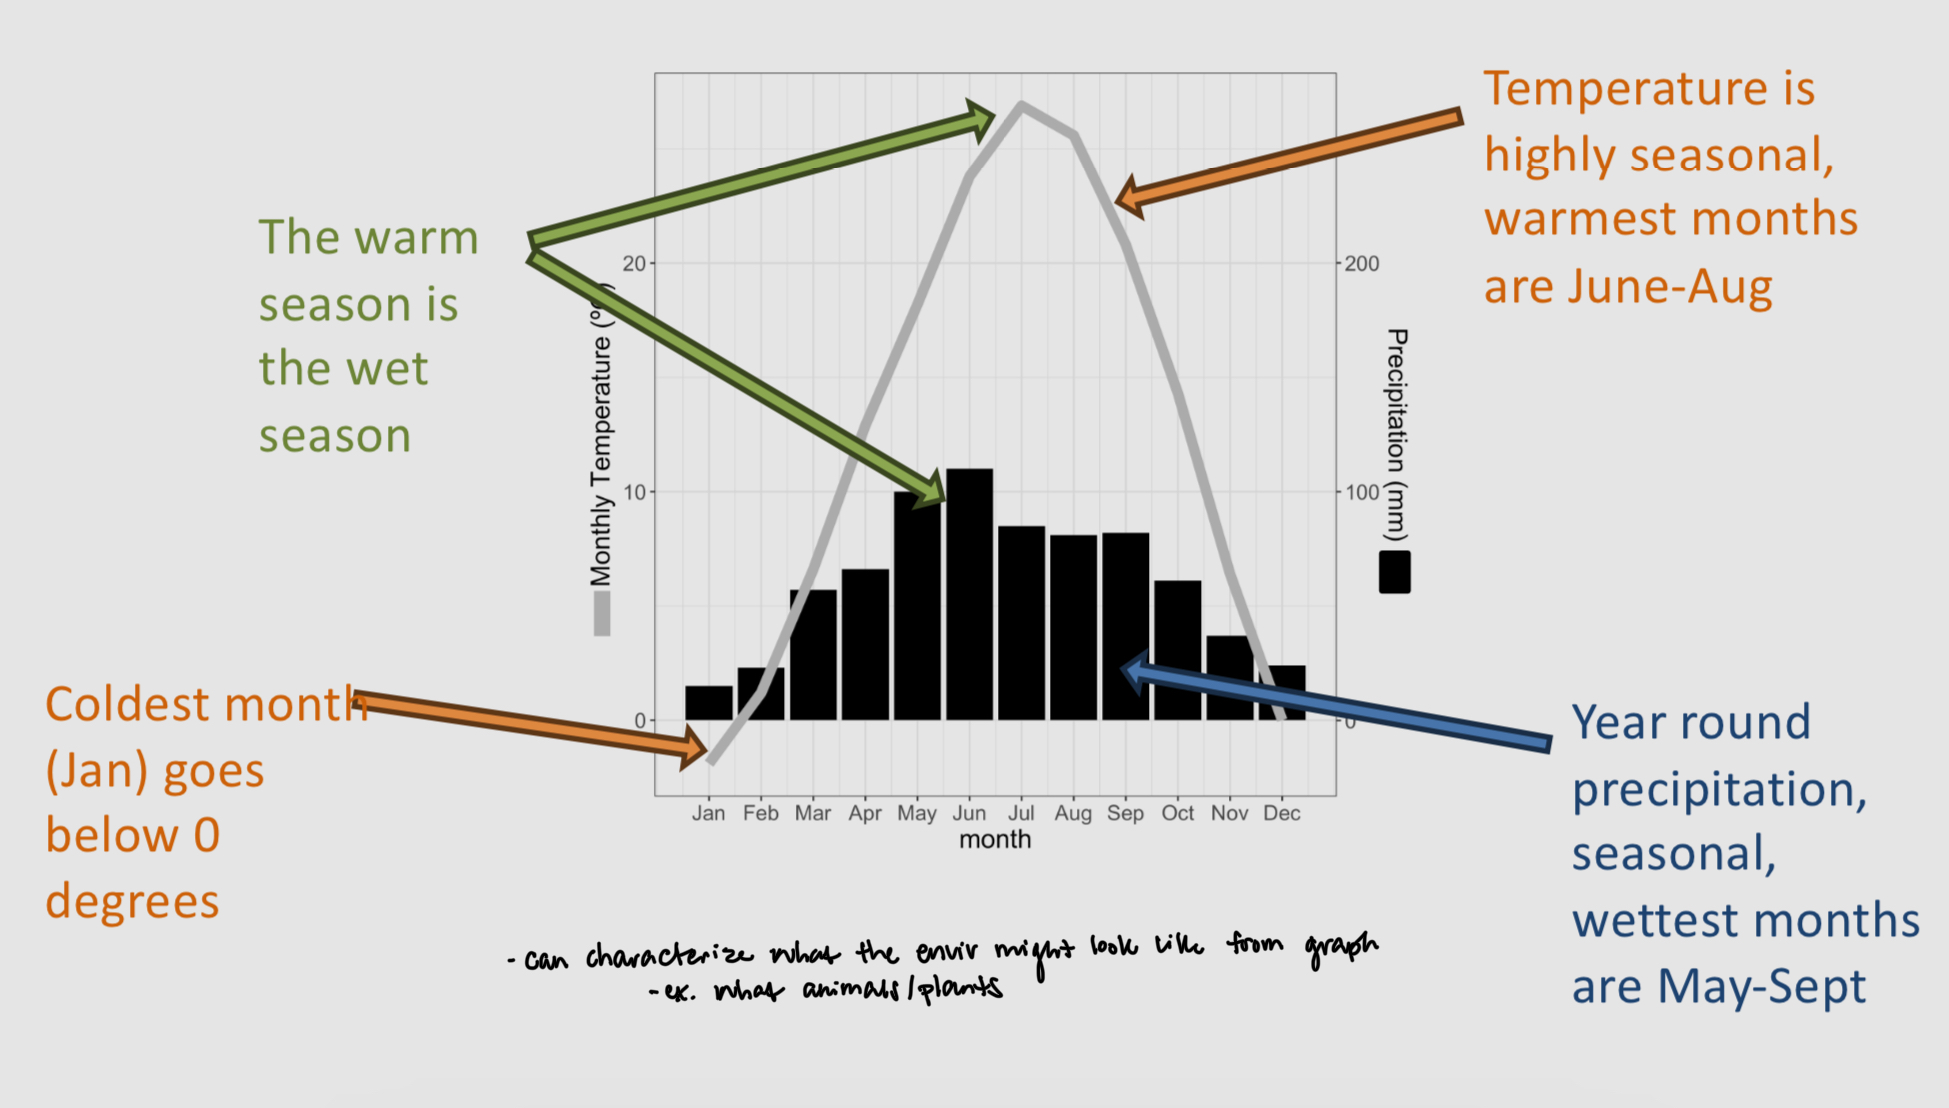
climate
average and annual variationin temperature and precipitation patterns in a region over the long-term
also a major determinant of the types of plants in an area
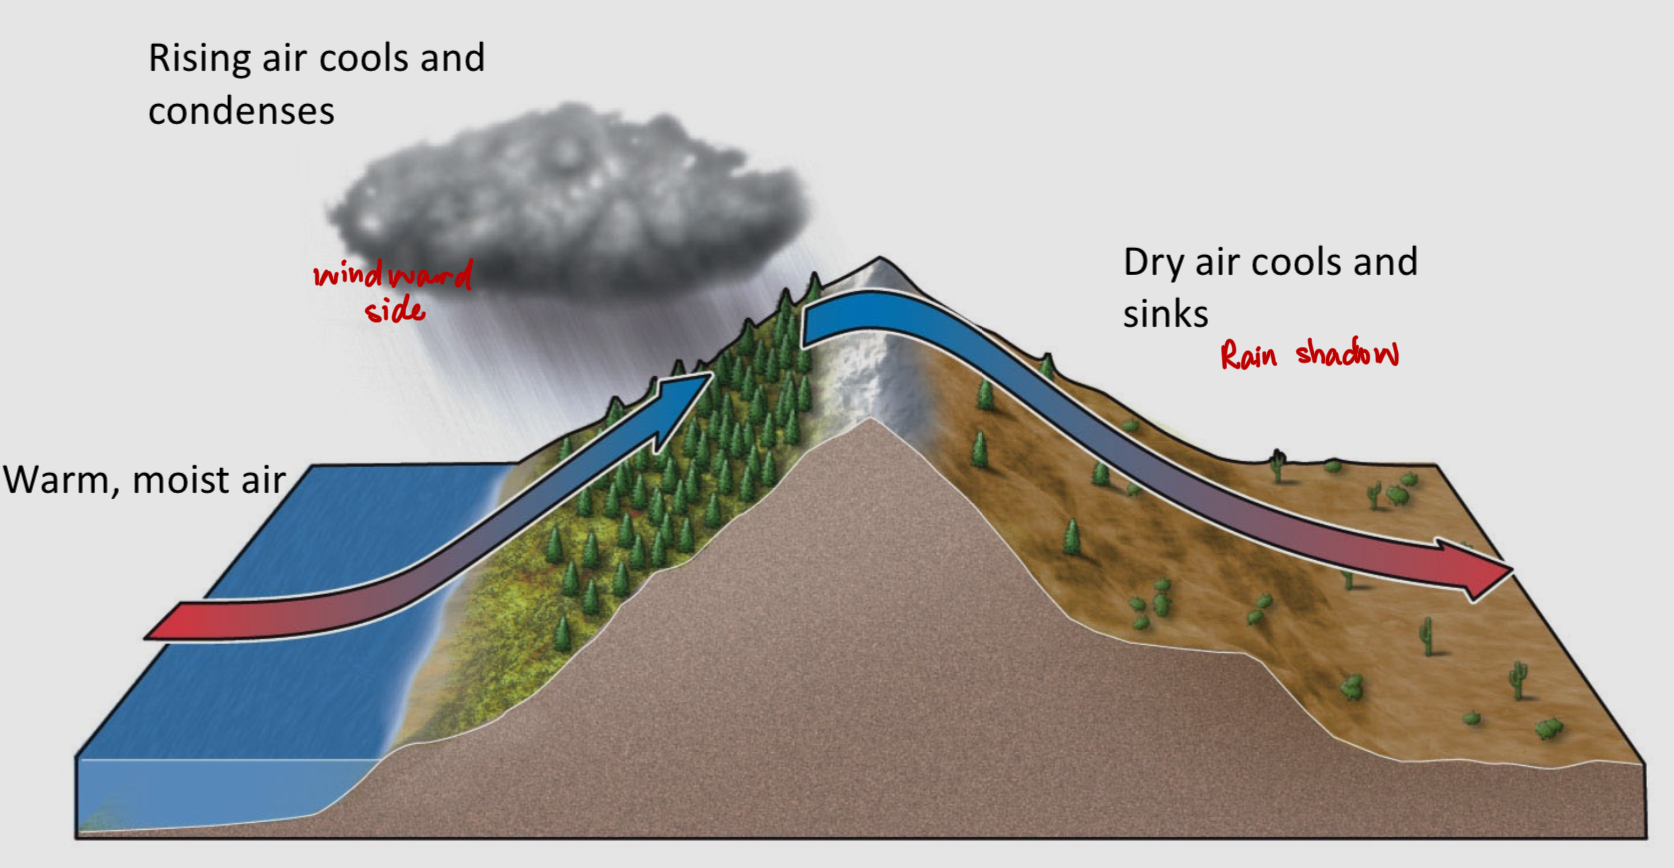
orographic uplift
air driven aloft by mountains
rainshadow
reduced rainfall in the lee of mountain ranges
regional precipitation patterns: orographic uplift and rain shadows
weather
temperature and precipitation over a short period of time (days to weeks)
climatographs
describing climate in a single graph
tradeoff
the relationship between the benefits of a trait in one context and its costs in another context
The Principle of Allocation
Each organism has a limited amount of resources it can use for all life processes: obtaining food, escaping predators and resisting pathogens, reproduction, growth and metabolic functions.
Resources allocated to one function cannot be applied to another function.
All allocation decisions result in trade-offs: allocation tradeoffs like the number of offspring and investment per offspring
Autotrophs (self-feeding)
can live exclusively on inorganic sources of carbon, nitrogen, and other essential resources
heterotrophs (other-feeding)
use organic molecules (formed by other organisms) as source of carbon, nitrogen, energy and other essential resources
photoautotrophs
use light as the energy source
photosynthesis
Liebig’s law of the minimum
growth is not determined by the total amount of all resources available, but by the amount of the resource that is most scarce compared to how much the plant needs
more roots, fewer shoots
obtain more N & water, less C
more shoots, fewer roots
obtain more C for growth, less N & water
root to shoot ratio
ratio of below ground to above ground biomass
herbivores
consume plant material — long guts, detoxification enzymes, grinding dentition
carnivores
attack and consume animal material — adaptations for pursuit and subdual prey
omnivores
consume both plant and animal matter — generalist morphologies
detritivores
consume dead plant or animal matter — adaptations to subsist on low quality food
how do generalists choose among different prey?
Effort required to capture and consume prey (costs)
search costs
relative size and mobility of predator and prey
physical defenses (spines, shells, ability to hide or escape)
defenses that are toxic or reduce digestibility
Value of the prey (rewards)
energy content
what other goals do foragers have when feeding?
avoid predators or harsh abiotic conditions
find mates or protect offspring
obtain specific micronutrients or vitamins
Adaptation
evolutionary change in genotype that maximizes performance
ex. innuit people have lived above the arctic circle for 10,000+ years: have developed barrel shaped bodies, short limbs, subcutaneous fat all over body
** the ability to acclimate is an adaptation- and it varies among species
acclimation
change in phenotype within an individual’s lifetime to maximize performance (usually reversible)
ex. world’s greatest long distance, cold water swimmer optimized at 40% body fat
endotherms
body temperature is determined primarily by metabolic energy
ex. humans, mammals
** high benefit-high cost strategy that only works when resources are predictably abundant
ectotherms
body temperature is determined primarily by external conditions
ex. reptiles
** rely on morphological and behavioral mechanisms of temperature regulation (burrow for warmth at night, use sun and rocks for warmth during the day, shade/water to cool down)
transpiration
evaporation of water through stomata
C3 photosynthesis
the most common and ancient system
conduct photosynthesis using RUBISCO enzyme in mesophyll
does well in low temp, light, and wet conditions
stomata stay open longer and much water is lost per C gained
ex. crops like wheat and rice
C4 photosynthesis
evolved later (many times); more water efficient
uses PEP carboxylase to fix carbon, allowing stomata to remain closed during heat, resulting in less water loss. Common in hot, dry environments, with crops like corn and sugarcane.
plants spatially separate uptake of CO2 and its fixation
ex. some grasses, weeds, and shrubs
inefficient at low light, temp, or wet conditions
Fundamental Niche
the set of environmental conditions (e.g. temperature, moisture, salinity) under which individuals of a species can grow and reproduce
where it could be
Realized Niche
where it is actually found
smaller than fundamental
where does it actually occur after accounting for biotic interactions (like parasites)
Probability of being eaten
P(detection) x P(capture) x P(consumption)
** reducing any of these terms reduces predation… BUT these adaptations also have costs
Avoid detection techniques
Fixed or Flexible Camouflage/Crypsis
Costs: limited mobility, tied to particular habitat types
Shelter/Burrow
Costs: reduced feeding time, energy spent maintaining shelter
Avoid capture
herding together
reduced predator efficiency, cooperative defense
costs: energy spent on group coordination, increased competition for resources
Avoid consumption
Plants cannot avoid detection or capture
chemical defenses (foxglove; cardiac glycoside)
physical defenses (raspberry thorns)
Slow/obvious animals are easy to catch
sea slug (toxins)
pangolin (armor)
Other costs of defense
fast growing plants are more susceptible to herbivores
Semelparous
organisms that reproduce once and then die
ex. lobelia telekii
harsher environment
iteroparous
organisms that reproduce many times
ex. lobelia keniensis
R-selected “fast”
many, small highly dispersed offspring
small body size
short life, early reproduction
allocate to rapid growth and high reproduction
little parental care
semelparity (reproduce one time before death)
K-selected “slow”
fewer, higher quality offspring
large body size
long life expectancy, delayed reproduction
allocate to defense, persistence
high parental care and investment
iteroparity (reproduce many times before death)
Environmental: r-selected
environmental conditions keep populations at low density
habitat is
unpredictable, variable
harsh, distured
mortality is independent of other organisms and often catastrophic
Environmental: k-selected
environmental conditions allow populations to reach high density
habitat is
predictable
favorable for growth & survival
mortality is often caused by interactions with other organisms
Population
collections of organisms of the same species living in the same place at the same time are called a population
Rate of change in population size over time
dN/dt = (b-d + i-e) * N
N = population size
t = time
b = birthrate
d = death rate
i = immigration rate (come)
e = emigration (leave)
open population
numbers change due to immigration and emigration from outside the population in addition to births and deaths
closed population
numbers change only due to births and deaths
per-capita growth rate (r)
b-d = (birth rate - death rate) = the (r)
closed system population growth equation
dN/dt = rN
Integrate from 0 to time t to predict population size at time t:
Nt = N0 e^(rt)
Nt = # at time = t
N0 = # at time = 0
e = 2.717 (base of natural long or ln)
r = per capita growth rate (b-d)/intristic rate of increase
t = time
doubling time
time required for population to increase by 100% (double in size)
** bigger r = smaller doubling time
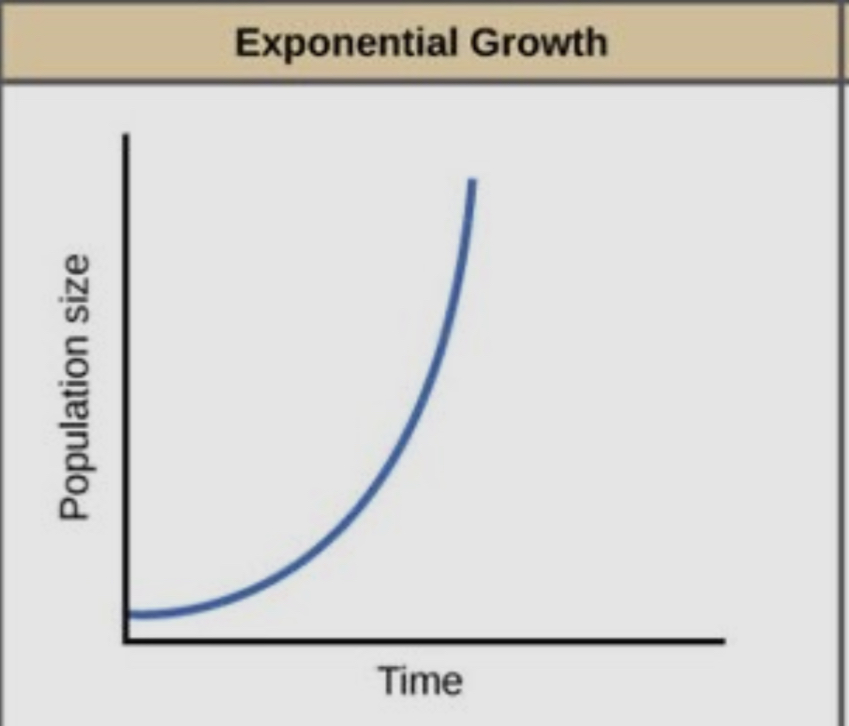
Exponential
the per-capita growth rate is constant or density independent
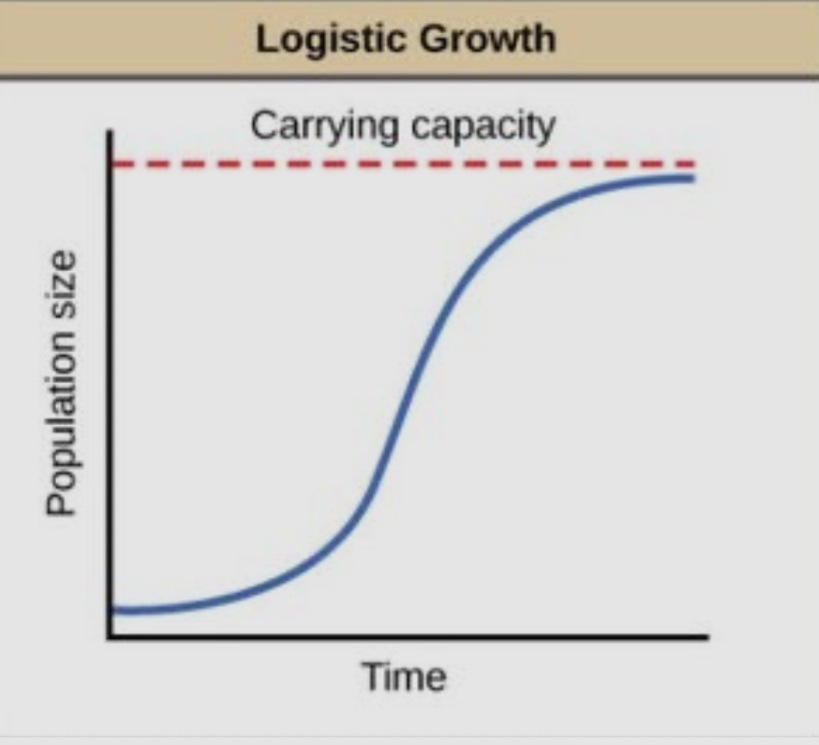
logistic (asymptotic or sigmoidal)
the per-capita growth rate varies with population density or is density dependent
density independent limitations
agent of mortality is not triggered by population density
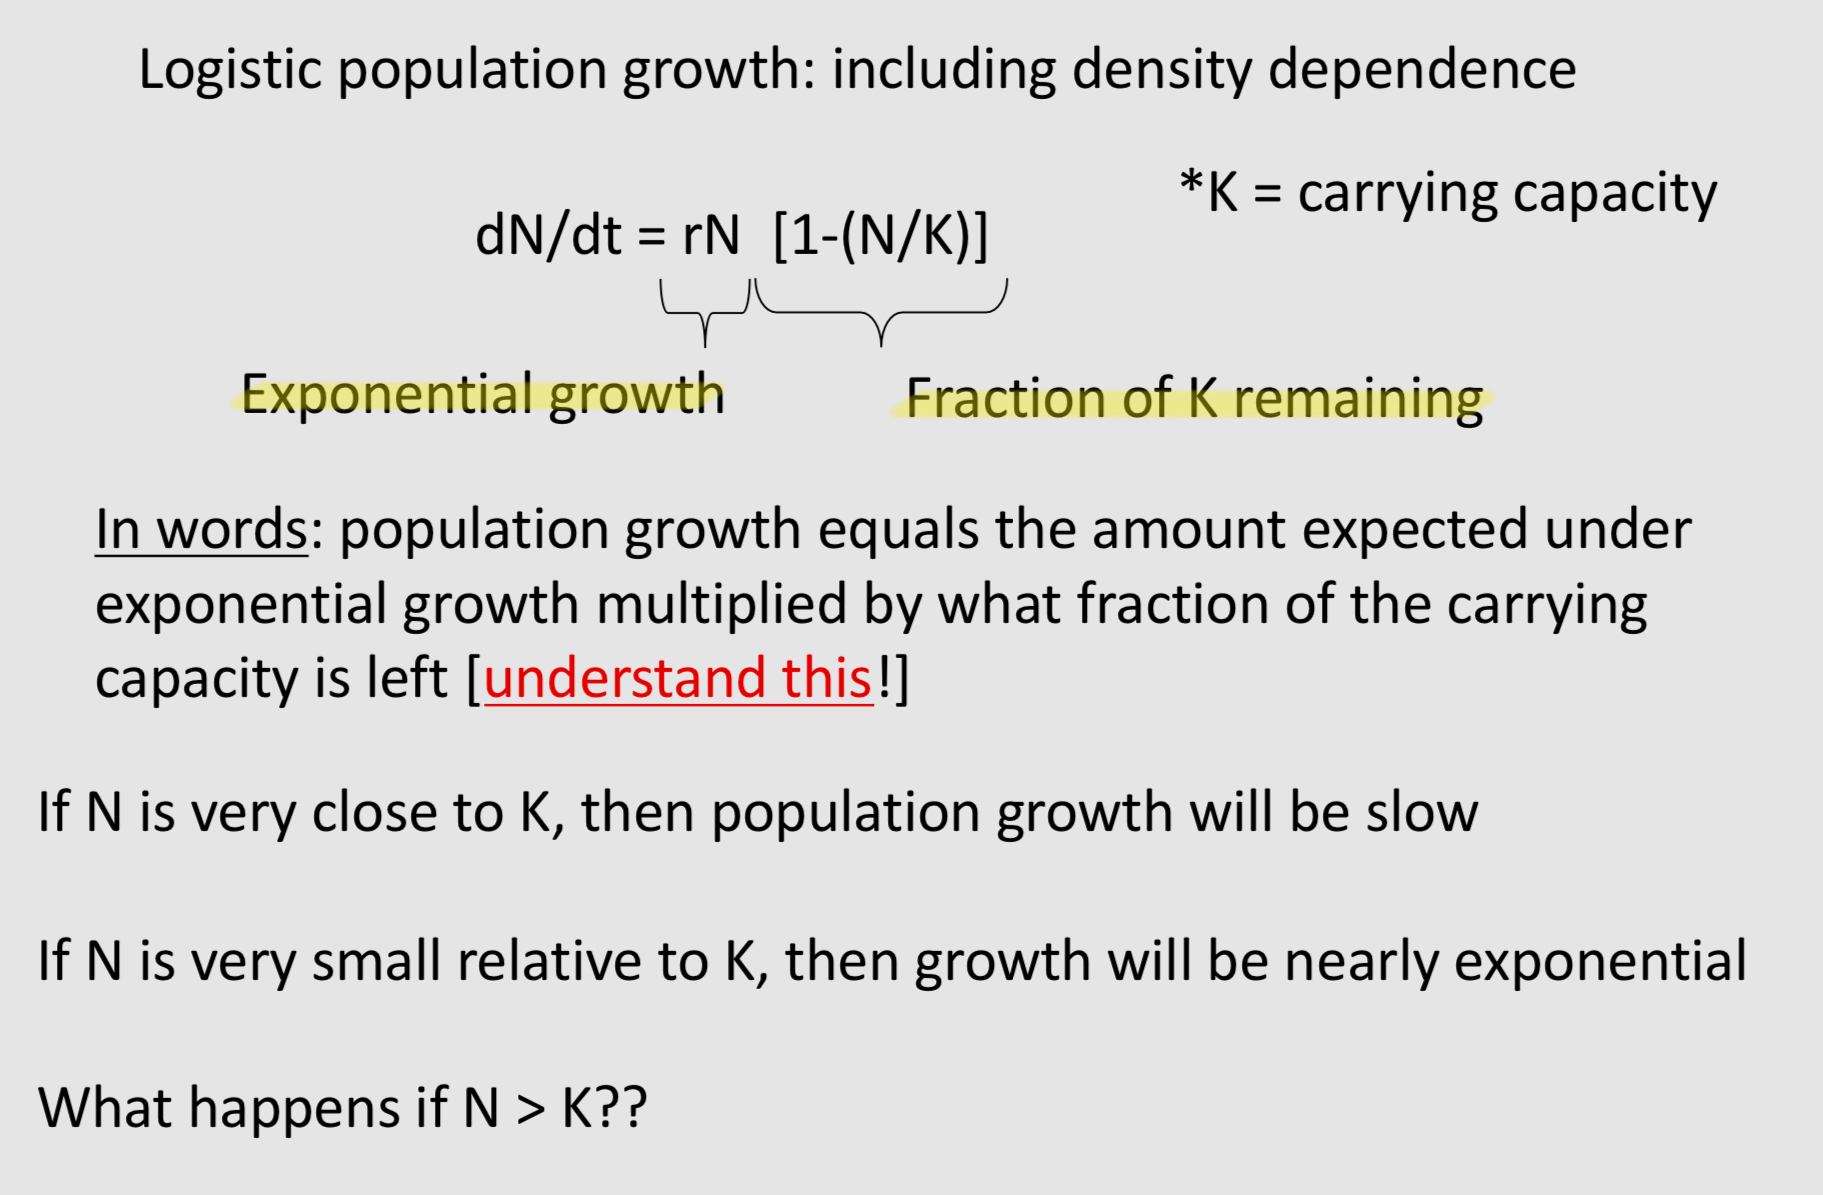
density dependent regulation
per individual birth and death rates depend on density
ex. competition for resources, predation, starvation, disease, weather
carrying capacity (K)
the maximum population size that can be supported by available resources or physical space
logistic population growth: including density dependence
Demography
a study of the vital statistics (birth, death) of a population and how they vary with age
life table
vital statistics of a cohort (group of individuals born about the same time
direct method: follow a cohort through time
indirect method: determine the age of death from remains (skulls, etc)
survivorship (lx)
proportion of individuals surving to age or stage x
Type I survivorship curve
low mortality until the latter stages of life (humans, large mammals, dinosaurs?)
Type II survivorship curve
probability of surviving to the next year is independent of age (birds)
Type III survivorship curve
high juvenile mortality but low adult mortality (most common, most invert, plants)
fecundity (mx)
average number of offspring produced by individual of age x
Net reproductive rate (R0)
average number of offspring produced by an individual during its entire lifetime
** R0 = the product of survival and fecundity, summed over all age classes = S lxmx
r=0
stable population age distribution given by the survivorship curve lx
r>0
growing populations have an excess of individuals in younger ages
r<0
decreasing populatios have an excess of individuals in older ages
lowered rates are:
optimal because of the competitive environment in which offspring are raised
a consequence of non-genetic (cultural) mechanisms of inheritance
a maladaptive by-product of rapid environmental change that has no adaptive value