Consumer Surplus-Micro Theory
1/11
There's no tags or description
Looks like no tags are added yet.
Name | Mastery | Learn | Test | Matching | Spaced | Call with Kai |
|---|
No analytics yet
Send a link to your students to track their progress
12 Terms
What is the equation for consumer surplus?
Consumer surplus = what you're willing to pay minus what you actually pay. In other words, consumer surplus is your net gain from trading.
How do we measure utility in consumer surplus?
We measure the utility from trade (consumer surplus) through dollar amounts. (i.e.- if your willing to pay $20 for a burrito bowl but you pay $17, then your consumer surplus is $3).
What is a reservation price?
This is the price your willing to pay.
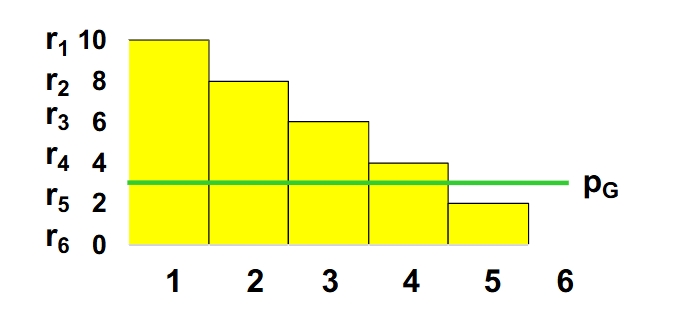
What is the reservation price curve?
This is the price curve used to identify different levels of reservation prices at different quantities, assuming that the price per quantity is constant. Anything above the Pg line is the consumer surplus.
Why is the consumer surplus above the price per quantity line? Would you be willing to purchase additional units of a good if it’s below the per per quantity line?
Consumer surplus is above the price per quantity line because you aren’t able to purchase the good if the amount you're willing to pay is less than the price per quantity.
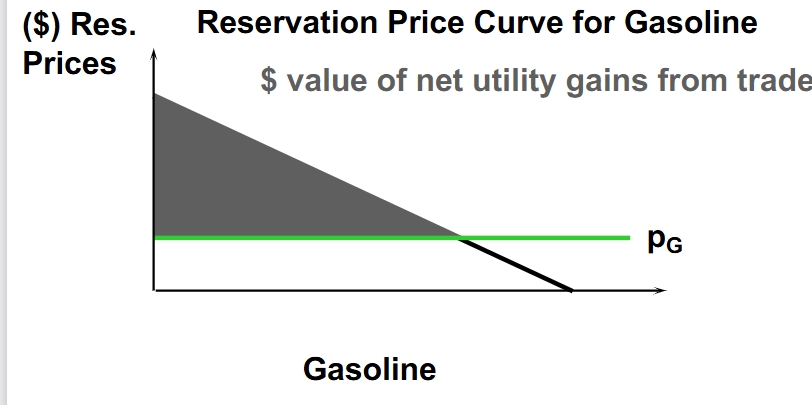
Does consumer surplus mirror the ordinary demand curve?
It will usually mirror the ordinary demand curve because demand follows the price your willing to pay as well.
If the price of a quantity increases by a certain amount, will you have lost consumer surplus by that same amount?
No, you will lose less consumer surplus than the amount that the price increased by if the consumer’s willingness to pay is within the price range.
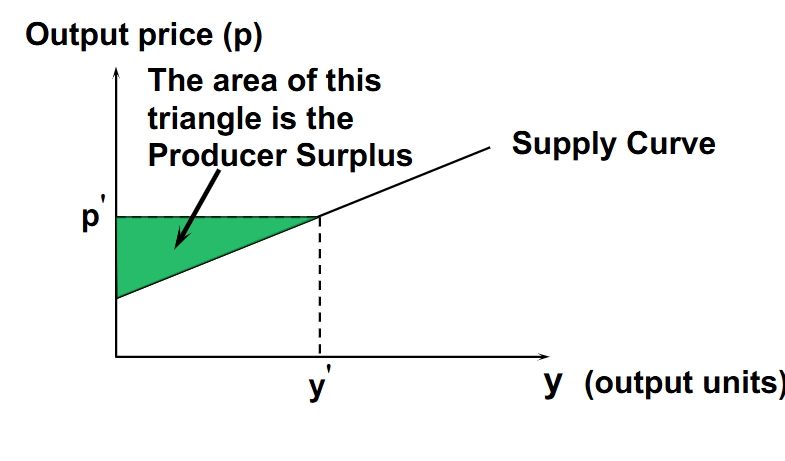
What is producer surplus? What is the equation for producer surplus?
Producer surplus is the producer’s gains from trade. The equation for producer surplus is PS= How much the producer receives minus the amount they are willing to sell for.
How is producer surplus represented graphically?
Producer surplus is the green triangle that is above the supply curve. This is because the output price is represented by p’- this is the amount that the producer receives at different levels of output. The supply curve measures the relationship between the cost to produce and how much is produced, so consumer surplus must be the area between p’ and the supply curve.
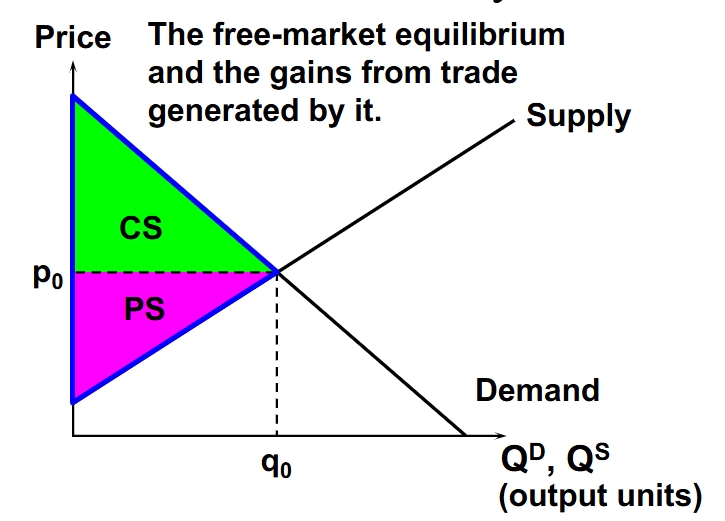
How is the free-market equilibrium represented graphically?
The green represents consumer surplus because it shows that the consumer is willing to pay for higher prices until p is reached. The magenta represents producer surplus because it shows PS as the output paid for and how much sellers receive until p is reached.
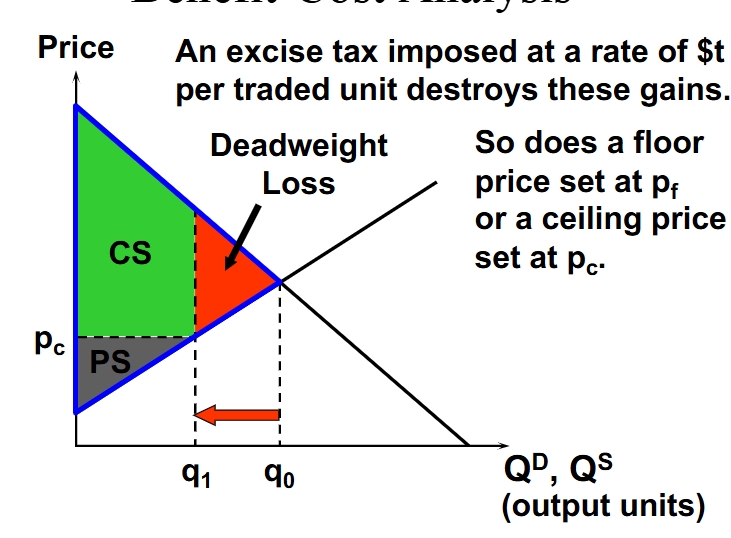
What would happen if the government imposed a regulation that forced the price of a good to rise ?
This would cause a deadweight loss, as producer surplus would rise and consumer surplus would decrease, producers wouldn’t be able to sell more than a certain quantity as a result of consumers not wanting to purchase a certain quantity.
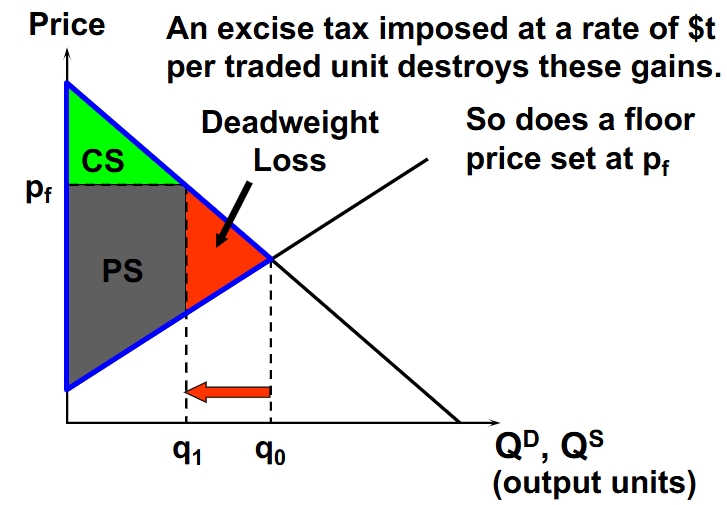
What would happen if the government imposed a regulation that forced the price of a good to decrease?
This would still cause a deadweight loss, as producer surplus would fall and consumer surplus would rise. Producers aren’t willing to sell the amount of goods that the consumer would be willing to purchase.