Kinetics
Kinetics
- How quickly something happens (PharmD and the rate of a release of a drug from a capsule)
- Rate is how quickly something is performed.
- In a chemical reaction, as it proceeds, initially reactants are turning into products
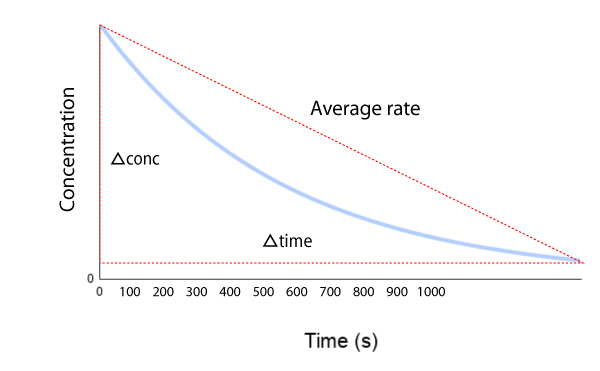
- The graph of these initial changes are:
- In words, the rates can be expressed as:
- the formation of products/time
- or disappearance of reactants/time (-ve sign)
- The change in reaction rate per time is most commonly expressed as:
- Change in conc/unit time in mole dm^-3s^-1
- This can be taken from a tangent to a curve off of a graph at several points with reference to the time.
- Sometimes the disappearance of reactants per time are at different rates which can be seen in graph form and is indicated by A and B and their coefficients in a chemical equation:
- 2A + B → C
- The shape of curve indicates that the rate of a reaction is not constant during the reaction but is fastest at the start and slows down as the reaction proceeds.
- The change in rate has to do with the effects of the change in concentration.
- We measure initial rates by drawing a tangent to the graph at t=0
- As a reaction proceeds, the slope of a concentration time graph decreases.
Ways to measure rates of reactions
- Change in volume
- Change in mass
- Change in light transmission (spectroscopy)
- Change in concentration using titration to stop it (quenching)
- Change in conductivity (graphed)
- Change in color (clock reactions)
Example
| Experiment | [NO(g)] mol dm^-3 | [CO(g)] mol dm^-3 | [O2(g)] mol dm^-3 | Initial rate / mol dm^-3 s^-1 |
|---|---|---|---|---|
| 1 | 1.00x10^-3 | 1.00x10^-3 | 1.00x10^-1 | 4.40x10^-4 |
| 2 | 2.00x10^-3 | 1.00x10^-3 | 1.00x10^-1 | 1.76x10^-3 |
| 3 | 2.00x10^-3 | 2.00x10^-3 | 1.00x10^-1 | 1.76x10^-3 |
| 4 | 4.00x10^-3 | 1.00x10^-3 | 2.00x10^-1 | 7.04x10^-3 |
Rate = k[NO]^2[H2]
| Experiment | Initial [C4H9Br] / mole dm^-3 | Initial [OH-] / mol dm^-3 | Initial rate of reaction / mol dm^-3 min^-1 |
|---|---|---|---|
| 1 | 0.010 | 0.010 | 2.0x10^-3 |
| 2 | 0.020 | 0.010 | 4.0x10^-3 |
| 3 | 0.020 | 0.020 | 4.0x10^-3 |
Determining the value of rate constant “k”
Rate = k[C4H9Br]
.002M/min = k(.01M)
.002/.01 = k
K = 0.200/minute
H2 + NO → X fast
X + NO → Y + H2O slow
Y + H2 → N2 + H2OZ fast
Rate = k[NO]^2[H2]