WEEK 4: MEASURES OF CENTRAL TENDENCY
1/22
There's no tags or description
Looks like no tags are added yet.
Name | Mastery | Learn | Test | Matching | Spaced |
|---|
No study sessions yet.
23 Terms
This refers to the center of the distribution of observations
Measures of Central Tendency
What are the 3 common measures of central tendency?
Mean
Median
Mode
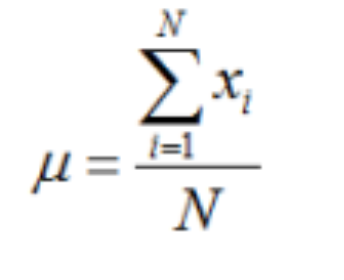
Population Mean
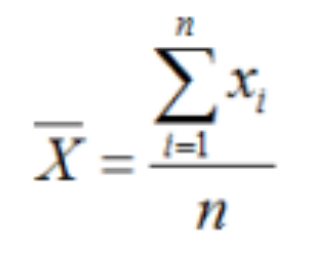
Sample Mean
Mean is also known as?
Average
This is sensitive to extreme observations
Involves all observations in its computation
Any change in the observation will change the mean value
Quantitative
The sum should always be zero because it is the point of balance
Mean
This is the middle most value in a set of observations put in an array
Not influenced by outliers
Always exists and unique
Can be used for qualitative and quantitative
Median

Median
TRUE OR FALSE:
If the median is odd, we pick the middle most observation
TRUE
TRUE OR FALSE:
If the median is even, get the mean of the 2 middlemost observations
TRUE
Most frequently occurring value in a set of observation
An observation can have none of this, unimodal, bimodal, or multimodal
No calculations are needed
Determined for any type of variable
Mode
What are the 3 common measures of dispersion?
Range
Variance
Standard Deviation
Coefficient Variation
Gives information as a tendency of values to clump together tools describing the variability of the observations
Can be homogeneous or heterogeneous
For qualitative variables only
Measures of Dispersion
Simplest measure of location
Does not tell anything about the observation between these two extreme observations
May be used for quantitative variables
Range

Range
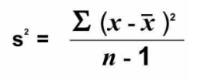
Variance
This is the measure of variability that takes the mean as the reference point
Involves all observations
Hard to interpret
Unit squared of the original set of observations after subtracting it to the mean
Variance
This expresses the SD as percentage of mean
Most appropriate when the measurement of variables are different and there are 2 or more variables
Coefficient Variation

Coefficient Variation
HOMOGENOUS OR HETEROGENOUS:
When the measure of dispersion is low or small
HOMOGENEOUS
HOMOGENOUS OR HETEROGENOUS:
When the measure of dispersion is high or large
HETEROGENOUS
Determines the location/position of particular value in an array of distribution
Provide more details about a part of the entire distribution of observations in a give data
Use for quali and quanti
Measures of Location
What are the most common measures of location?
Quartiles
Deciles
Percentiles