maths mocks
1/37
Earn XP
Description and Tags
Name | Mastery | Learn | Test | Matching | Spaced |
|---|
No study sessions yet.
38 Terms

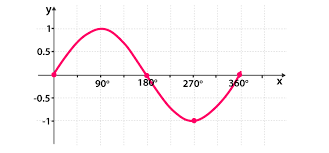
which graph is this
sin graph

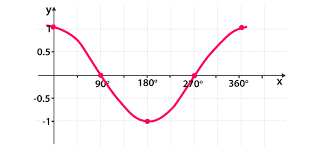
which graph is this
cos graph

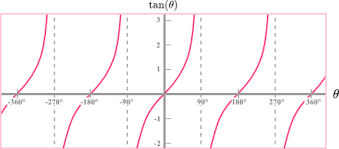
which graph is this
tan graph
circle theorem 1
the angle subtended by an arc at the centre is twice the angle at the circumference
circle theorem 2
the angle in a semicircle is a right angle
circle theorem 3
two angles at the circumference standing on the same arc are equal
circle theorem 4
opposite angles in a cyclic quadrilateral sum to 180*
area of a triangle
base x height x sin(theta) x 1/2
sin special trig values
0 , ½ , 1/√2 , √3/2 , 1
cos special values
0, √3/2 , 1/√2 , ½ , 0
tan special values
0 , 1/√3 , 1 , √3 , n/a
vol of cone equation
πr2h x 1/3
vol of sphere equation
4 x πr3 x 1/3
vol of prisms equation
area of face x length
square based pyramid volume equation
b x h x 1/3
length of arc
2 π r (θ/360°)
area of sector
angle/ 360 x π r2
surface area of a cone
2πr(r + h).
sum of interior angles of polygon
180(n-2)
sum of exterior angles of polygon
360
quadratic formula
x=−b±√b2−4ac / 2a
mean
the sum of the values divided by the number of values
mode
The mode is the value that appears the most often
median
The median is the middle value when you put values in size order
how to find mode from a frequency table
the data value with the highest frequency
how to find median from a frequency table
total frequency + 1 / 2
how to find mean from a frequency table
total of (data value x frequency) / total frequency
what does a histogram show
the area of the bar shows the frequency of the data
frequency density formula
frequency / class width
vol of cylinder
πr²h
area of trapezium
½ (a+b)h
pythagorus
a² + b² = c²
sin rule
a/ sinA = b/sinB = c/sinC
cos rule
a²= b² + c² - (2 bc cosA)
area of triangle
½ ab sinC
compound interest
P( 1 + r/100) n
area of a parallelogram
base x perpendicular height