Ch 13 Notes Monetary Theory: the Impact of Money on the Economy
1/22
Earn XP
Name | Mastery | Learn | Test | Matching | Spaced | Call with Kai |
|---|
No analytics yet
Send a link to your students to track their progress
23 Terms
Money Supply
Impact on the price level
Equation of Exchange
MV=PQ
MV=PQ
M=money supply
P=price level
Q=real GDP
V=velocity
velocity
the average number of times money is spent purchasing final goods and services
quantity theory of money (classical)
assumptions of:
velocity (V) is constant
real GDP (Q) is constant
assumptions of:
velocity (V) is constant
real GDP (Q) is constant
there is a direct and proportional relationship between M and P. They are 1:1 and move in the same direction.
There is a direct and proportional relationship between M and P. They are 1:1 and move in the same direction.
If growth rate of money supply increases by 5%, long term price levels rise by 5%.
If growth rate of money supply decreases by 2%, long term price levels fall by 2%.
monetarism
a school of economic thought associated with Milton Friedman which builds on the equation of exchange
Characteristics of monetarism
Monetary rule: Fed should allow M to grow at a steady and predicate rate each year, consistent with growth in real GDP, to keep inflation under control
Inflation results from excessive growth in money supply
Excessive growth in money supply only causes inflation in the long run with no change in real GDP

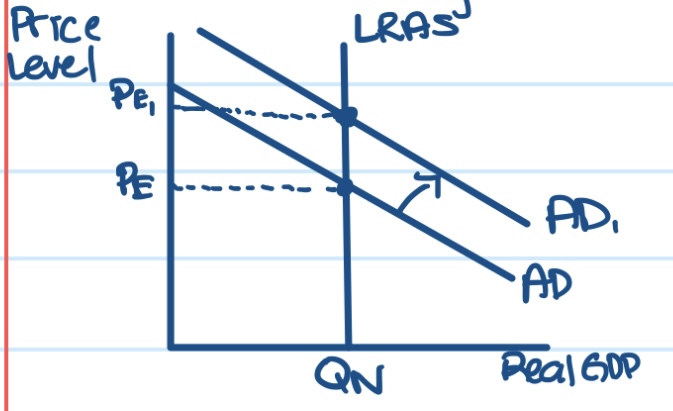
Increase in money supply leads to Increase in Aggregate Demand
When money supply increases, that allows for more spending to take place. If there’s more spending, that creates more demand overall for goods and services. Increase aggregate demand shifts to right, higher price level, but real GDP is still at natural level, so no change in long run.
Keynesian Monetary Theory
Money Market
Nominal and Real Interest Rates
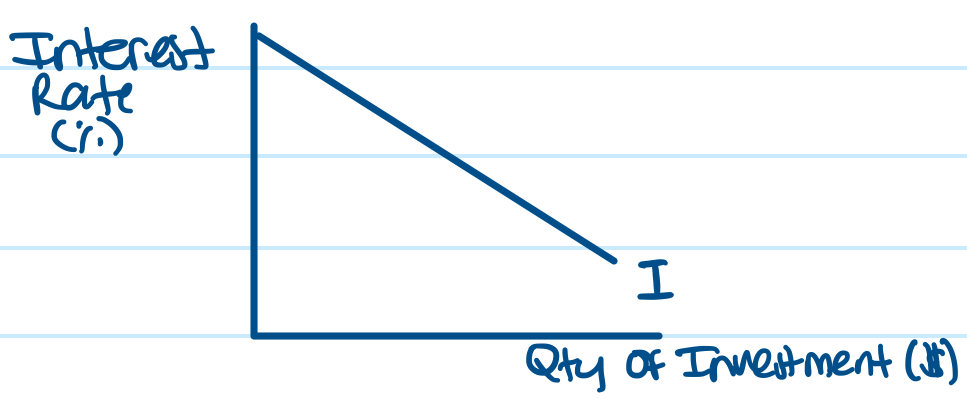
Investment and Interest Rates

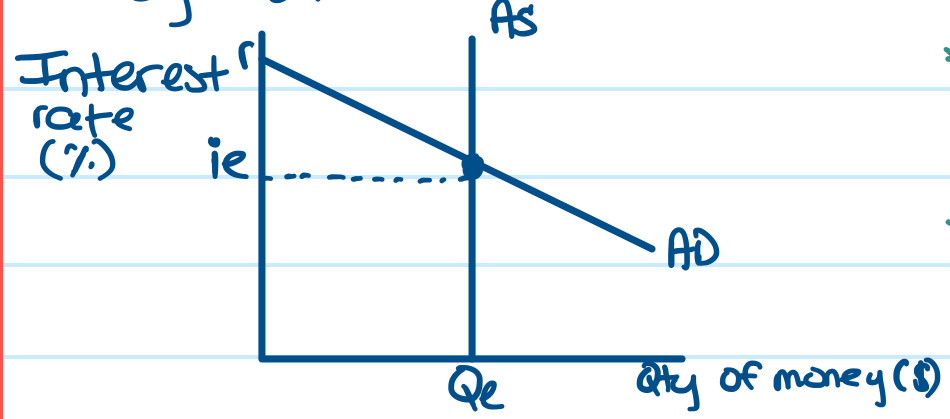
Money Market Relationship
Negative between interest rate and quantity of money demanded (held). As interest rates go up, quantity of money demanded (held) will go down (vice versa)
Money supply is vertical because it’s independent of the interest rate and is fixed at whatever level FED deems appropriate
Nominal Interest Rate Formula
Real Interest Rate + Inflation Rate
(what lender hopes to earn) + (expected rate of inflation)
Suppose a lender is hoping to earn 7% on a loan but expecting inflation rate of 4%. What will they quote/charge the nominal rate?
nominal rate = 7% + 4%
nominal rate = 11%
If a lenders expected rate of inflation rate turns out to be higher, say 13%, what does it mean for their nominal rate?
nominal rate of 11% with an expected inflation rate of 13% would give a -2% real interest rate, so they would be losing money

Investment and Interest Rate Relationship
Negative; as interest rates go up, as the cost of borrowing rises, businesses are less likely to borrow, spend.

Keynesian Monetary Theory Graphs between money market, investment, and AS/AD
to show amount of investment spending undertaken by businesses in 2nd graph, connect interest rate from 1st graph over

If Fed decides to increase growth rate of money supply, how will I show this in money market graph? How will this impact investment and AD graph? What is this policy?
Increase Money supply leads to Decrease in Interest Rates
Decrease in interest rates leads to Increase in Investment
Increase in Investment leads to Increase in AD
Expansionary monetary policy used to close recessionary gap

If Fed decides to decrease growth rate of money supply, how will I show this in money market graph? How will this impact investment and AD graph? What is this policy?
Decrease Money supply leads to Increase in Interest Rates
Increase in interest rates leads to Decrease in Investment
Decrease in Investment leads to Decrease in AD
Contractionary monetary policy used to inflationary gap
Monetary constraints
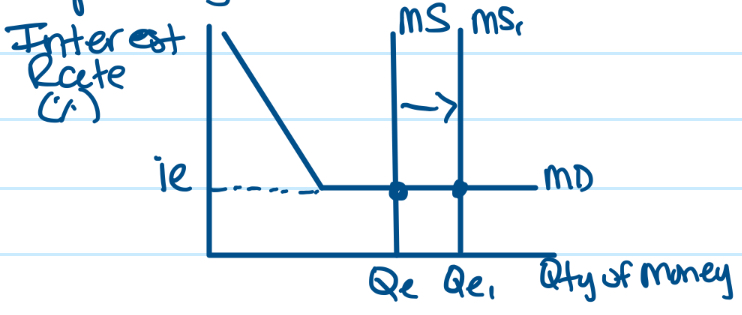
liquidity trap
pessimistic business expectations

liquidity trap
When interest rates get really low, that’s where money demand flattens and becomes horizontal. Individuals believe rates are as low as they’ll go and can only go up, so they’ll hold their money in order to have that liquidity and take advantage of the move when rates go up. Monetary policy is ineffective because money supply changes doesn’t affect interest rates.
pessimistic business expecatations
If expecting recession (downturn), businesses spend/invest less, even if interest rates are low because they aren’t the most important determinant
The best approach to stimulate the economy out of recession is to use
Expansionary Fiscal Policy not monetary policy