chapter 7 - national income + expenditures part 2 (ad g and nx but prices are constant)
1/11
There's no tags or description
Looks like no tags are added yet.
Name | Mastery | Learn | Test | Matching | Spaced | Call with Kai |
|---|
No analytics yet
Send a link to your students to track their progress
12 Terms
govt spending
G is a function of election, not Y : Yn DOESNT AFFECT GOV SPENDING (autonomous)
-> ∆G = results of a gov policy decision
gov spending + investment - transfer payment
G affect AE directly with C + I + G
T affect AE indirectly through Yd and C (TP to households or subsidies to firms> money not used in GDP rn but can be used later by households or firms)
net tax revenue
Total tax revenue minus transfer payments > (t - TP)
T = tY -> net tax rate x GDP (increase in t when GDP increases by $1)
T = F(Y) ✅ : decrease Yd
TP : increases Yd
G = combination of all 3 levels of gov : Fed spends less on taxes and more on TP and transfers to provinces
disposable income
Yd = Y - T
Yd = Y - tY = (1-t)Y
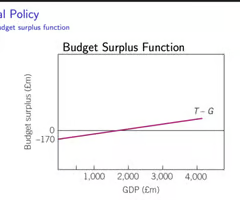
Graph 6 : Budget function (= public savings function)
define :
T - G (G revenue - G purchases)
= - > budget deficit
= + > budget surplus
= 0 > balanced budget
(to the G)
slope :
shift

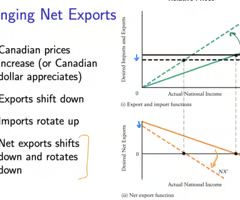
Graph 7 : Net export fxn
NX = X - M (BOT) =
X - mY (bc m is f(Y))
= - > BOT deficit
= + > BOT surplus
= 0 > BOT
(to the circular flow)
slope : marginal propensity to import (desired imports rise when Yn rises)
shifts : FACE
1) Foreign income (when other countries go through booms = less likely to purchase Canadian goods so CAN exports ↓)
2) CA relative price of good ( if CAN prices ^ = foreign countries will not buy =value of CAN exports ↓)
3) exchange rate (price of CAN $) (if foreign currency ^, CAN will purchase domestic goods to MPI ↓ and X ^)
X = autonomous (horizontal line)
IM = endogenous

adding taxes to the consumption function
C = a + bYd
Yd = Y - T
T = 0.1Y than Yd=0.9Y
c = 30 + (0.8)Yd
c= 30 + (0.8)(0.9)Yd
c = 30 + (0.72)Yd
C = a + b(1-T)Yd
*MPC of Yd = 0.8 whereas MPC out of national Y = 0.72)
MPspend (z)
-> additional inclination to spend out of additional dollar of Y
z = b (1-t) - m
% spent of Yd (minus taxes) x Mpc - imports (not produced domestically so is not considered in GDP)
-> frugal economy (no G or NX) z=MPC BUT IN OPEN ECONOMY z=MPspend
= b(1-t) - m
- m and t reduces mpspend of Y and therefore reduces value of multiplier
changes in NX : how does a rise in both affect YE and the AE curve?
X = autonomous
M = induced
X depend on foreign income and Er but not CAN Y > if consumers developed preference for CAN furniture by $1, there will be $1 billion increase in X, upwards shift of AE by $1 billion, and YE WILL INCREASE $1 TIMES SIMPLE MULTIPLIER
if m^, then mpm ^ and the AE curve will flatten = reduction in CAN YE
stabilization policy + 2 fiscal policies in output gaps
Y < Y* = recessionary gap (factor incomes low and U ^) : expansionary fiscal policy to increase Ye
Y > Y* = inflationary gap (rising costs) : contractionary fiscal policy to decrease Ye
2 fiscal policies available to G
1) net tax rate (t)
2) gov purchases
if ↓ in t and ^ in G then AE curves up, increasing YE by multiplier (and vice versa)
fiscal policy
Government policy that attempts to manage the economy by controlling taxing and spending.
-> gov budget manipulation
macro model based on 3 central concepts
1) Equilibrium National Income : level at which desired aggregate expenditure equals ACTUAL national income (AE=Y) : if Y>, inventories rise so ↓ production = ↓ Y). or AE>, inventories ↓ so ^ production = ^ Y)
2) Simple Multiplier : measures change in national income that results from change in AUTONOMOUS part of desired AE : 1/(1 - z) :
chp 6 : z = MPC
chp 7 : z = MPSpend or b(1-t) - m
3) Constant Prices and Demand-determined Output : general price level with constant P.
- firms are able.willing to produce output that demand wants w/o price change : National income is demand determined
2 situations when output can be demand determined :
1. price setting firms
2. unemployed resources
3 causes for an increase in exports
1. increase in foreign demand for Canadian goods
2. fall in Canadian price level
3. depreciation of CAN dollar
increase in exports = shifts AE function up + increases Ye