Data analysis (topic questions)
1/11
There's no tags or description
Looks like no tags are added yet.
Name | Mastery | Learn | Test | Matching | Spaced |
|---|
No study sessions yet.
12 Terms
Define and provide examples of the 3 threats to internal validity
maturation effect: changes in the DV that might be attributed to developmental, biological, or psychological processes over time
history effect: occurs when changes in the DV might be attributed of an event outside of the experimenter’s control
regression toward the mean: involves high or low scores that are statistically rare moving toward normative values in the absence of the Tx
Describe how replication and repeated measurement of the DV can be used by SCED researchers to help battle threats to internal validity described in study objective #1
replication: demonstrate the effect of the intervention with multiple times within a study. Strengthens the control of the design. Having 3 phase changes and more means showing increased control and showing internal validity.
Repeated measurement of the DV: measured repeatedly over time to track behavior patterns before, during, and after the intervention. This helps determine whether changes are due to the intervention or other factors like external events or natural development, thus strengthening internal validity
Define the term visual analysis and describe the underlying rationale of why we use it when conducting SCEDs
visual analysis: Traditional, nonquantitative method of inspection of level, trend, and overlap of data to evaluate treatment effects in single-subject data
we use it for SCED b/c of direct comparison of data: multiple measures of a client’s target B/X plotted over time, typically with line or time series graphs. It also directly compares dimensions of the target B/X during baseline with those same
Explain the term visual inspection may be viewed as more conservative measure than statistical analysis used in between groups designs
you cannot see the effect of the Tx with your own eyes from the graph, the Tx was considered not effective. Leads to type 2 errors.
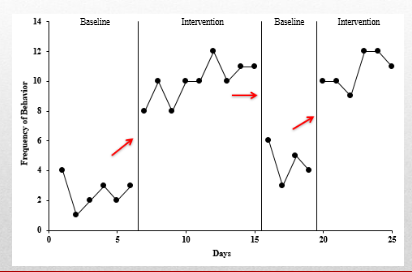
Describe the terms mean and level as they relate to visual analysis. Describe how these terms are used to determine the magnitude of change between phases
Mean: refers to shift in the average rate of performance
Level: refers to the shift or discontinuity of performance from the end of one phase to the beginning of the next phase
Describe the terms trend/slope and latency as they relate to visual analysis. Describe how these are used to determine the magnitude of change between phases.
trend: refers to the tendency for data to show increase or decreases over time
latency of the change: refers to the period b/w the onset or termination of one condition and changes in performance.
Trend/slope examines patterns to identift behavior change and contributes to the visual perception of the rapidity and degree (magnitude) of that change.
Latency the change in latency across phases (e.g., from high to low) reflects the magnitude of behavior chang
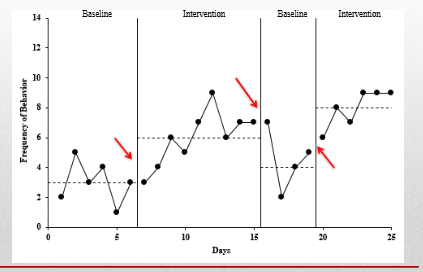
Describe and provide examples of how/why the mean and level are independent from each other.
change in mean: shift in the average rate of performance
ex:
change in level: shift or discontinuity of performance from the end of one phase to the begining of the next phase
List and describe other criteria that must be considered when conducting visual analysis i.e.,variability within and across phases, stability, replication of effects, experimental design used)
variability within and across phases:
Stability:
Replication of effects:
experimental design used:
list and describe some of the concerns that must be considered when conducting visual analysis
No concrete decision rules (i.e., subjectivity).
Multiple influences in reaching a decision (i.e., no weights assigned to various criteria).
Search for only marked effects (i.e., overlooking weak but reliable effects; Type II errors)
list and desribe the benefits of graphic displays and visual analysis
Immediate access to the record of behavior
Variations prompt exploration
Provides judgmental aid
Visual analysis takes less time and is relatively easy to learn
Imposes no arbitrary level for determining significance
Conservative method
Encourages independent judgments and interpretation
explain the basic logic behind calculating the percentage of nonoverlapping data
which type of analysis (visual inspection or quantitative analysis) is best when evaluating SCEDs according to your textbook authors?
both is fine