Chapter 5 - Hypothesis Tests with Means of Samples
1/53
There's no tags or description
Looks like no tags are added yet.
Name | Mastery | Learn | Test | Matching | Spaced | Call with Kai |
|---|
No analytics yet
Send a link to your students to track their progress
54 Terms
Why did we use a comparison distribution of individual scores in previous chapters?
because we had sample sizes of one
What type of distribution should we use for sample sizes greater than one?
a distribution of means
distribution of means
a distribution of means of samples of a given size from a population
What are distributions of means theoretically based on?
a very large number of samples of the same size, which each sample randomly drawn from the same population of individuals
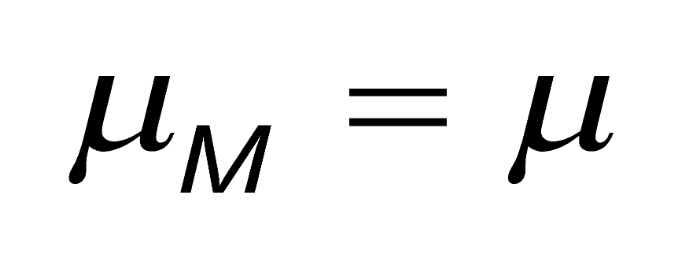
Rule 1 (distribution of means)
the mean of the distribution of means is equal to the mean of the population of individuals
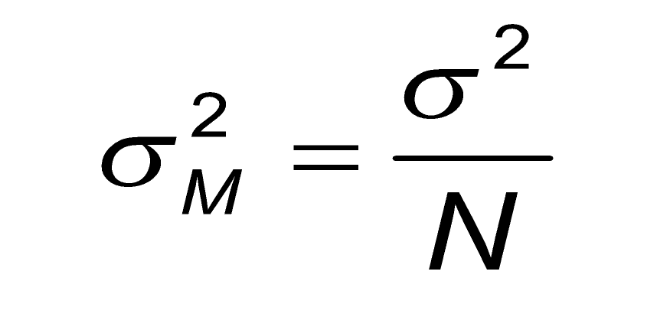
Rule 2a (distribution of means)
the variance of a distribution of means is the variance of the population of individuals divided by the number of individuals in each sample
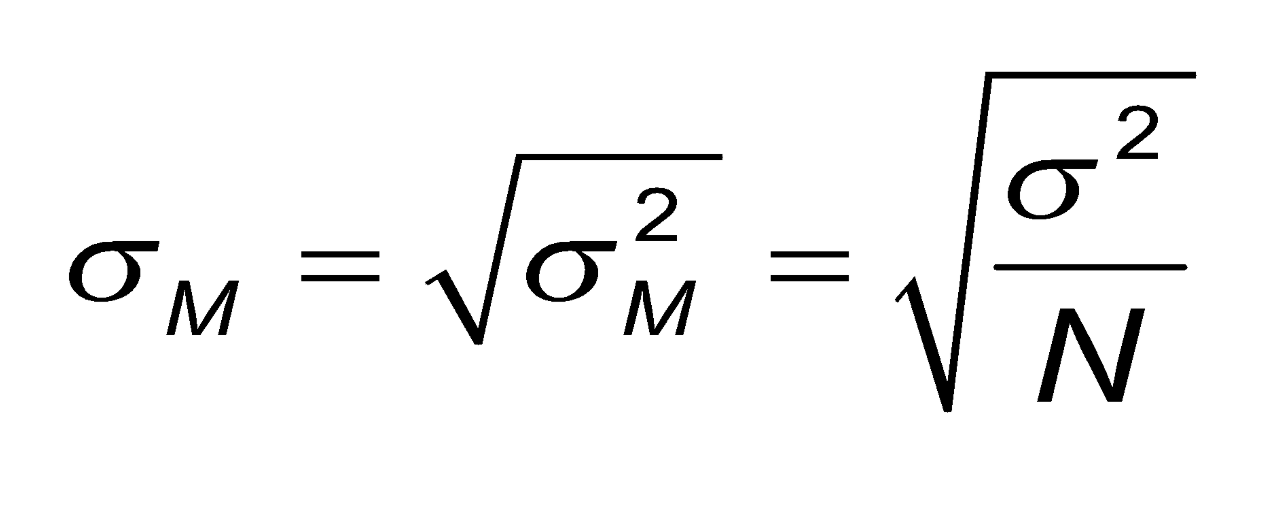
Rule 2b (distribution of means)
the standard deviation of a distribution of means is the square root of the variance of the distribution of means (standard error)
Rule 3 (distribution of means)
the shape of a distribution of means is approximately normal if either (a) each sample consists of 30 or more individuals or (b) the distribution of the population of individuals is normal
What are the 3 rules for distribution of means based on?
the Central Limit Theorem
population’s distribution
has scores of all individuals in the population
shape of population distribution
any; often normal
mean of population distribution
µ
variance of population distribution
σ²
standard deviation of population distribution
σ
sample distribution
has scores of the individuals in a single sample

shape of sample distribution
any
mean of sample distribution
M = (∑X)/N
variance of sample distribution
SD² = [∑(X-M)²]/N
standard deviation of sample distribution
SD = √SD²
distribution of means
means of samples randomly taken from the population
shape of distribution of means
approximately normal
mean of distribution of means
µM = µ
variance of distribution of means
σ2M = σ2 / N
standard deviation of distribution of means
σM = √σ2M
What is the formula for the Z score for the sample’s mean on the distribution of means?
Z = (M - µM) / σM
Step 1 (hypothesis testing with a z test)
restate the question as research and null hypotheses about the populations
Step 2 (hypothesis testing with a z test)
determine the characteristics of the comparison distribution
Step 3 (hypothesis testing with a z test)
determine the cutoff sample score on the comparison distribution
Step 4 (hypothesis testing with a z test)
determine your sample’s score on the comparison distribution
Step 5 (hypothesis testing with a z test)
decide whether to reject the null hypothesis
marginal significance
when a result does not make the cutoff value at the usual 5% level but comes very close (say, p < 0.10)
When might marginal significance be appropriate to report?
when related results are clearly significant
What does reporting marginal results vary by?
the specialty areas in psychology
How frequently are z tests reported in research articles?
not often
How frequently are means and standard deviations reported in research articles?
typically
How might standard error be included in research articles?
as error bars
What is the best estimate of the population mean when it is unknown?
the sample mean
confidence interval (CI)
the range of scores that is likely to include the true population means
confidence limits
upper and lower ends of a confidence interval
What are typical confidence intervals?
95% and 99%
Step 1 (finding confidence limits)
figure the standard error
σM = √σ2M = √σ2 / N
Step 2 (finding confidence limits)
figure raw scores for the appropriate number of standard errors above/below the sample mean
95% → 1.96 standard errors
99% → 2.58 standard errors
upper limit
M + (SE)(σM)
lower limit
M - (SE)(σM)
How do we interpret a confidence interval?
we say we are __% confident that the true mean is in this range
What is confidence similar to?
subjective interpretation of probability
What can confidence intervals be used for?
hypothesis testing
What are the advantages of using confidence intervals rather than significance tests?
give additional information
focus attention on estimation
less likely to be misused by researchers
Where are confidence intervals encouraged?
in the 2020 APA Manual
What are significance tests necessary for?
some advanced statistical procedures
How are confidence intervals reported?
following mean, in brackets
ex: 95% CI [62.06, 73.20]
How many standard errors are 95% confidence intervals in both directions?
approximately 2 (±1.96)
How many standard errors are 99% confidence intervals in both directions?
approximately 2.5 (±2.58)
What do error bars in research articles typically represent?
standard errors, but about 15% of the time, they’re actually confidence intervals