2.2: Data Transformations and Z-Scores
Data Transformations
- Measures of center include the mean, median, quartiles, minimum, and maximum of a set of data
- Measures of spread include the IQR, range, and standard deviation
- When a constant is added to every number in a list,
- The measures of center increase by that amount and the measures of spread remain the same
- When every number in a list is multiplied by a constant,
- The measures of center are multiplied by that amount and the measures of spread also get multiplied by that amount
Comparing Unalike Figures
- Suppose we have two values that we want to compare, but they don’t come from the same distribution
- Eg. getting a 610 on SAT math vs. a 24 on ACT math
- Eg. being a 80” guy vs. a 76.5” girl
- We can compare these figures by getting a standardized score called a z-score
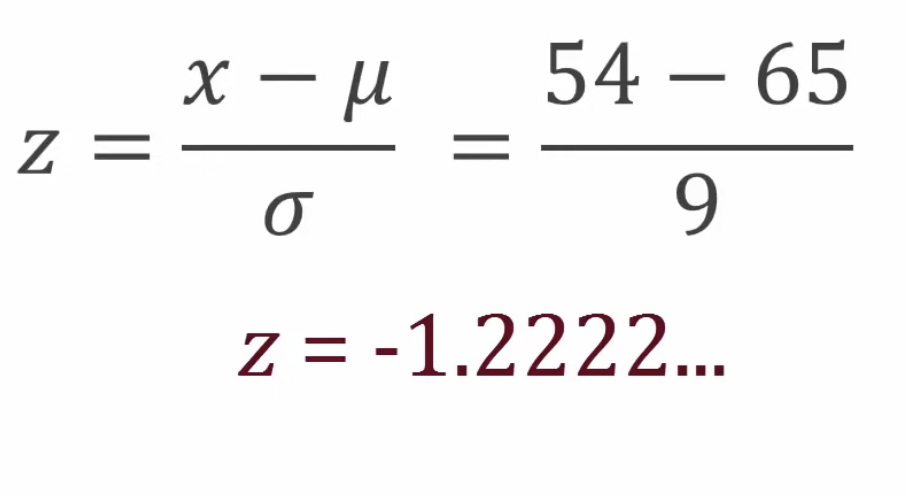
- z = (x-μ)/σ
- z: z-score
- x: value
- μ: population mean
- σ: population standard deviation
- A z-score shows exactly how many standard deviations above or below the mean a value is
- Even if two data points come from different distributions, they can be directly compared if converted to z-scores
- When comparing two z-scores, the higher z-score is the better relative score
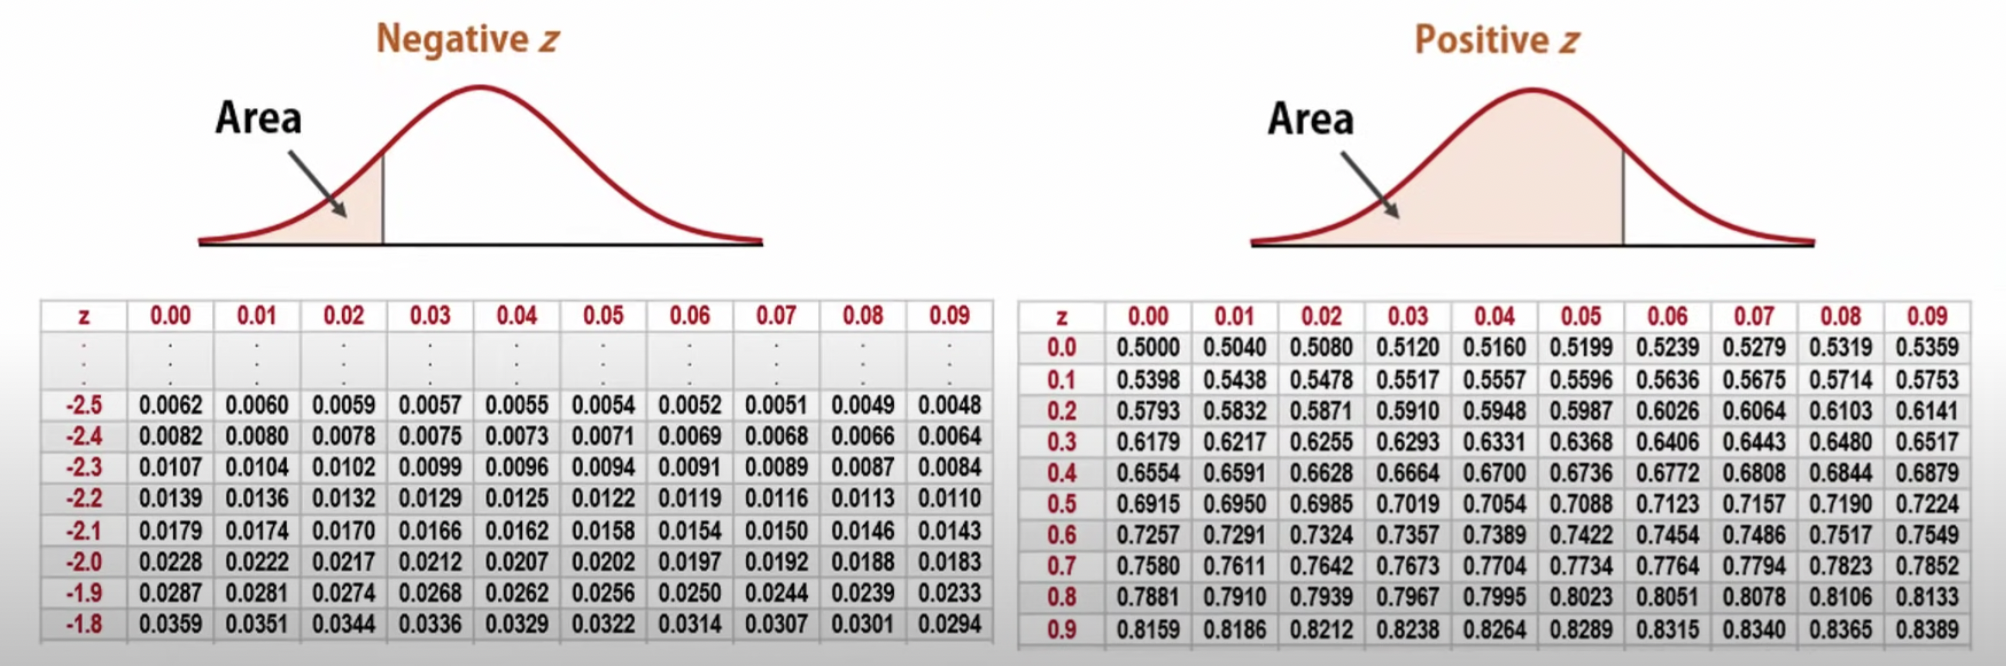
Z-Charts
- A chart which can be used to convert proportions to z-scores and vise-versa
- Available on the “cheat sheet” during the AP exam
Example Problem
- Find percent of values less than 54
- μ = 65
- σ = 9
- X~N (μ,σ) → Z~N (65,9)
- Finding P(x<54) → x = 54, put into equation z = (x-μ)/σ
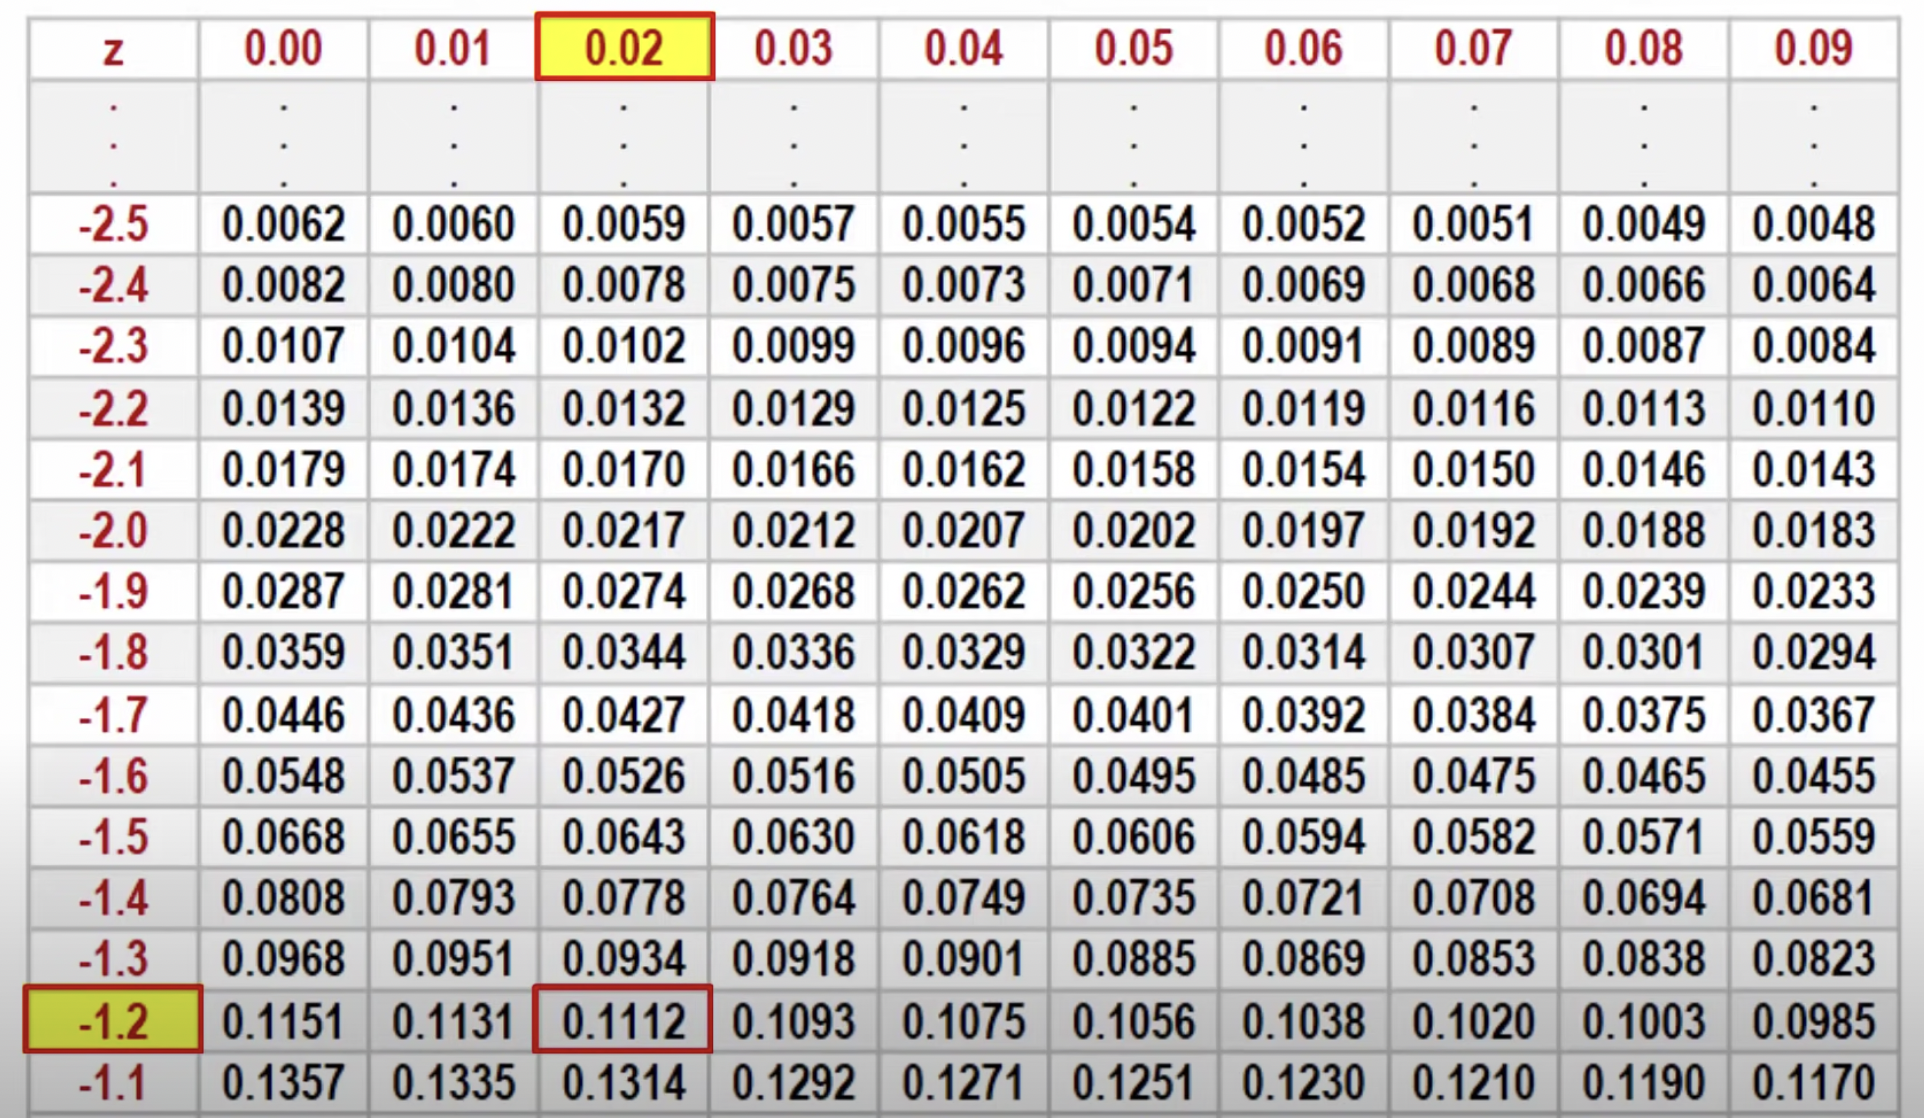
- Locate z = -1.2222 on z-chart
- P(x < 54) = P(z < -1.22) = 0.1112 (11.12%)