Chapter 2 Stats
1/99
There's no tags or description
Looks like no tags are added yet.
Name | Mastery | Learn | Test | Matching | Spaced |
|---|
No study sessions yet.
100 Terms
A distribution of a column of data refers to what three characteristics of the column of data?
The shape, location, and spread of the column of data.
What characteristic is summarized by the pattern of data values when graphed?
Shape
What characteristic is summarized by the middle of the data values on a real number line?
Location
What characteristic is summarized by the width of the data values on a real number line?
Spread
The science of statistics summarizes information in a column of data with graphs, numbers, and computer outputs.
False
What information is extracted from a column of data by graphs?
General trend of the data values as well as any major exceptions.
Always look at your data first, before looking at your statistics.
True
Number of data values
Size
Mean or median
Location
Standard deviation or inter-quartile range
Spread
What one of the following answers is true about a parameter?
A constant that gives population information.
What is the general name for statistics that give information about a column of data?
Descriptive statistics.
What is the general name for statistics that extract the most information from a column of data?
Efficient statistics.
What is the general name for statistics that are less affected by extreme values in a column of data?
Resistant statistics.
Match each characteristic of a distribution with the appropriate statistic for qualitative data.
Shape. : Bar chart.
Location. : Mode.
Spread. : Number of categories.
Why look at a chart to get shape information instead of looking at the data values themselves?
A chart is needed to summarize the shape characteristic so that we can see it.
Count of the data values in a category
Frequency
Proportion of the data values in a category
Relative frequency
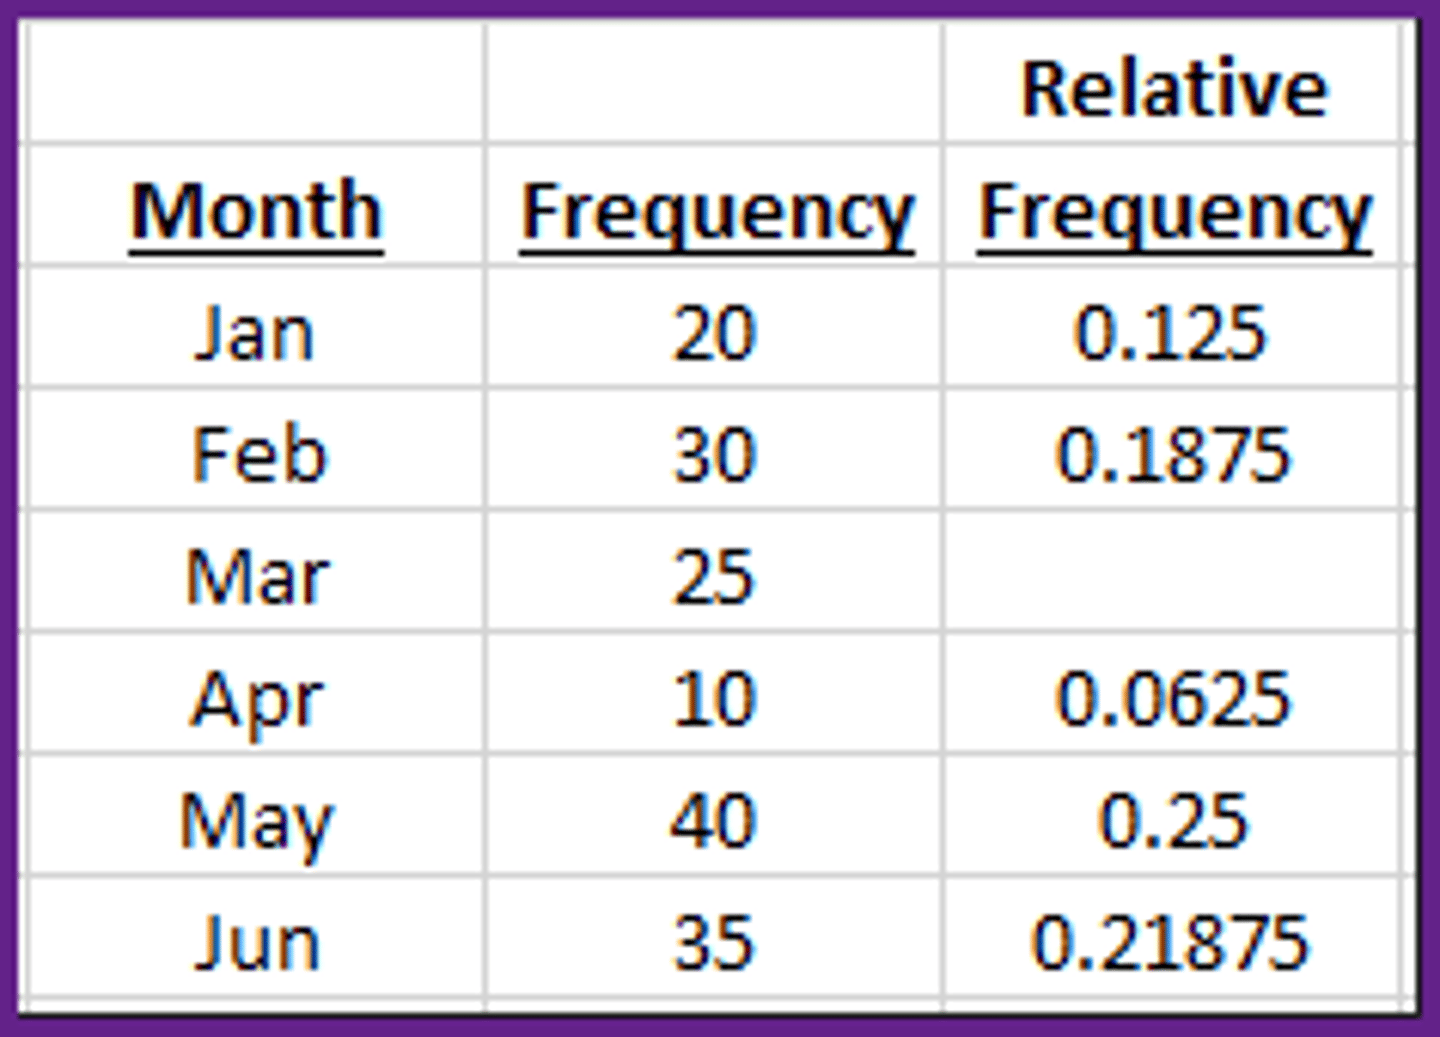
In the frequency table below, what is the relative frequency for the category Mar? (answer to three decimal places, ex. 1.089)
0.1563
Which of the following answers is NOT one of the first three columns in a frequency table?
Cumulative Frequency.
In the frequency table below, what is the frequency for the category May? (answer to zero decimal places, ex. 1.)
40
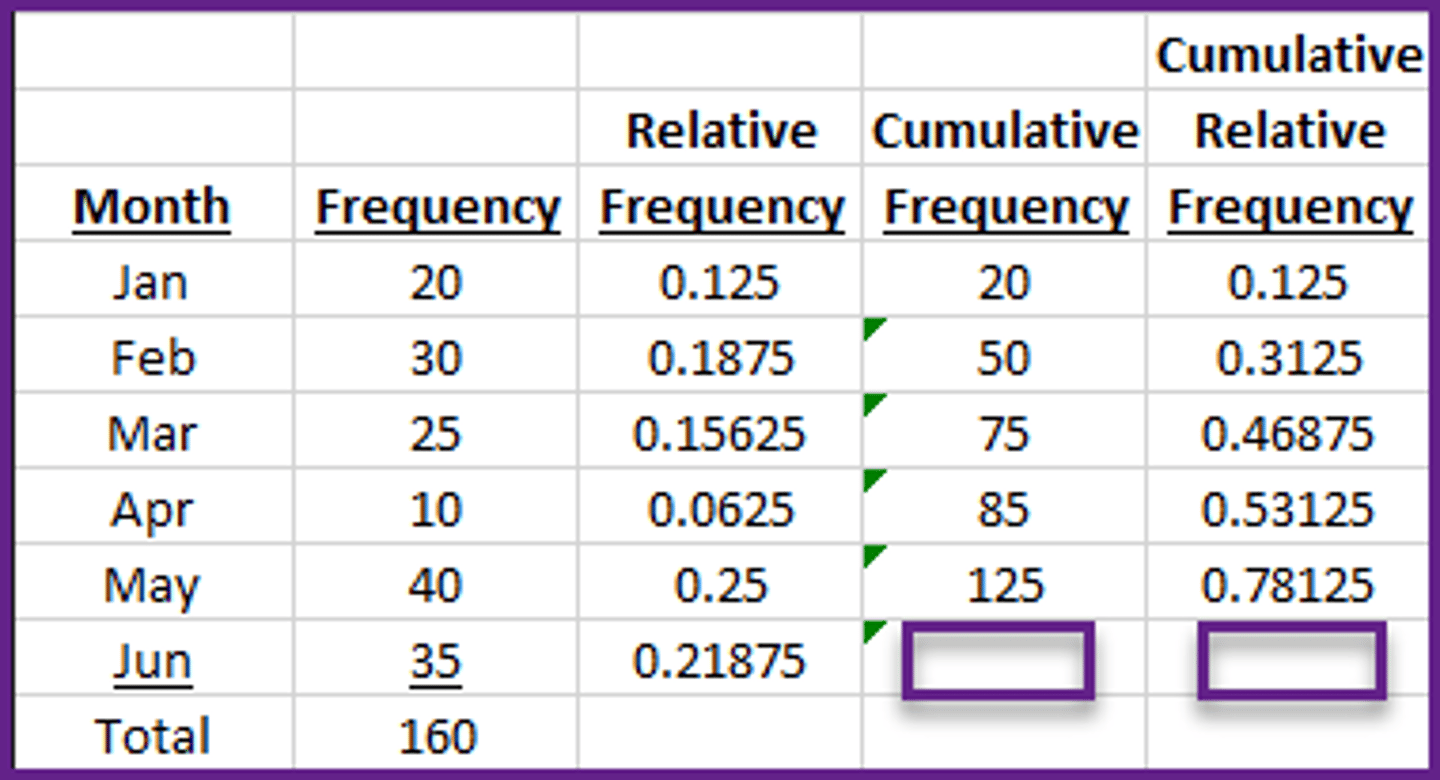
In the frequency table below, what is the cumulative frequency and the cumulative relative frequency for the category Jun?
160.0 and 1.0
What type of graph is most appropriate to use to display the shape of qualitative data?
A bar chart where the bars do not touch each other.
A Pareto chart just a bar chart with the bars rearranged from the highest bar to the lowest bar.
True
In a histogram for discrete data, what characteristic is shown on the x-axis, and what characteristic is shown on the y-axis?
The data values in the data set on the x-axis, and the frequency of the data values on the y-axis.
In a histogram for continuous data, what characteristic is shown on the x-axis, and what characteristic is shown on the y-axis?
Bins of the data values on the x-axis, and the frequency of the data values in the bins on the y-axis.
When making a histogram for continuous data, a bin is just a range of possible data values.
True
A boxplot is used to display the shape of qualitative data.
False
A boxplot shows location and spread information as does a histogram.
True
What is the general approach to analyzing the information in a histogram?
First look at the overall shape, then look for exceptions.
Which of the following answers is NOT one of our overall shapes?
A modeless shape.
A skewed left shape means that the peak of the histogram is on the left side of the histogram. A skewed right shape means that the peak of the histogram is on the right side of the histogram.
False
Skewness in a histogram is a property of what in the histogram?
The tails.
How is a gap distinguished from an extreme value?
A gap is fits as part of the overall shape. An extreme value is outside the overall shape.
Why is it important to look at the shape of a column of data before interpreting any statistics?
To see if the data is unimodal, symmetrical, and without any exceptions.
In a boxplot of continuous data, what percent of the data values lie inside the box, and what percent of the data values lie outside the box?
50% and 50%
Which of the following answers is NOT an exception when analyzing a histogram?
Any bimodal shapes.
What type of graph is most appropriate to use to display the shape of discrete data?
A histogram where the bars do touch each another.
Extract the most information from a column of data
Efficient statistics.
Less affected by extreme values
Resistant statistics
What is the mean (µ) for the following set of data?
15, 20, 25, 30, 35, 40
27.5
What is the mean (µ) for the following set of data?
2, 2, 3, 8, 1, 2
3.0
The mean (µ) is NOT needed to calculate a deviation.
False
What information about a data value is given by its deviation?
The mathematical distance and direction from the mean.
A deviation can never equal zero.
False
In statistics, a deviation applies to only one data value.
True
A data value close to the mean has a?
Small deviation.
A data value less than the mean has a?
negative deviation
The efficient measure of spread for a column of data is the?
Standard deviation.
A bigger standard deviation for a data set means the data values are?
Spread wider apart.
What is the appropriate denotation for standard deviation?
σ for population, s for sample.
Which one of the following answers is NOT correct about standard deviation?
Standarddeviation=Variance^2
Can the standard deviation (σ) be used to find probability?
Yes, it can with a normal curve.
To calculate variance, statistics does not average the deviations, instead it averages the?
Squared deviations.
What is the statistical term for all the squared deviations added together?
Sum of squares.
Does the sum of squares (SS) usually get bigger as more data values are added to the data set?
Yes, because there are more numbers in the data set to sum.
What is the formula for the sum of squares (SS)?
Sumofsquares=∑(x−xbar)^2
What is the sum of squares (SS) for the data set below?
10, 20, 30
200
What is the sum of squares (SS) for the data set below?
3, 5, 10
26
What is the sum of squares (SS) for the data set below?
-3, 5, 10
86
The sum of squares (SS) is what type of measure of spread?
A raw measure of spread.
Two data sets have the same size, but Data set A has a sum of squares of 97 and Data set B has a sum of squares of 197. In which data set are the data values more widely spread out?
Data set B, because a sum of squares of 197 is bigger than a sum of squares of 97.
What is the variance (σ2) for a data set that has 19 data values and a sum of squares (SS) of 36?
2
What is the variance (σ2) for the following data set?
4, 8, 9, 1, 8
11.5
Variance (σ2) is what type of measure of spread?
A measure of spread standardized for the number of data values.
What is the appropriate denotation for variance?
σ2 for population, s2 for sample
How is the sum of squares (SS) standardized into variance (σ2)?
Divide by the degrees of freedom.
What is the variance (σ2) for the following data set?
4, 9, 1, 4, 7
10.7
What is the variance (σ2) for the following data set?
9, 9, 2, 10, 5
11.5
The mean (µ) is used when thinking about the data values in a column of data because? (select two of the answers below)
A single number is easy to think about.The mean best represents the values in the column of data.
Is the average deviation better than the standard deviation (σ)?
No, because the average deviation always equals zero.
Does the average deviation always equal zero for every data set?
Yes, because the positive and negative deviation cancel each other.
What are resistant statistics resistant to?
The presence of extreme values.
What makes resistant statistics work?
They look at the position of the data values, and not at their values.
To find resistant statistics, what must be true of the data set?
The data values must be ranked from lowest to highest.
Percentiles are NOT positional statistics.
False
When denoting a percentile (Pk) what does the k stand for?
Which percentile is desired, the 0th percentile up through the 100th percentile.
The value of the third quartile (Ǫ3) can be less than the value of the first quartile (Ǫ1).
False
How many data values are less than the value of the third quartile (Ǫ3)?
Three quarters (75%)of the data values.
Percentiles (Pk) (or quartiles (Ǫk) must always be a data value in the data set.
False
Which of the answers below are NOT one of the steps to find any percentile (Pk)?
None of the other choices.
The appropriate equation to use in Step 1: Calculate the Index of finding a percentile (Pk)is shown below.
i=(k/100)×n
True
In Step 2: Move to the correct position of finding a percentile (Pk), how is the appropriate move decided?
If i is an integer, average that and the next higher data values. If i has a decimal, move up to the next higher data value.
What is the 40th percentile (P40) in the following ranked set of data (n = 15)? (to one decimal place = 00.0)
9, 13, 14, 14, 15 18, 19, 24, 30, 37 40, 41, 44, 44, 193
18.5
What is the first quartile (Ǫ1) / third quartile (Ǫ3) in the following ranked set of data (n = 15)? (to one decimal place = 00.0)
9,13, 14, 14, 15 18, 19, 24, 30, 37 40, 41, 44, 44, 193
14 / 41
What is the 60th percentile (P60) in the following ranked set of data (n = 15)? (to one decimal place = 00.0)
9, 13, 14, 14, 15 18, 19, 24, 30, 37 40, 41, 44, 44, 193
33.5
What is the 90th percentile (P90) in the following ranked set of data (n = 15)? (to one decimal place = 00.0)
9, 13, 14, 14, 15 18, 19, 24, 30, 37 40, 41, 44, 44, 193
44
What is sum of the data values less than the 20th percentile (P20) the following ranked set of data (n = 15)? (to one decimal place = 00.0)
9, 13, 14, 15, 15 18, 19, 24, 30, 37 40, 41, 44, 44, 193
36
What is the value of the median (M) in the following ranked set of data (n = 15)? (to one decimal place = 00.0)
9, 13, 14, 14, 15 18, 19, 24, 30, 37 40, 41, 44, 44, 193
24
What is the value of the interquartile range (IQR)in the following ranked set of data (n = 15)? (to one decimal place = 00.0)
9, 13, 14, 14, 15 18, 19, 24, 30, 37 40, 41, 44, 44, 193
27
The interquartile range (IQR) can never be negative.
True
The range is a reliable measure of spread.
False
The interquartile range (IQR) measures the spread of what part of the data set?
Middle half (50%)
What does a larger value for the interquartile range (IQR) mean about the data values?
The values of the data values are spread wider apart.
What information is given by a five number summary?
All of these other answers.
Are there any extreme values in the ranked set of data below (n = 15)?
-19, -3, 11, 14, 15 18, 19, 24, 30, 37 40, 41, 44, 44, 90
90 is an extreme value because the upper fence is 81.5.
Regarding a five number summary, what are the fences used for?
To give a lower limit and an upper limit on the data values to detect extreme values.
What is the value of the lower fence, and of the upper fence, in the five number summary below?
{0.2, 6.05, 6.45, 6.95, 8.2}
4.70, and 8.30
Are there any extreme values in the data set that has the five number summary below?
{0.2, 6.05, 6.45, 6.95, 8.2}
0.2 because the lower fence is 4.70.
Why do positional statistics work for a data set containing extreme values?
Because in the tails, a big change in value is usually a small change in position.