CHAPTER 5: RELIABILITY
1/67
There's no tags or description
Looks like no tags are added yet.
Name | Mastery | Learn | Test | Matching | Spaced |
|---|
No study sessions yet.
68 Terms
Reliability
The ‘CONSISTENCY’ in measurement
• The proportion of the total variance attributed to true variance.
• The greater the proportion of the total variance attributed to true variance, the more reliable the test.
Reliability Coefficient
An index of reliability describing the consistency of scores across contexts (e.g., different times, items, or raters).
THE CONCEPT OF RELIABILITY
Classical Test Theory
Classical Test Theory
• A score on an ability test is presumed to reflect not only the test taker’s true score on the ability being measured but also error.
Error
Measurement Error
Variance (σ2)
Error
• The component of the observed test score that does not have to do with the testtaker’s ability.
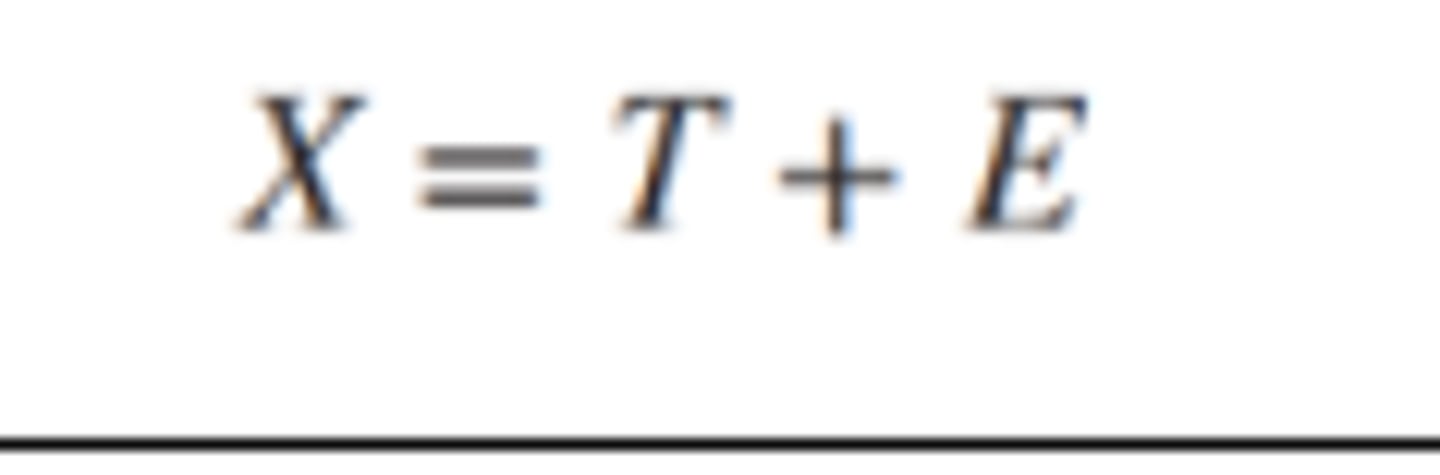
• X: observed score
• T: true score
• E: Error
Measurement Error
• All of the factors associated with the process of measuring some variable, other than the variable being measured.
o eg., English-language test on the subject of 12th-grade algebra being administered, in English, to a sample of 12-grade students, newly arrived to the United States from China.
• 1 Random Error
• 2 Systematic Error

• 1 Random Error
o A source of error in measuring a targeted variable caused by unpredictable fluctuations and inconsistencies of other variables in the measurement process.
▪ Eg., lightning strike or sudden surge in the testtaker's blood pressure.
• 2 Systematic Error
o A source of error in measuring a variable that is typically constant or proportionate to what is presumed to be the true value of the variable being measured.
o Does not affect score consistency.
Variance (σ2)
• The standard deviation squared which describes the sources of test score variability.
o True Variance: Variance from true differences.
o Error Variance: Variance from irrelevant, random sources.
1. SOURCES OF ERROR VARIANCE
Test Construction
Test Administration
Test Scoring and Interpretation
Test Construction
Item Sampling (Content Sampling)
The variation among items within a test as well as to variation among items between tests.
• Eg., test content differs in the way the it is worded or the included items.
Test Administration
Test Environment
Testtaker Variables
Examiner-Related Variables
Test Environment
• Eg. room temperature, level of lighting, and amount of ventilation and noise, the events of the day.
Testtaker Variables
• Eg. emotional problems, physical discomfort, lack of sleep, and the effects of drugs or medication, formal learning experiences, casual life experiences, therapy, illness, and changes in mood or mental state.
Examiner-Related Variables
• Examiner's physical appearance and demeanor, professionalism, and nonverbal behavior.
Test Scoring and Interpretation
Scorers and Scoring Systems
• Computer Scoring: Technical glitch might contaminate the data.
• Bias and subjectivity of scorers.
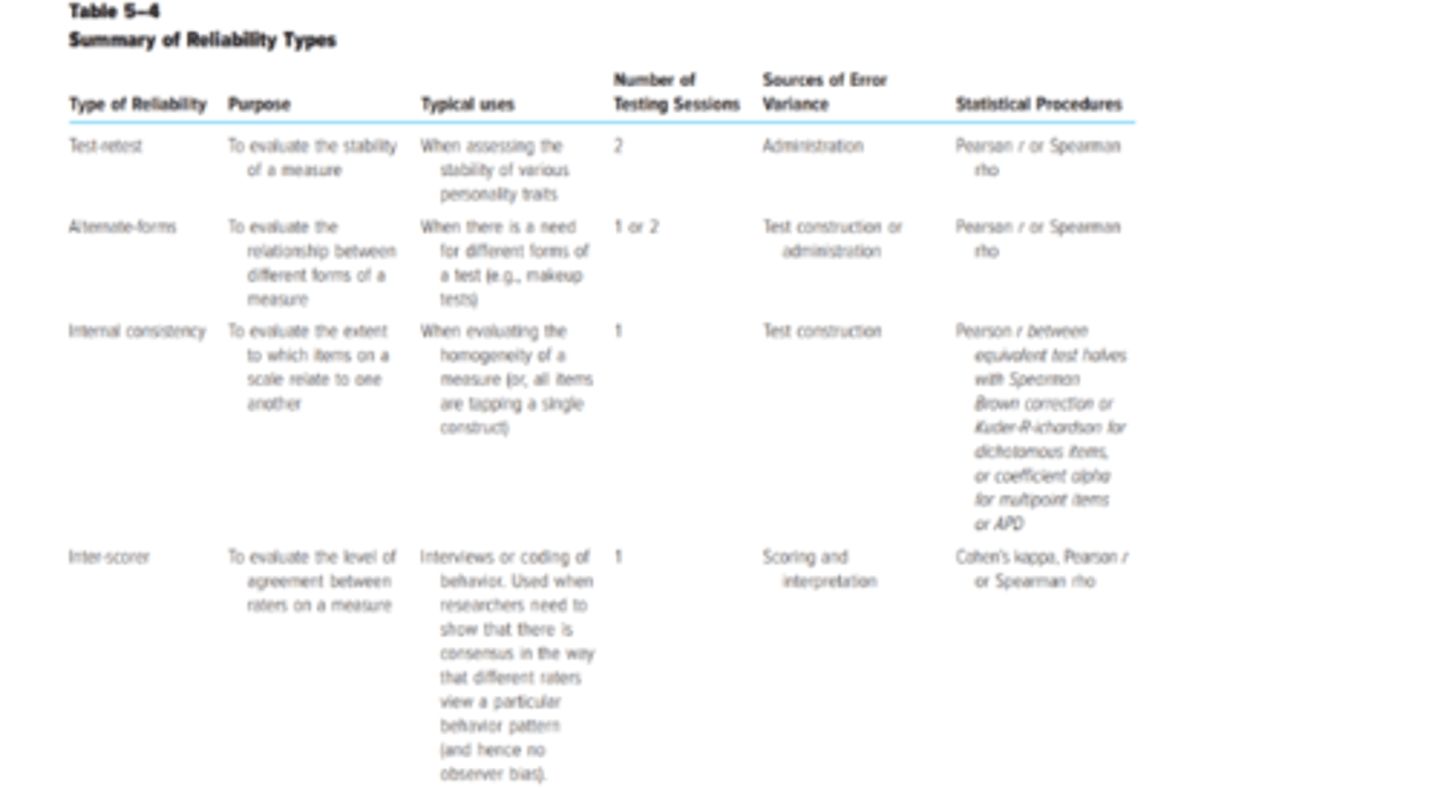
RELIABILITY ESTIMATES
1. test-retest reliability estimates
2. Parallel forms
3. Split-half reliability estimates
4. Other methods of Estimating Internal Consistency
5. Inter-scorer reliability
1. test-retest reliability estimates
• An estimate of reliability obtained by correlating pairs of scores from the same people on two different administrations of the same test.
o Useful if you are measuring something that is relatively stable over time (eg. personality traits).
• Coefficient of Stability
• Coefficient of Stability
o The estimate of test-retest reliability.
▪ The longer the time that passes, the greater the likelihood that the reliability coefficient will be lower.
2. Parallel forms
• Administering different forms of tests with the same group.
• Coefficient of Equivalence
o The degree of the relationship between various forms of a test.
Parallel Forms
• The means and the variances of observed test scores are equal in each form of the test.
• Parallel Forms Reliability
o An estimate of the extent to which item sampling and other errors have affected test scores on versions of the same test when, for each form of the test, the means and variances of observed test scores are equal.
Alternate Forms
• Simply different versions of a test that have been constructed so as to be parallel.
• Alternate Forms Reliability
o An estimate of the extent to which these different forms of the same test have been affected by item sampling error, or other error.
3. Split-half reliability estimates
• Correlating two pairs of scores obtained from equivalent halves of a single test administered once.
Three-Step Process
Splitting the Test
Spearman–Brown formula
Three-Step Process
• Step 1. Divide the test into equivalent halves.
• Step 2. Calculate a Pearson r between scores on the two halves of the test.
• Step 3. Adjust the half-test reliability using the Spearman–Brown formula.
Splitting the Test
• 1. Randomly assign items to one or the other half of the test.
• 2 Odd-Even Reliability
o Assign odd-numbered items to one half of the test and even-
numbered items to the other half.
• 3 Divide the test by content so that each half contains items equivalent with respect to content and difficulty
• Don’t divide the items in the middle.
o Raise or lower the reliability coefficient.
Spearman–Brown formula
Estimate internal consistency reliability from a correlation of two halves of a test.
o rSB: The reliability adjusted by the Spearman–Brown formula.
o rxy: The Pearson r in the original-length test.
o n: The number of items in the revised version divided by the number of items in the original version.
• Use the Spearman- Brown formula to estimate the reliability of a whole test.
o rHH: the Pearson r of scores in the two half tests
o A whole test is two times longer than half a test, n becomes 2.
• !! Usually, but not always, reliability increases as test length increases.
• May be used to:
o Estimate the effect of the shortening on the test's reliability.
o Determine the number of items needed to attain a desired level of reliability.
4. Other methods of Estimating Internal Consistency
Inter-Item Consistency
Kuder-Richardson Formula (KR-20)
Coefficient Alpha
Average Proportional Distance (APD)
Inter-Item Consistency
• The degree of correlation among all the items on a scale.
Homogeneity
• Greek words homos, meaning “same,” and genos, meaning “kind”. The degree to which a test measures a single factor.
Heterogeneity
• The degree to which a test measures different factors.
• Composed of items that measure more than one trait.
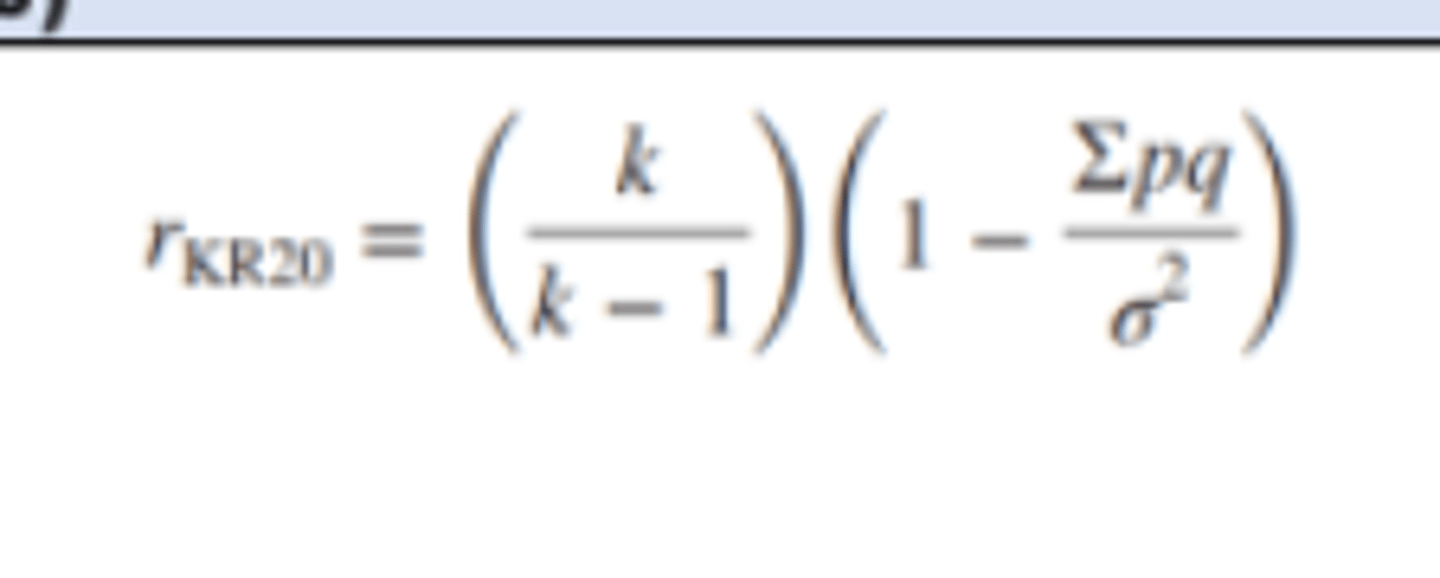
Kuder-Richardson Formula (KR-20)
• G. Frederic Kuder and M. W. Richardson
o Named because it was the 20th formula developed in a series.
• Determining the inter-item consistency of dichotomous items.
o Items that can be scored right or wrong (Eg. multiple-choice items).
o k: The number of test items.
o σ2: The variance of total test scores.
o p: The proportion of test takers who pass the item.
o q: The proportion of people who fail the item.
o Σ pq: The sum of the pq products over all items.
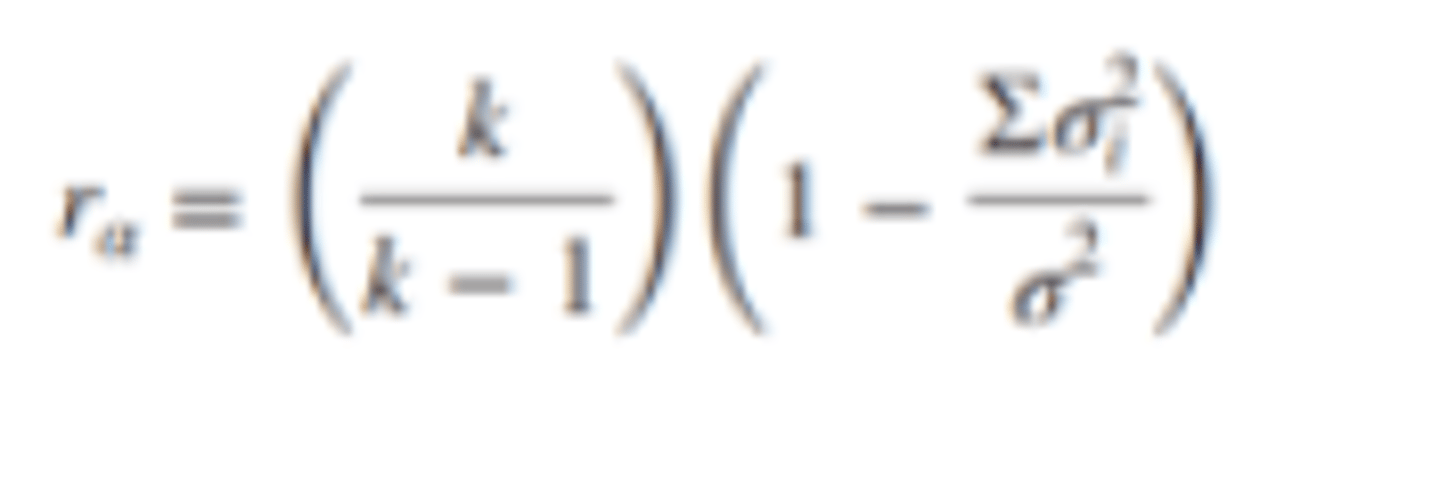
Coefficient Alpha
• Developed by Cronbach (1951)
• The mean of all possible split-half correlations, corrected by the Spearman–Brown formula.
o Use on tests containing non-dichotomous items.
o ra: Coefficient alpha
o k: The number of items, the variance of one item.
o Σ: The sum of variances of each item.
o σ2: The variance of the total test scores.
Coefficient Alpha
• Ranges in value from 0 to 1
o Help answer questions about how similar sets of data are.
o 0: absolutely no similarity to 1: perfectly identical
o a value of alpha above .90 may be “too high” and indicate redundancy in the items.
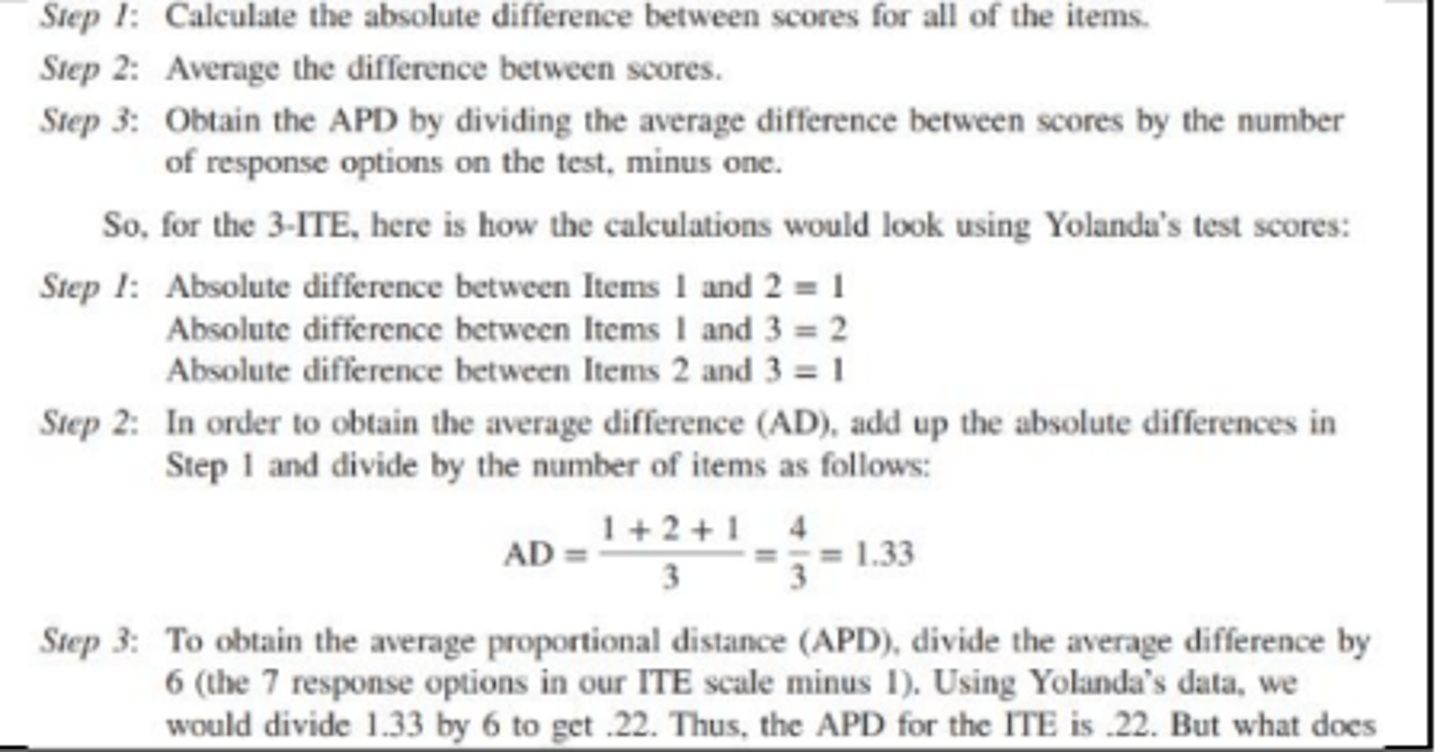
Average Proportional Distance (APD)
o A measure that focuses on the degree of difference that exists between item scores.
▪ .2 or lower: Excellent internal consistency
▪ .25 to .2: Acceptable internal consistency
5. Inter-scorer reliability
• The degree of agreement or consistency between two or more scorers with regard to a particular measure.
o Often used when coding nonverbal behavior.
▪ Eg. checklist of behavior about depressed mood.
• Coefficient of Inter-Scorer Reliability
o Way of determining the degree of consistency among scorers in the scoring of a test.
USING AND INTERPRETING A COEFFICIENT OF RELIABILITY
1. THE PURPOSE OF THE RELIABILITY COEFFICIENT
2. THE NATURE OF THE TEST
3. THE TRUE SCORE MODEL OF MEASUREMENT AND ALTERNATIVES TO IT
1. THE PURPOSE OF THE RELIABILITY COEFFICIENT
2. THE NATURE OF THE TEST
-Homogeneity Versus Heterogeneity of Test Items
-Dynamic versus Static Characteristics
-Restriction or Inflation of Range
-Speed Tests versus Power Tests
-Criterion-Referenced Tests
-Homogeneity Versus Heterogeneity of Test Items
Homogenous Items
• Tests designed to measure one factor.
• High degree of internal consistency.
Heterogenous Items
An estimate of internal consistency might be low.
-Dynamic versus Static Characteristics
Dynamic Characteristics
• A trait, state, or ability presumed to be ever-changing
as a function of situational and cognitive experiences.
o Not test-retest but measure of internal consistency is appropriate.
-Dynamic versus Static Characteristics
Static Characteristics
A trait, state, or ability presumed to be relatively
unchanging (Eg., intelligence).
o Test-retest or the alternate-forms method.
-Restriction or Inflation of Range
• Also called as ‘Restriction of Range’ or ‘Restriction of Variance’.
• If the variance of either variable in a correlational analysis is restricted by the sampling procedure used, then the resulting correlation coefficient tends to be lower.
• If the variance of either variable in a correlational analysis is inflated by the sampling procedure, then the resulting correlation coefficient tends to be higher.
-Speed Tests versus Power Tests
Speed Test
• Contains items of uniform level of difficulty so that,
when given generous time limits, all testtakers should be able to complete all the test items correctly.
o test-retest reliability, (2) alternate-forms reliability, or (3) split-half reliability from two separately timed half tests.
• Not be calculated from a single administration of the
test with a single time limit.
-Speed Tests versus Power Tests
Power Test
Some items are so difficult, and the time limit is long
enough to allow testtakers to attempt all items.
-Criterion-Referenced Tests
• Designed to provide an indication of where a testtaker stands with respect to some variable or criterion.
o Traditional procedures of estimating reliability are usually not appropriate for use with criterion-referenced tests.
3. THE TRUE SCORE MODEL OF MEASUREMENT AND ALTERNATIVES TO IT
Classical Test Theory (CTT)
Domain Sampling Theory and Generalizability Theory
Item Response Theory (IRT)
Classical Test Theory (CTT)
• also known as ‘True Score (or Classical) Model of Measurement’
• True Score
o A value that according to classical test theory genuinely reflects an individual’s ability level as measured by a
particular test.
Classical Test Theory (CTT)
• Advantages
o Notion that everyone has a “true score” on a test.
o Its assumptions allow for its application in most situations.
o Its compatibility and ease of use with widely used statistical techniques.
• Disadvantages
o CTT assumptions are characterized as “weak”—this precisely because its assumptions are so readily met.
▪ IRT assumptions being characterized in terms such as “strong,” “hard,” “rigorous,” and “robust.”
o All items are presumed to be contributing equally to the score total.
o The length of tests that are developed using a CTT model.
o Favor the development of longer rather than shorter tests.
Domain Sampling Theory and Generalizability Theory
1. Domain Sampling Theory
2. Generalizability Theory
1. Domain Sampling Theory
• Seek to estimate the extent to which specific sources of variation under defined conditions are contributing to the test score.
o Domain of Behavior: the universe of items that could conceivably measure that behavior, can be thought of as a hypothetical construct.
o !! Measures of internal consistency are perhaps the most compatible.
2. Generalizability Theory
• Developed by Lee J. Cronbach (1970) and his colleagues
• A person’s test scores vary from testing to testing because of variables in the testing situation.
o Universe:
Describe the details of the particular test situation leading to a specific test score.
o Facets
The number of items in the test, the amount of training the test scorers have had, and the purpose of the test administration.
o Universe Score:
The exact same test score obtained given the exact same condition of all the facets in the universe.
• Tests be developed with the aid of a generalizability study followed by a decision study.
o Generalizability Study: Examines how generalizable scores from a particular test are if the test is administered in different situations.
o Decision Study: Developers examine the usefulness of test scores in helping the test user make decisions.
• Asserts that test’s reliability is very much a function of the circumstances under which the test is developed, administered, and interpreted.
Item Response Theory (IRT)
Also called as ‘Latent-Trait Theory’
o The difficulty level of an item and the item’s level of discrimination.
o Difficulty: The attribute of not being easily accomplished, solved, or comprehended.
o Discrimination: The degree to which an item differentiates among people with higher or lower levels of the trait,
ability, or whatever it is that is being measured.
▪ Not all items of the test might be given equal weight.
Item Response Theory (IRT)
• 1. Dichotomous Test Items
o Test items or questions that can be answered with only one of two alternative responses.
o Eg. true–false, yes–no, or correct–incorrect questions.
• 2. Polytomous Test Items
o Test items or questions with three or more alternative responses.
o Only one is scored correct or scored as being consistent with a targeted trait or other construct.
RELIABILITY AND INDIVIDUAL SCORES
1. STANDARD ERROR OF MEASUREMENT (SEM or SEM)
2. THE STANDARD ERROR OF THE DIFFERENCE BETWEEN TWO SCORES
1. STANDARD ERROR OF MEASUREMENT (SEM or SEM)
• Tool used to estimate or infer the extent to which an observed score deviates from a true score.
o Provides an estimate of the amount of error inherent in an observed score or measurement.
o The higher the reliability of a test, the lower the SEM.
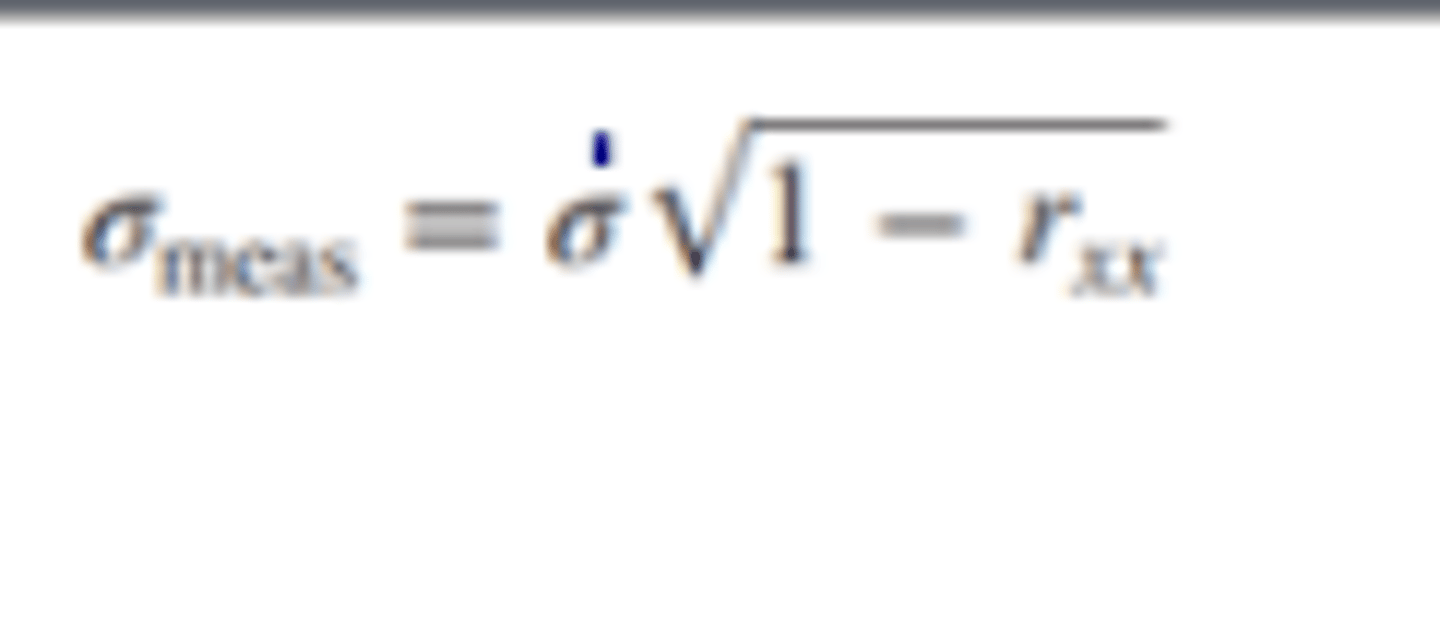
Standard Error of a Score
• Denoted by the symbol σmeas
• An index of the extent to which one individual's scores vary over tests presumed to be parallel.
o σ: The standard deviation of test scores by the group oft esttakers.
o rxx: The reliability coefficient
Confidence Interval
• A range or band of test scores that is likely to contain the true score.
o Used to set the confidence interval for a particular score or to determine whether a score is significantly different from a criterion.
2. THE STANDARD ERROR OF THE DIFFERENCE BETWEEN TWO SCORES
• Standard Error of the Difference
o A statistical measure that can aid a test user in determining how large a difference should be before it is considered statistically significant.
▪ If the probability is more than 5% that the difference occurred by chance, then, for all intents and purposes, it is presumed that there was no difference.
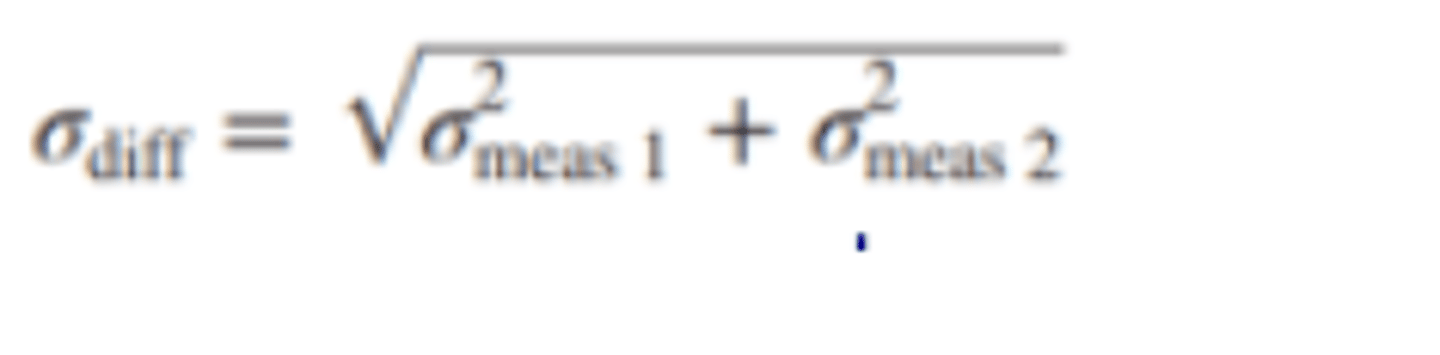
The formula for the standard error of the difference between two scores
▪ σdiff: The standard error of the difference between two scores.
▪ σ2meas1: The squared standard error of measurement for test 1.
▪ σ2meas2: The squared standard error of measurement for test 2.
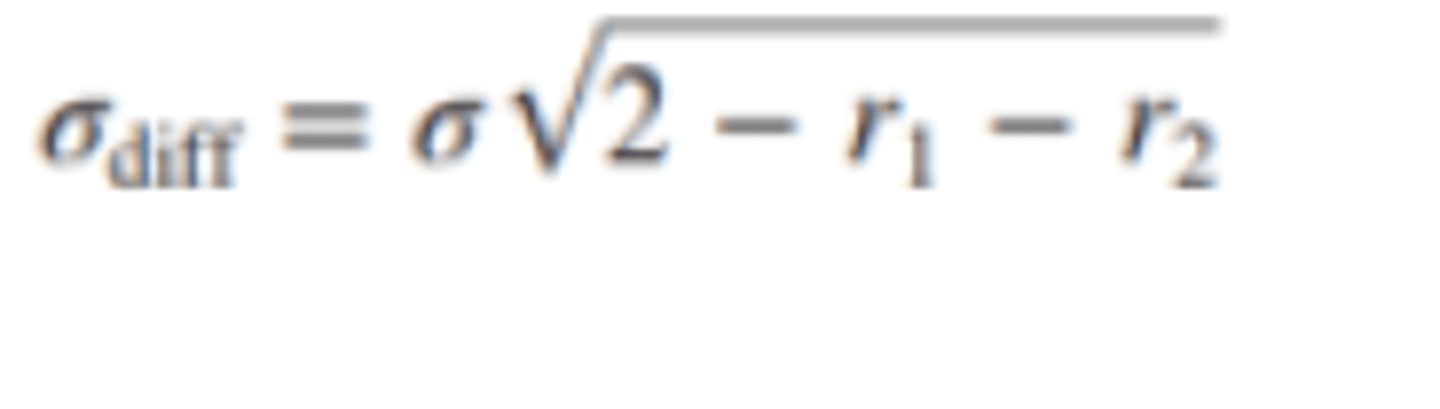
o The formula if we substitute reliability coefficients for the standard errors of measurement of the separate scores.
▪ r1: The reliability coefficient of test 1.
▪ r2: The reliability coefficient of test 2.
▪ σ: The standard deviation.
---fin---