ECOLOGY LAB 7 - DEMOGRAPHY
1/31
There's no tags or description
Looks like no tags are added yet.
Name | Mastery | Learn | Test | Matching | Spaced | Call with Kai |
|---|
No analytics yet
Send a link to your students to track their progress
32 Terms
Population
A group of interbreeding individuals of the same species occupying a given area at a given time
Life tables
uses information about age- and sex-specific mortality rates to determine patterns of survivorship and life expectancy.
Survivorship
the percentage of members of a group that are likely to survive to any given age
life expectancy
A figure indicating how long, on average, a person may be expected to live
Cohort life table
a group of individuals born at roughly the same time, from birth to death.
Static life table
A life table that records the survival and reproduction of individuals of different ages during a single time period (looking at a cemetery)
type one survivorship curve
most individuals live out their life span and die of old age (e.g., humans).
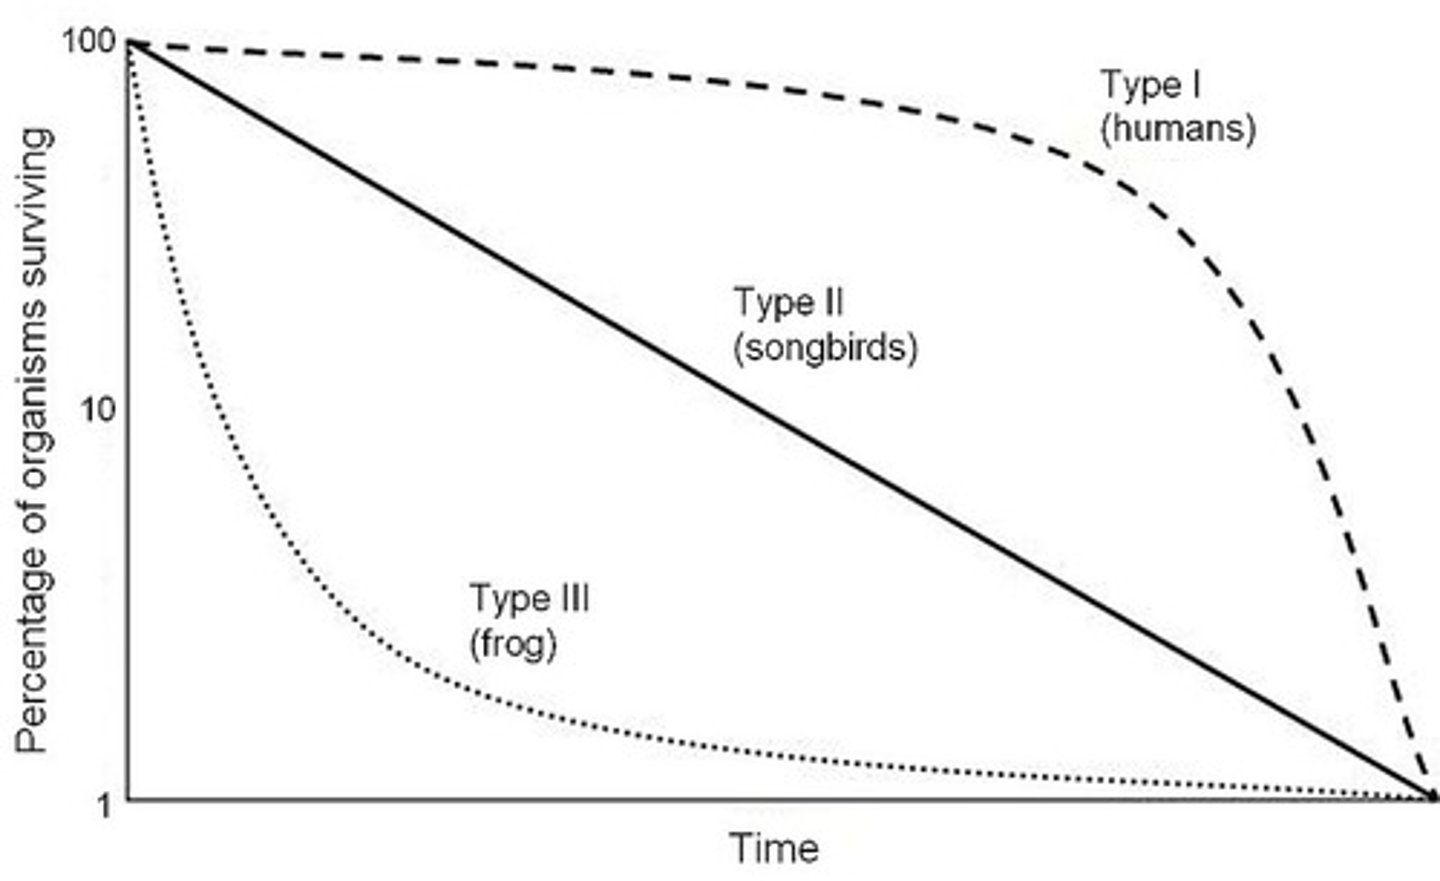
type two survivorship curve
survivorship is intermediate between the others and suggests that such species have an even chance of dying at any age.

type three survivorship curve
have the greatest probability of death at young ages. In other words, these species suffer very high mortality of eggs and young.

X
is the age class year (0 is first year, from birth to 1 year old, etc).

Nx
is the number of individuals alive at the start of the age class x

Lx
is the proportion of the original population alive at age class x (for x = 3, l x = 48/530 = 0.09);

Pseudoreplication
The error that occurs when samples are not independent, but they are treated as though they are.
Dx
is the number that die in age class x (starting with 530 at beginning of x = 0, subtract the 159 alive at x = 1, giving dx = 371)
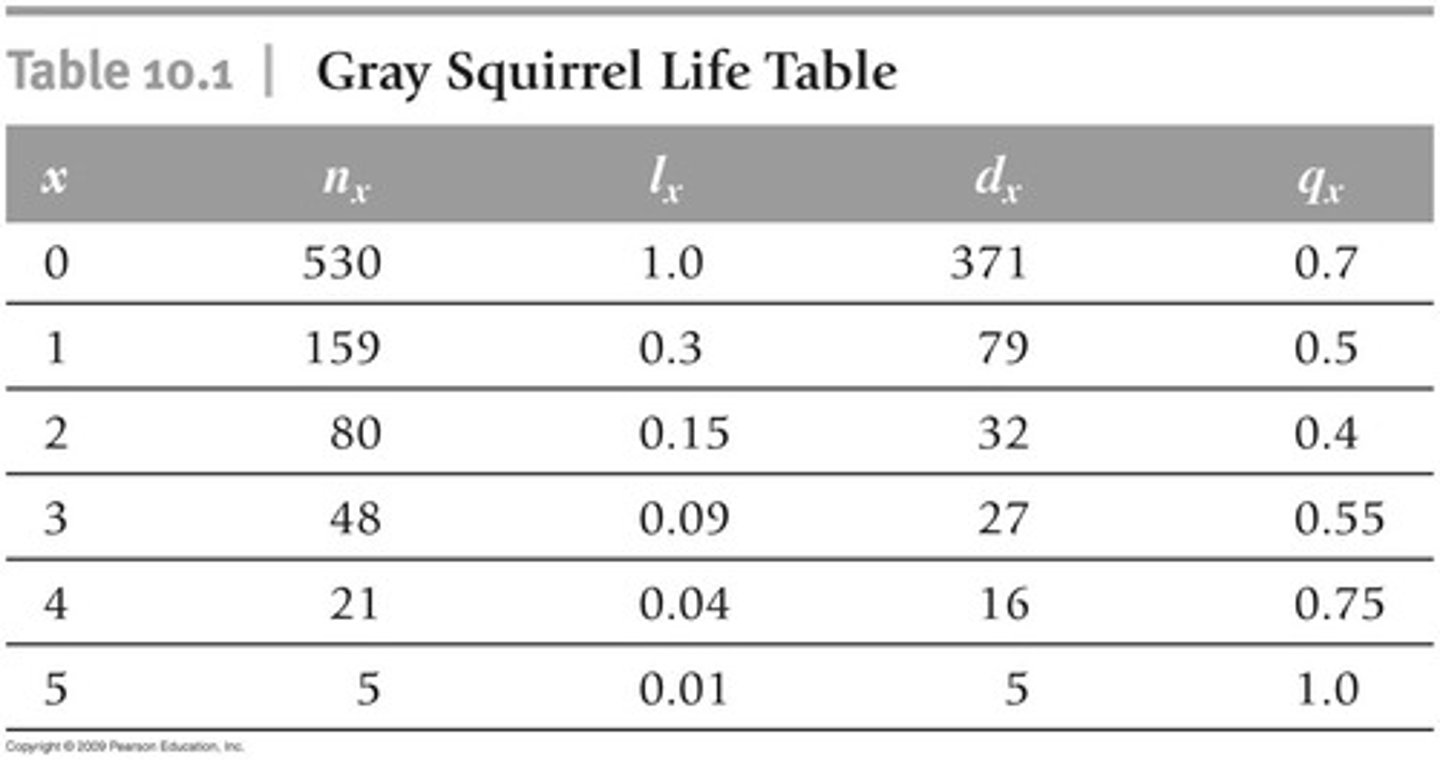
Qx
is the mortality rate, calculated by dividing the number dying in age class x by the number alive at the beginning of that age class (for x = 1, qx = 79/159 = 0.5).

Twice
We prevented pseudoreplication by copying over our data values _______ manually
Name, sex, birth, death
We collected data at each grave by collecting the ______, _____, _____ and _______ years
Life span
In addition to the previous data, we also included the _____ _____ by subtracting death and birth years
L(x), age
When plotting the survivorship data for the gray squirrel, the curve has the ____ on the y axis and the ____ on the x axis
=IF(death year, <>1950, life span, "")
How do you sort for life spans for before/after 1950 in excel?
=IF(sex="m", life span, "")
How do you sort for male/female life spans?
10, 0-110
For age groups, they were added in values of ____ ranging from __-__
=COUNTIF(<>1950 life span, ">=" & age group before)-COUNTIF(<>1950 life span, ">=" & age group after)
How do you calculate for d(x) in excel?
=(nx-dx)
How do you calculate for n(x) in excel? (Assuming that there is a previous n(x) value)
=SUM(dx)
How do you calculate for n(x) in excel? (Assuming that there isn't a previous value)
=nx/$$total dx (make sure you lock in the row and cell)
How do you calculate for l(x) in excel?
=dx/nx
How do you calculate for q(x) and %d(x) in excel?
Line, lx, age class
When plotting for the proportion of a population alive at a given age class, you would use a _____ graph, where ___ is on the y axis and ___ _____ is on the x axis
Line, qx/%dx, age class
When plotting for the proportion of a population alive at a given age class, you would use a _____ graph where ___/____ is on the y axis and ___ _____ is on the x axis
=COUNTIF(<>1950 life span, ">=" & age group before)-COUNTIF(<>1950 life span, ">=" & age group after)
How do you find the # of males/females that died in each age class in excel? (Same equation as d(x))
Negative, positive
After calculating the % of total male/female death by dividing each # per age group by the total, the male deaths for the graph are ________ and the female deaths for the graph are ________
Horizontal bar, %dx, age class
When plotting the age pyramid you use a _______ ____ graph where ____ is on the x axis and ____ _______ is on the y axis