Almost all of The challenge of natural Hazards - GCSE
1/130
Earn XP
Description and Tags
Does not include last adaptation and mitigation part from OneNote so go over that
Name | Mastery | Learn | Test | Matching | Spaced |
|---|
No study sessions yet.
131 Terms
Natural Hazard
A natural event (for example earthquake, volcanic eruption, tropical storm, flood) that threatens people or has the potential to cause damage, destruction and death.
Name the 4 types of natural hazard
Atmospheric Hazard
Terrestrial/Geological Hazard
Water Based Hazard
Biological Hazard
Atmospheric Hazard
Created in the atmosphere, by the movement of air and water
Terrestrial/Geological Hazard
Created by the movement of the Earth's tectonic plates or surface rock and soils
Water Based Hazard
Created by rivers, seas or oceans
Biological Hazard
Any biological substance that poses a threat to the health of people
Vulnerability and capacity to cope vary, the factors affecting hazard risk include
Natural Factors
Magnitude
Frequency
Population density and distribution
Level of development.
Management
Education
Time
Natural Factors
Things like rock type (geology) in an earthquake, the shape of a coastline in a tsunami, the height of the land hit by a tsunami can influence the effects. For example, a gently sloping coastline will often suffer more damage than a steep coastline in a hurricane’s storm surge. Earthquake shaking in soft sediments is larger and longer than when compared with the shaking experienced at a "hard rock" site. Softer sediments are more likely to liquefy too, which can contribute to building collapse.
Magnitude
The size of the event massively affects the impact it has. A hurricane of magnitude 5 on the Saffir Simpson scale will have more impact than that which has a magnitude 3, whilst every step up the Earthquake Richter scale represents a 10 fold increase in damage and a 30 fold increase in energy released.
Frequency
This is how often the hazard occurs. The more often a hazard occurs generally the more prepared people are, and the more used to coping they are. Large earthquakes and volcanic eruptions are generally very rare events in terms of a human lifespan so when they occur they can surprise. Floods are often regular events, large parts of Bangladesh flood every year for example. In this event people can adjust their buildings and lives to cope with the risk associated.
Population density and distribution
This is the number of people in an area and where they are. Generally, the greater the number of people in an area, the greater the potential for disaster. Therefore, an earthquake in Alaska will have less impact than one which hits a more densely populated area such as San Francisco. The Pacific Ring of fire covers a 40,000km horseshoe shape and has around 90% of the world’s earthquakes and 452 volcanoes. Hundreds of millions of people live in this zone.
Level of development of the place
This determines how much money is available to PREPARE for the event in advance in terms of predicting the hazard and PREPARING people to cope with it, and also determines how the country RESPONDS after the event, wealthy places tend to respond quicker. High Income Countries (HIC) are generally much better at preparing and responding to natural hazards because;
Governments
Technology
Planning Laws
Agencies
Factors in preparing for and responding to hazards: Government
Their governments are often stable and democratic and have lots of agencies that can help during an emergency. Being democratic means that the public can put pressure on the government to have life safe buildings that survive natural disasters, or makes then want to respond quickly as it will help get the politicians votes.
Factors in preparing for and responding to hazards: Technology
HICs can afford the technology to help them predict events, the USA has the United States Geological Survey to collect earthquake data from seismometers for example. They also have the technology to help buildings survive various natural hazards.
Factors in preparing for and responding to hazards: Planning Laws
Many HICs have laws that prevent building in hazardous locations, along a low coastline at risk from storm surges in a hurricane for example.
Factors in preparing for and responding to hazards: Agencies
Many HICs have agencies that can act quickly to help people after a disaster, such as a well-equipped army or fire service and experts to coordinate a response in both the short and long term.
Management - the 3Ps
Predict, prepare, prevent
Management: Predict
Some natural hazards are easier to predict than others, hurricanes can be identified by satellites and then tracked. This allows governments to evacuate if needed.
Management: Prepare
If a place is well prepared regardless of its level of development this can limit the impact of a hazardous event. In India, despite its low level of economic development, rounded wooden houses have been designed to be earthquake proof, thus limiting the impact of these hazards.
Management: Prevent
This could be preventing damage to buildings etc. through strict building rules.
Education
Regardless of level of development people can be educated to survive natural hazards. Education about the risks of contaminated flood water or Earthquake drills (like the ones Japan has on the 1st September to commemorate the 1923 Tokyo Earthquake) can save many lives.
Time
The amount of time since the last hazardous event can influence the impact, if a long time goes by people can be unprepared. Also, if the hazard occurs when lots of people are asleep they can also be unprepared. The Christchurch Earthquake of 2011 happened during the day when lots of people were at work, this contributed to the death toll as many got trapped in collapsed office buildings.
Plate Tectonics Theory
Plate Tectonics is a theory that tries to explain how the Earth is structured and what it is made up of. The Earth formed approximately 4.5 billion years ago following a huge explosion of a star. The materials that make up our earth slowly gathered together due to gravity, to create a ball of hot molten material. This material has slowly cooled over geological time, forming a crust at the Earth's surface of rocks. These rocks are fractured into huge segments called Tectonic plates.
These tectonic plates are moving about very slowly, pushed and shoved around from underneath by currents within the mantle called convection currents. Another theory suggests that this is more localised, with slabs of crust pushed apart at constructive plate margins (SLAB PUSH) and where the plates increase in density away from these margins get pulled down into the mantle (SLAB PULL) by gravity and local convection cells.
Beneath the crust temperatures start to rise as you descend into the second of the Earth's zones, the Mantle, a zone of molten Silicates and other minerals. The Earth does have a solid core of Iron and Nickel, which is solid despite temperature of 3700°C because of the intense pressure there.
Global distribution of earthquakes and volcanoes and their relation with plate margins
The Tectonic Plates vary in size. The major plates include the Pacific, Eurasian, African, Antarctic, North American and South American, and the Indo-Australian. There are other smaller plates however, such as the Philippines and Cocos plates. The tectonic plates join at zones called plate margins, where most of the world’s volcanic and earthquake activity occurs. Remember that this is a theory proposed by Alfred Wegener as CONTINENTAL DRIFT in 1912, and is now supported by lots of evidence since.
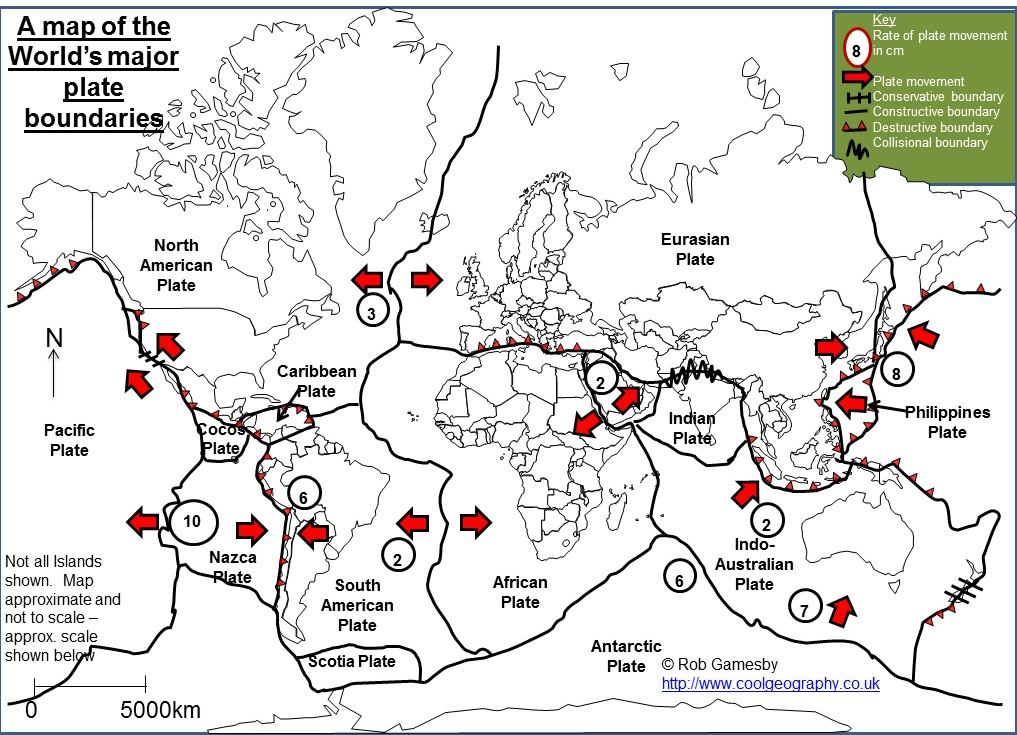
Plate boundary
The boundary or margin between two tectonic plates.
Tectonic hazard
A natural hazard caused by movement of tectonic plates (including volcanoes and earthquakes).
Tectonic plate
A rigid segment of the Earth’s crust which can ‘float’ across the heavier, semi-molten rock below. Continental plates are less dense, but thicker than oceanic plates.
Continental crust
Continental crust is thicker, older and lighter, and is composed mainly of Granite. It is 22 mi (35 km) thick on average and less dense than oceanic crust. Continental crust is more complex than oceanic crust in its structure and origin and is formed primarily at subduction zones at destructive plate margins.
Oceanic crust
Oceanic crust is younger and heavier, and is mainly composed of basalt and Gabbro. It is mainly formed at constructive margins or spreading mid ocean ridges.
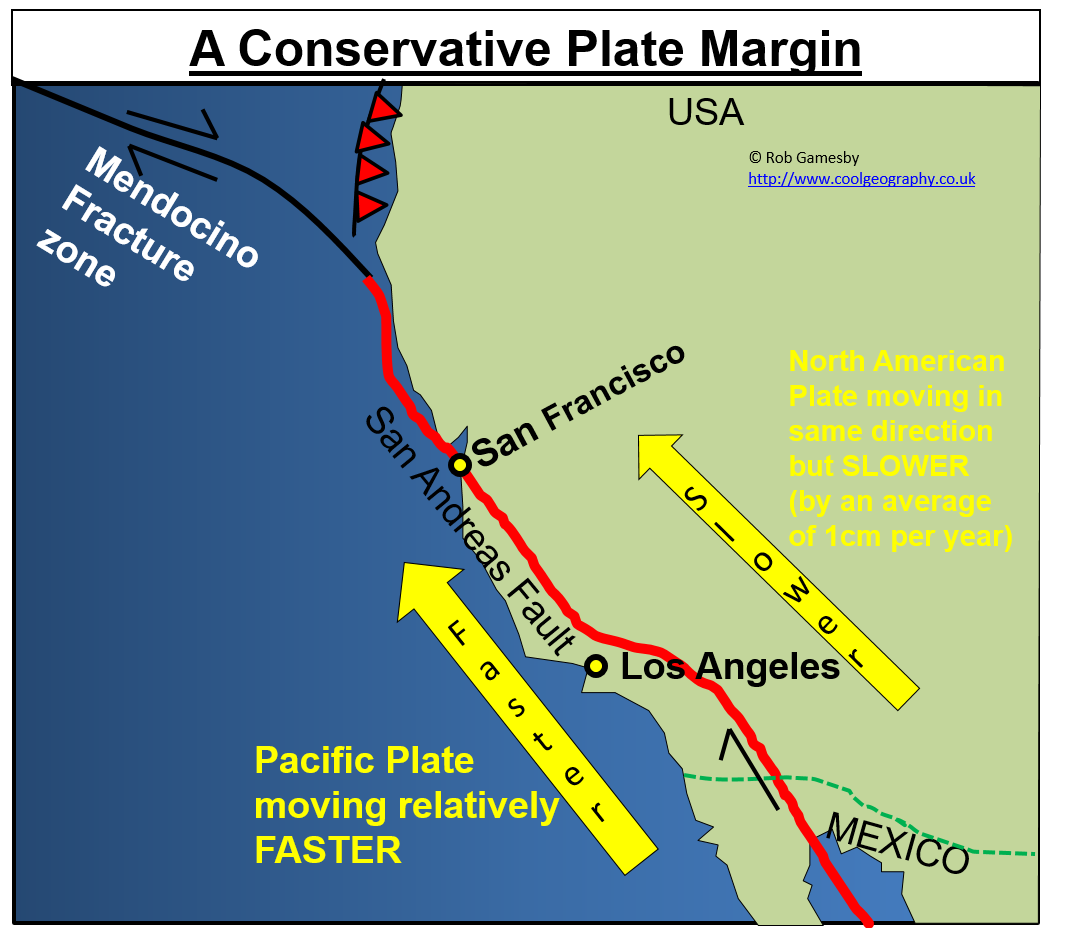
Conservative plate boundary
At conservative margins mountains are not made, volcanic eruptions do not happen and crust is not destroyed. Instead, 2 plates either slide past each other in opposite directions, or 2 plates slide past each other at different speeds. As they move past each other stress energy builds as the plates snag and grind on one another. When this stress energy is eventually released it sends shock waves through the earth’s crust. We know these shock waves as earthquakes, and a good example of this is the San Andreas Fault in California, where the Pacific plate is moving NW at a faster rate than the North American plate.
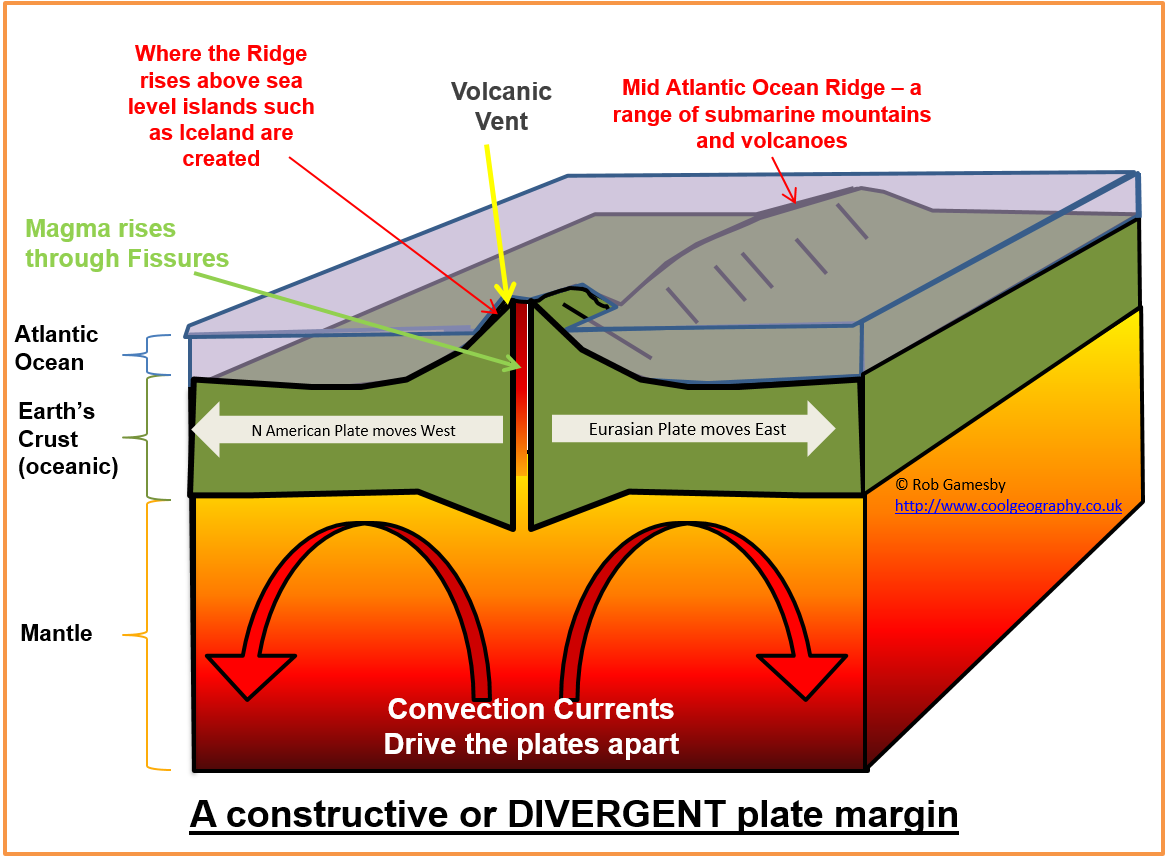
Constructive plate boundary
At this type of plate margin two plates are moving apart (DIVERGE) from each other in opposite directions. Convection currents moving in opposite directions (caused by the intense heat of the Earth's interior) in the mantle move two plates apart. As these plates move apart this leaves cracks and fissures (lines of weakness), that allows magma from the mantle to escape from the highly pressurised interior of the planet. This magma fills the gap and eventually erupts onto the surface and cools as new land. This can create huge ridges of undersea mountains and volcanoes, and where these mountains poke above the level of the sea, islands are created. Both earthquakes and volcanoes can result at these margins, the earthquakes caused by the movement of magma through the crust. A really good example of this is the Mid-Atlantic Ridge, where the Eurasian plate moves away from the North American plate at a rate of around 4cm per year. Iceland owes its existence to this ridge.
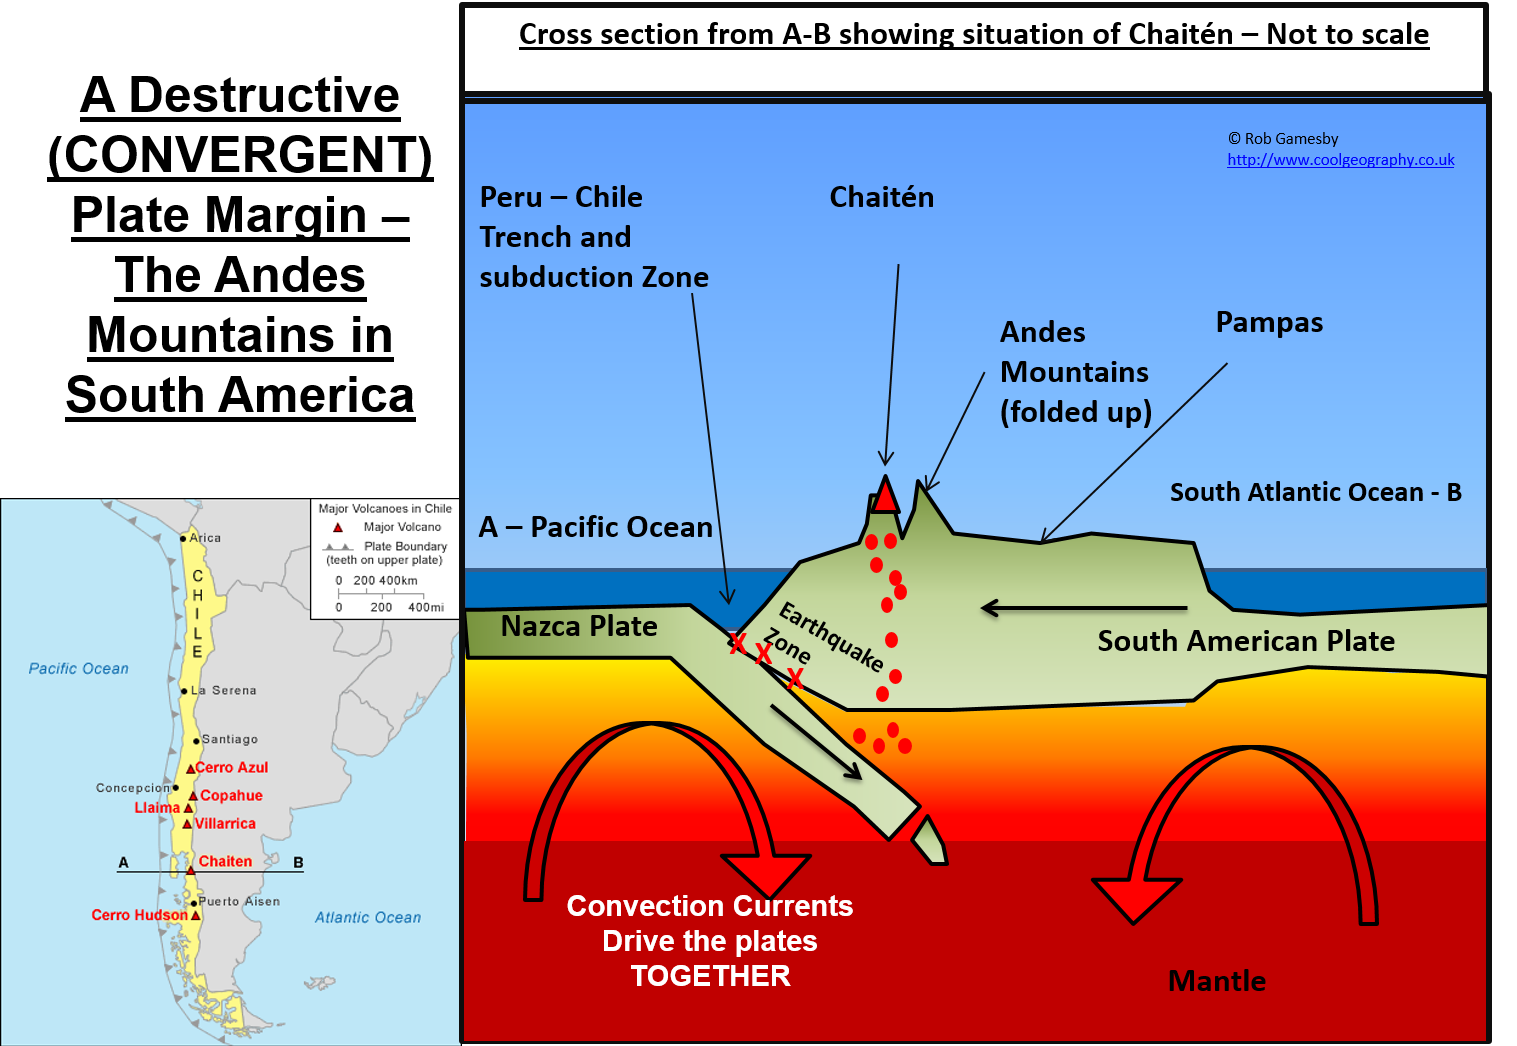
Destructive plate boundary
At these margins 2 plates move or CONVERGE together and the destruction of some of the Earth's crust results. An oceanic plate (denser) is pushed towards a continental plate (less dense) by convection currents deep within the Earth's interior. The oceanic plate is subducted (pushed under) the continental plate at what is called a subduction zone, creating a deep ocean trench. It is the Oceanic crust which sinks down into the mantle because it is denser (heavier). As it descends friction, increasing pressure and heat from the mantle melt the plate. Some of this molten material can work its way up through the continental crust through fissures and cracks in the crust to collect in magma chambers. This is often some distance from the margin where magma can eventually re-emerge at the surface to create a range of mountains. The movement of the plates grinding past one another can create earthquakes, when one plate eventually slips past the other releasing seismic energy. There are several really good examples of destructive plate margins, including along the West coast of the Americas and Japan, where the Philippines sea plate is pushed under the Eurasian plate.
Primary Effects
Primary Effects are the direct impacts of a natural hazard, so they are caused either by the earth shaking or a volcano erupting and happen during or immediately after an event.
Secondary Effects
Secondary Effects are the indirect effects caused by the primary effects after the main event and can last longer than the primary effects
Primary effects of generic earthquakes
People killed and injured.
Property, buildings and homes destroyed.
Bridges, roads, ports and railways destroyed.
Gas and water pipes and electric cables are broken.
Secondary effects of generic earthquakes
Tsunamis
Landslides
Fires
Communities cut off from electricity due to power lines and wires broken
Communities cut off from others due to damaged roads
Cholera outbreaks due to wastewater leaking from damaged pipes and contaminating clean water
Primary effects of volcanoes
Farmland destroyed from volcanoes
Homes covered in lava and ash
Flights grounded by ash clouds
Water contaminated by lava and ash
Toxic gases released
Secondary effects of volcanoes
Eruptions cause glaciers to melt which leads to flooding
Mudflows/lahars caused by meltwater mixing with ash
Increase in tourism
Immediate responses
Immediate responses are help given within the first few days or hours of the disaster to minimise the death toll.
In LICs the loss of life can be greater as they rely on HICs for support which can take a few days to come through and places can even be inaccessible as a singular road going into an effected place may be damaged.
Immediate responses for a generic tectonic hazard
Evacuating people beforehand if possible
Rescuing people from collapsed buildings, stranded by flood water, etc.
Providing emergency supplies of food, water, shelter and medical care
News stories published to increase emergency supplies and to aid search and rescue missions
Long term responses
Long term responses take place within the first weeks and months after a tectonic event to help rebuild and reconstruct areas that have suffered extensive damage. The aim is to help people to return to their normal lives as quickly as possible and to reduce the damage of tectonic hazards in the future.
Long term responses for a generic tectonic hazard
Repairing or rebuilding properties and transport infrastructure
Restoring essential utilities that were lost such as repairing gas mains, water pipes and electricity cables
Rehoming people living in temporary accommodation
Minimising future risk of damage and loss of life
Primary effects on L’Aquila
As a direct result of the earthquake, an estimated 309 people were killed,
1,500 were injured and 67,500 were made homeless. It struck at 3.32 a.m., so
most people were asleep in buildings which collapsed. Approximately 10,000
15,000 buildings collapsed, including:
many churches, medieval buildings and monuments with considerable cultural value
the Basilica of St Bernardino, the National Museum and Porta Napoli
San Salvatore Hospital, which was so severely damaged that patients had to be evacuated as it could not cope with injured victims
several buildings in L’Aquila University, with some fatalities in its student accommodation.
The estimated cost of the earthquake was US$16 billion
Secondary effects on L’Aquila
Access to some areas of the city was restricted due to unsafe buildings.
Aftershocks triggered landslides and rockfalls, causing damage to housing and transport.
A landslide and mudflow was caused by a burst main water supply pipeline near the town of Paganio.
The numbers of students and applications at L’Aquila University has decreased.
The lack of housing for all residents meant house prices and rents increased.
Much of the city’s central business district was cordoned off due to unsafe buildings.
Some ‘red zones’ still exist, which has reduced the amount of business, tourism and income.
Primary effects on Gorkha
A total of 8,841 dead, over 20,000 injured and 3 million made homeless.
Historic buildings and temples in Kathmandu, including the iconic Dharahara Tower, a UNESCO World Heritage Site, in which 200 people
were estimated to be trapped, were destroyed; there were no compulsory building standards in Nepal, so many modern buildings collapsed.
The destruction of 26 hospitals and 50 per cent of schools. (Save the Children estimated 29,000 more people would have been killed if the earthquake had struck during school hours.)
A reduced supply of water, food and electricity.
352 aftershocks, including a second earthquake on 12 May 2015 measuring 7.3 magnitude.
The cost of the damage was estimated to be around US$5 billion.
Secondary effects on Gorkha
Landslides occurred along steep valleys. 250 people were killed when the village of Ghodatabela was covered in material.
People were evacuated due to the risk of flooding when a landslide blocked the Kali Gandaki River
The earthquake triggered an avalanche on Mount Everest. It swept through Everest Base Camp, which is used by international climbing expeditions. Out of the nineteen who died, several were tourists and the rest were members of an ethnic group in Nepal called Sherpas. Sherpas work as porters, guides and cooks. They are aware of the dangers of Mount Everest, but tourism can provide them with an income to help lift them out of poverty. In 2014, the World Travel and Tourism Council reported that tourism was 8.9 per cent of Nepal’s GDP and provided 1.1 million jobs. It was expected to increase by 5.8 per cent in 2015, but until Nepal has recovered from the earthquake, tourism, employment and income will shrink. The earthquake happened just before the monsoon season, when rice is planted. Rice is Nepal’s main diet, and two-thirds of the population depend on farming. Rice seed stored in homes was ruined in the rubble, causing food shortages and income loss.
Immediate responses for L’Aquila
For those made homeless, hotels provided shelter for 10,000 people and 40,000 tents were given out. Some rain carriages were used as shelters. The then prime minister, reportedly offered some of his homes as temporary shelters.
Within an hour, the Italian Red Cross was searching for survivors. They were helped by seven dog units, 36 ambulances and a temporary hospital. Water, hot
meals, tents and blankets were distributed. The British Red Cross raised £171,000 in support.
Mortgages and bills for Sky TV, gas and electric were suspended. The Italian Post Office offered free mobile calls, raised donations and gave free delivery for
products sold by small businesses.
L’Aquila was declared a state of emergency, which sped up international aid to the area from the EU and the USA. The EU granted US$552.9 million from its
Solidarity Fund for major disasters to begin rebuilding L’Aquila. The Disasters Emergency Committee (DEC), a UK group, did not provide aid because it considered Italy a more developed country (HIC) which had the resources to provide help, and had the help of the EU.
Long term responses for L’Aquila
No taxes were paid by the residents of L’Aquila during 2010
To encourage students back to the University fees were dropped for 3 years and were given free public transport and discounts on educational equipment.
A memorial procession is held on the anniversary of the earthquake.
Homes took several years to rebuild and historic centres are expected to take approximately 15 years to rebuild.
Additionally, in October 2012, six scientists and one government official were found guilty of manslaughter as they had not predicted the earthquake. They were accused of giving residents a false sense of confidence and seriously underestimating the risks and had to pay multi-million euro fines.
Since then all new buildings have been built with features that limit the effect of earthquakes keeping people safe.
Immediate responses for Gorkha
Nepal requested international help. The UK’s DEC raised US$126 million by September 2015 to provide emergency aid and start rebuilding the worst-hit areas.
500000 temporary shelters were set up and The Red Cross provided tents for 225,000 people.
The United Nations (UN) health agency and the World Health Organization (WHO) distributed medical supplies to the worst-affected districts. This was important as the monsoon season had arrived early, increasing the risk of waterborne diseases.
Rescue teams, medical support and water was provided by The UK, China and India.
Nepal’s mountainous terrain and inadequate roads made it difficult for aid to reach remote villages. 315,000 people were cut off by road and 75,000 were additionally unreachable by air.
Sherpas were used to hike relief supplies to remote areas.
Facebook launched a safety feature so people could indicate they were ‘safe’.
Several companies did not charge for telephone calls.
Long term responses for Gorkha
Buildings were constructed from to stricter codes
Homeless people were re-housed and 7000 schools were re-built
Areas affected by landslides were cleared and roads were repaired
Nepal’s government (along with the UN, EU, World Bank, Japan International Cooperation Agency and Asian Development Bank) carried out a Post-Disaster
Needs Assessment. It reported that 23 areas required rebuilding, such as housing, schools, roads, monuments and agriculture.
Eight months after the earthquake, the Office for the Coordination of Humanitarian Affairs (OCHA) reported that US$274 million of aid had been committed to the recovery efforts.
The Durbar Square heritage sites were reopened in June 2015 in time to encourage tourists back for the tourism season.
Mount Everest was reopened for tourists by August 2015 after some stretches of trail were re-routed. By February 2016 the Tourism Ministry extended the climbing permits that had been purchased in 2015 to be valid until 2017, so that climbers would return and attempt Everest again.
A recovery phase started six months later by the Food and Agriculture Organization of the United Nations (FAO) to expand crop production and growing
seasons, individuals were trained how to maintain and repair irrigation channels damaged by landslides in the earthquake.
Differences in Wealth and Their Impact on Nepal (2015) and Italy (2009) Earthquakes: Nepal 2015 - LIC
Building Standards: Limited enforcement of building regulations meant many homes and infrastructure were poorly constructed and collapsed easily during the earthquake.
Emergency Response: Lack of resources and equipment delayed rescue efforts and hindered the ability to provide medical care and shelter.
Healthcare: Underfunded healthcare systems struggled to cope with the large number of injured people.
Preparedness: Limited investment in disaster preparedness and education meant many people were unaware of how to respond during the earthquake.
Economic Vulnerability: A high reliance on agriculture meant livelihoods were severely disrupted, compounding the economic impact.
International Aid Dependence: Recovery heavily relied on foreign aid and international NGOs, which delayed some aspects of rebuilding due to logistical challenges.
Infrastructure Damage: Poor infrastructure, such as roads and communication systems, was significantly affected, slowing relief efforts.
Differences in Wealth and Their Impact on Nepal (2015) and Italy (2009) Earthquakes: Italy 2009 - HIC
Building Standards: Stricter building codes meant fewer buildings collapsed; however, corruption led to some substandard construction, resulting in unexpected damage.
Emergency Response: Well-equipped emergency services and efficient government coordination meant quicker and more effective rescue operations.
Healthcare: Advanced healthcare facilities and access to medical professionals ensured better treatment for the injured.
Preparedness: Investment in disaster preparedness and drills meant the population better understood how to respond to the earthquake.
Economic Resilience: A diversified and robust economy allowed for quicker recovery and less disruption to livelihoods.
Insurance: The availability of insurance schemes for property and businesses meant financial recovery was faster for affected individuals.
Reconstruction: Sufficient government resources enabled organised and timely rebuilding of infrastructure and homes.
Why live in tectonic areas
Farming
Mining
Geothermal energy
Tourism
More/other
Why live in tectonic areas: Farming
Lava and ash erupting from volcanoes kill livestock and destroy crops and vegetation. After thousands of years, weathering of this lava releases minerals and leaves behind extremely fertile soil, rich in both nutrients and minerals. Land can be farmed productively in these areas to provide a source of food and income. Volcanic soils are found on less than one per cent of the Earth’s surface, but support 10 per cent of the world’s population. Naples, Italy has olives, vines, nuts and fruit (mainly oranges and lemons) growing area to Mount Vesuvius. The World’s highest quality coffee is grown on volcanic soil in Columbia.
Why live in tectonic areas: Mining
Settlements develop where valuable minerals are found, as jobs are created in the mining industry. It is not just dormant and extinct volcanoes that are mined, but also active volcanoes. Sulphur can be mined, Ljen volcano has a crater lake, which is the site of a sulphur mining operation, because of the high sulphur levels on the lake floor and is an active volcano. Sulphur is sold, for example, to bleach sugar, make matches, medicines and fertiliser.
However, mining in active volcanoes is dangerous as:
Miners can afford little protective clothing.
Hydrogen sulphide and sulphur dioxide gases burn their eyes and throat and cause respiratory diseases.
In the last 40 years, 74 miners have died from the fumes.
Loads of sulphur weighing 100 kilograms are carried up and down the rocky and slippery mountain paths. Nevertheless, miners can earn an average of six dollars per day (more than on a coffee plantation), so miners continue to live and work in these dangerous areas.
Why live in tectonic areas: Geothermal energy
Geothermal energy can be harnessed from the Earth. The steam heated by lava drives turbines in geothermal power stations to produce electricity for domestic and industrial use. Countries such as Iceland and New Zealand use this method of generating electricity. In volcanically active areas, geothermal energy is a major source of electrical power. It is renewable energy - it will not run out, and it will reduce greenhouse gases and the likely effects of climate change. Hellisheidarvirkjun (or Hellisheidi) power plant is the largest geothermal power station in Iceland and the second largest in the world. It provides electricity and hot water for the capital, Reykjavik. Geothermal energy produces approximately 30 per cent of Iceland’s total electricity.
Why live in tectonic areas: Tourism
Volcanoes attract millions of visitors around the world every year. Apart from the volcano itself, hot springs and geysers can also bring in tourists. This creates many jobs for people in the tourism industry. This includes work in hotels, restaurants and gift shops. Often locals are also employed as tour guides. More than 100 million people visit volcanic sites every year. The revenue they generate benefits the locals and the countries they are in. Mount Etna, attracts thousands of tourists, who travel in cable cars and 4 wheel drives to the crater, providing a range of jobs for local people. The Blue Lagoon in Iceland is heated by geothermal heat and 1.2 million people visited the Lagoon in 2010.
Why live in tectonic areas: More/other
Some settlements have grown into enormous cities and would be hard to move anywhere else.
Some places are well prepared for hazards so people feel safe.
A good job and way of life may keep you in a danger zone.
Large settlements in seismic zones offer job opportunities, such as San Francisco in the USA. San Francisco is in the Bay area, which has a GDP of $535 billion, & ranks 19th in the world when compared to national economies.
People in Mount Merapi, Indonesia, worship ancient spirits believing they will warn them of an eruption, on a full moon they throw items into the volcano crater to calm the volcano’s spirits.
People believe the chances of the volcano erupting are very slim.
Poor people, especially in LICs cannot afford to live away from volcanoes as they provide jobs and their families and friends live there.
Engineering can make people feel safe in these areas in richer parts of the world. Buildings can be made to be earthquake proof like the Bird’s Nest stadium in Beijing.
Many volcanic and earthquake events are INFREQUENT – so people don’t think they will get caught up in a disaster.
People do not wish to leave because their friends and family are there. It is often cheaper and easier to stay, especially when the risks may not be perceived as dangerous enough, or residents believe that a disaster won't occur.
Reducing risk
Large scale monitoring of tectonic activity does allow us to narrow down the locations and time frames however, and we monitor volcanoes and earthquakes in many ways. The most widely used method is studying the geographical area of the volcano.
Management stragegies
Techniques of controlling, responding to, or dealing with an event.
Monitoring
Recording physical changes, such as earthquake tremors around a volcano or tracking a tropical storm by satellite, to help forecast when and where a natural hazard might strike.
Planning
Actions taken to enable communities to respond to, and recover from, natural disasters, through measures such as emergency evacuation plans, information management, communications and warning systems.
Prediction
Attempts to forecast when and where a natural hazard will strike, based on current knowledge. This can be done, to some extent for volcanic eruptions and tropical storms, but less reliably for earthquakes.
Protection
Actions taken before a hazard strikes to reduce its impact, such as educating people or improving building design.
Seismic waves
Scientists can use seismic or earthquake waves to show if a volcano is getting ready to erupt. Many volcanoes experience an increasing intensity in frequency and size of earthquakes as they prepare to erupt. We can monitor these using seismometers which produce seismographs. This technique was used in Nevado Del Ruiz in 1985 and for Mount Pinatubo in 1991.
Monitoring gas emissions
As Magma rises into magma chambers gases escape. One of the main gases is Sulphur Dioxide, and if its quantity in escaping volcanic gas increases this can signal the start of a major eruptive sequence. In the Mount Pinatubo Volcanic event the amount of Sulphur Dioxide increased by 10 times in 2 weeks.
Ground deformation
The movement of magma within the crust can deform the ground above. This has been witnessed at Yellowstone beneath Yellowstone Lake. This swelling of the volcano signals that magma has collected near the surface. Scientists monitoring an active volcano will often measure the tilt of the slope and track changes in the rate of swelling. Mount St Helens showed this prior to its eruption in 1980.
Satellite Images and Remote Sensing
Remote sensing is the use of satellites to detect things about the Earth’s surface. This is useful for monitoring any changes in volcanoes at the surface. Using satellites we can monitor the heat or thermal activity of the volcano to check for upwelling magma, we can check for escaping Sulphur dioxide using gas sensing and we can look to see if the ground is deforming by checking before and after images of the ground.
Siesmometers
For earthquakes the equipment above is used plus other equipment and measures, these include;
Using foreshocks by monitoring seismic waves– we often get small earthquakes before “the big one” that can give warnings. The Japan Tsunami (mag 9.0) was preceded by a massive magnitude 7.2 earthquake.
Laser beams
Laser beams can be used to detect plate movement by directing the beam across the fault line.
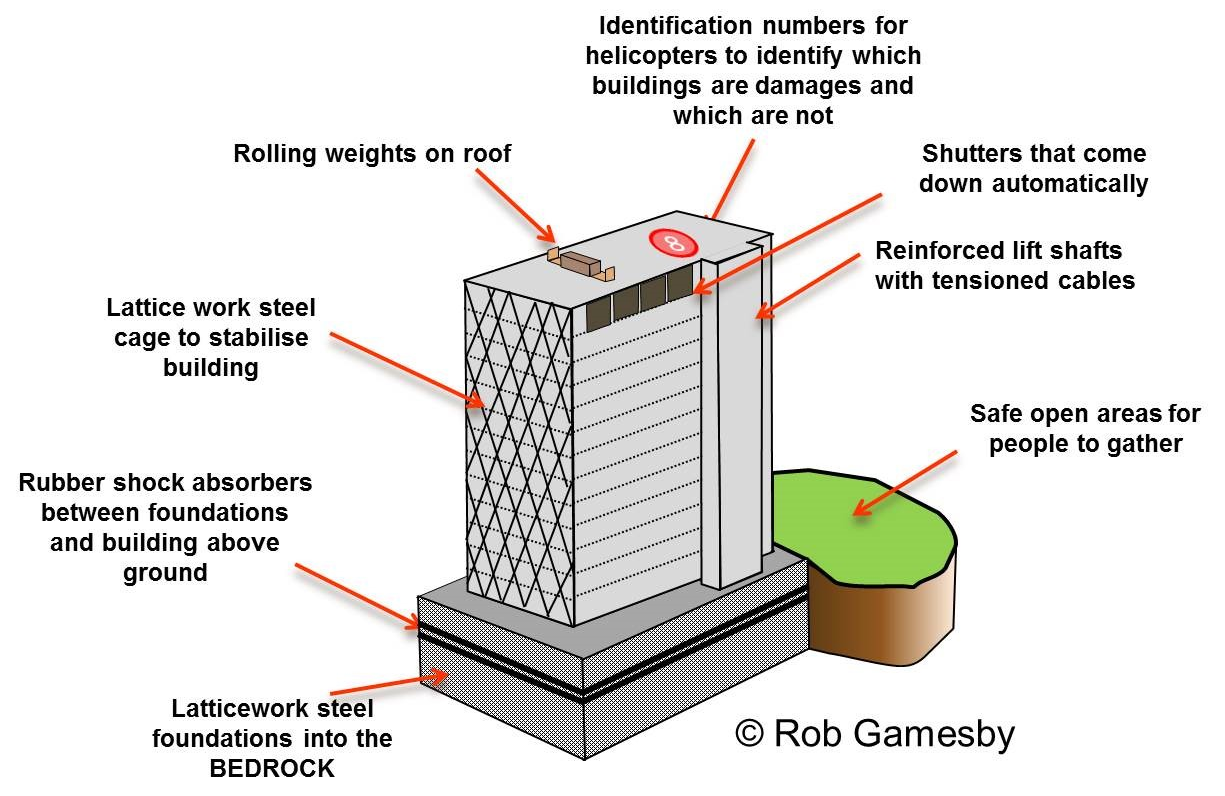
Earthquake protection
The best way to protect people from tectonic hazards is to look at the way we construct buildings and roads. Buildings can be designed to withstand the shaking of the earth and to limit the loss of life and damage caused. The Transamerica pyramid has a shape that can withstand seismic waves and withstood the 1989 Loma Prieta earthquake which struck San Francisco. Other strategies include rolling weights on the roofs of buildings, shatterproof glass to prevent scattering glass during a quake, emergency shutters for glass, gas shut off valves and identification numbers on buildings.
Earthquake proof building
Earthquake planning
We can also plan for earthquake and volcanic activity. Prior to events we can plan where we will or will not allow building. Preventing building on softer sediments can protect people from the worst of the shaking and liquefaction during earthquakes for example. Plans should also be in place prior to events so that emergency services know what to do during a volcanic or earthquake event
Animal behaviour
Animal behavior has been suggested as a method, as many observations have shown that animals react to an earthquake before the event and well before human beings.
Tilt meters can show ground deformation, leading to an earthquake. These have been replaced in many cases by more modern and wider ranging satellite imagery.
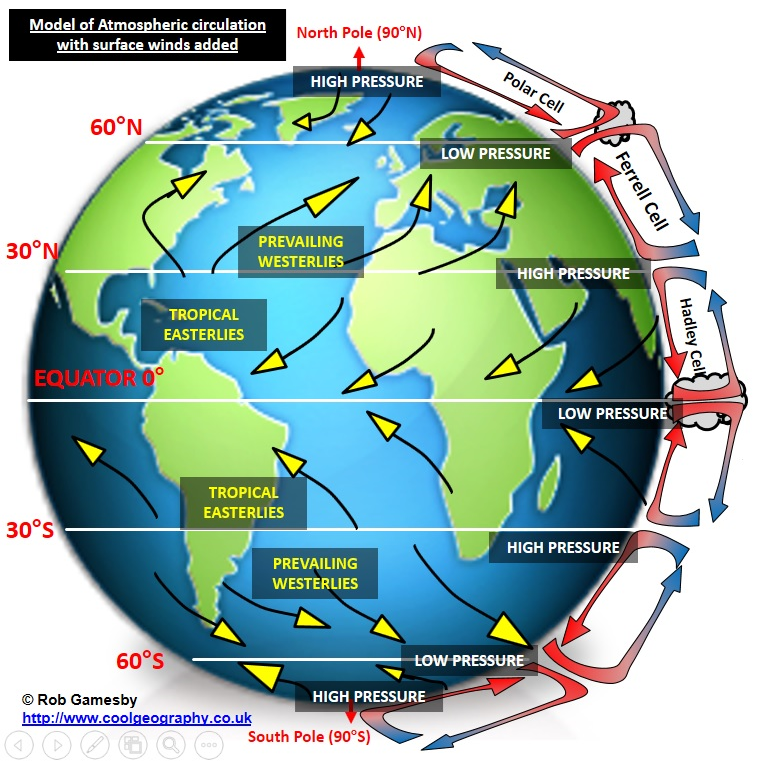
General atmospheric circulation model including pressure belts and surface winds
The Earth’s atmosphere is in constant motion and is driven by the energy received from the sun.
The air moving around the globe does so because we get more energy in tropical areas and less at the poles. Air movements or winds help to balance this out. They do so according to the model below.
Most insolation arrives between the 2 Tropics. This causes air to rise from the surface UP through the atmosphere in thermals at the Inter Tropical Convergence Zone (ITCZ). This creates huge cumulonimbus clouds as the air cools, Tropical storms with low pressure occur here. As the air heads North and South it cools and then sinks back down to the surface at approximately 30°N & S giving HIGH pressure. This goes back to the Equator as the TRADE winds or tropical easterlies. Two further cells exist further North and South. These cells are called the Hadley, Ferrel and Polar cells, giving 6 in total (3 in either hemisphere).
• Where air is sinking in the model this gives high pressure. These areas coincide with many of the earth’s deserts and dry areas as the air is sinking so little condensation occurs as the air warms.
• Where air is rising in the model this gives low pressure. These areas coincide with wetter areas with lush vegetation as air cools as it rises, allowing water vapour to condense to droplets allowing more rain.
• WINDS occur because air molecules move from areas of high pressure to areas of low pressure.
The model is disrupted by mountain ranges and differences between the land and sea.
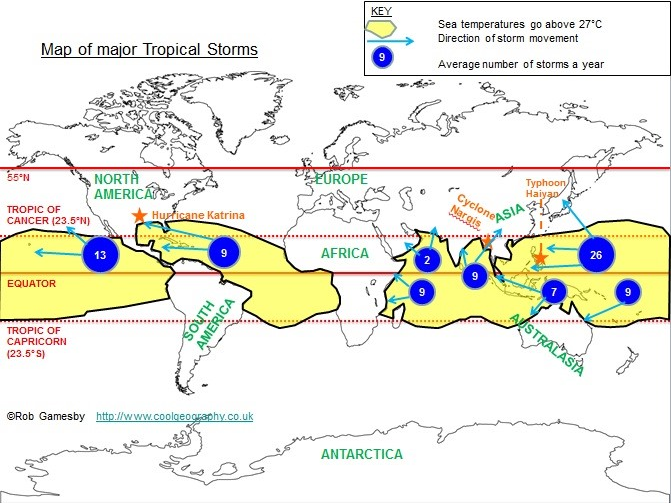
Global distribution of tropical storms (hurricanes, cyclones, typhoons)
As can be seen on the map, these storms all start within the Tropics over warm ocean waters. Their paths then take them outside of the tropics and they die out over time once they have made landfall. The most tropical storms can be found in the Asian Pacific.
The relationship between tropical storms and general atmospheric circulation
Global atmospheric circulation helps to determine patterns of weather and climate.
Tropical storms are an area of low pressure with winds moving in a spiral around the calm central point called the eye of the storm. Winds are powerful and rainfall is heavy. They can last for days to weeks within the Tropical regions of our planet.
Hurricanes occur when these tropical storms develop wind speeds of over 74mph (miles per hour). They are known by many names, including hurricanes (North America), cyclones (India) and typhoons (Japan and East Asia).
Global pressure and surface wind patterns influence precipitation in several important ways:
Rainfall is high and constant throughout the year near the Equator. As hot air rises, it cools slightly. Water vapour is converted into droplets of convectional rain.
The low-pressure zone around the Equator is called the intertropical convergence zone (ITCZ). Air rises and triggers bursts of torrential rain. Sometimes, the ITCZ grows a ‘wave’ of low pressure which extends further than usual. Tropical storms develop along these waves. Once they gain energy, they can travel even further away from the Equator (pages 24–5).
Rainfall is often higher in coastal areas in Western Europe due to the movement of the jet stream over the Atlantic. Rain-bearing weather systems called depressions (also known as cyclones) follow the jet stream, often bringing stormy conditions to the UK’s west coast (page 38).
Rainfall is often low around the Tropics of Capricorn and Cancer. Dry air descends there as part of the Hadley cell, resulting in arid conditions.
Precipitation is also very low in polar regions and falls mostly as snow. The cold air has a limited ability to hold water vapour.
The cause of tropical storms and the sequence of their formation
The sun sends incoming solar radiation to Earth warming our oceans
Eventually the ocean can warm to the critical 27 degrees C.
This causes warm, MOIST air to rise through the air in THERMALS giving LOW PRESSURE at the centre of the storm.
This cool air rises at 1 degree C per 100m causing condensation to occur, clouds to form and rain to occur.
Some cool air sinks back down helping to create the EYE.
Air rushes in from higher pressure areas from outside the storm to lower pressure areas at the centre of the storm creating winds.
The whole storm rotates because of the Earth’s spin.
Climate change
Climate change is a change in global or regional climate patterns
Tropical storm frequency
How often tropical storms occur
Tropical storm distribution
Where tropical storms occur
Tropical storm intensity
How strong tropical storms are
Why has the number of storms risen?
Recent warming of the climate means that there is more energy available in the atmosphere and ocean waters to fuel tropical storms. Due to a warming of global temperatures, the total number of storms in the North Atlantic has had an impact on the FREQUENCY number of moderate to long lived storms. We have also seen an increase in the number of short duration storms in all intensities.
What are the effects of increased frequency and intensity of storms?
Greater damage to human property
Higher storm surges (huge waves of water pushed up onto the land) which kill the majority of people that die in tropical storm events.
Primary effects of tropical storms
The primary effects of a tropical storm are the immediate impacts of strong winds, heavy rainfall and storm surges. These include:
People are injured or killed by debris being blown around
Drowning
Buildings are destroyed or damaged
Electric supplies are cut off due to power lines being destroyed
Sewage is released due to flooding
Water supplies become contaminated
Secondary effects of tropical storms
Secondary effects are the impacts following the storm. This can include:
People being left homeless
A lack of clean water and sanitation – water-borne diseases can affect local people.
Road and rail networks can be blocked by debris, making it difficult to provide support and aid for people affected.
Unemployment is caused by businesses being damaged
If crops are destroyed and/or livestock is killed, there can be a shortage of food
Immediate responses to tropical storms
Immediate responses occur before the storm is forecast to make landfall and immediately after the event.
people are evacuated before the storm lands
rescue people trapped and provide medical support for injured people
temporary shelters are set up for people made homeless by the storm
provide water and food for people
recover dead bodies
digital maps are updated immediately after the storm using satellite photographs to support emergency services on the ground
Aid provided by Governments and NGOs such as Oxfam
Long term responses to tropical storms
Long-term responses involve returning an area to the way it was before the storm and preparing for future storms.
repair and rebuild properties
rehouse people
repair the transport infrastructure
improve forecasting and early warning systems
provide grants and aid to people to help rebuild their homes
improve building regulations so that properties are constructed to withstand the impacts of tropical storms better
Offer incentives such as tax breaks to encourage economic recover
UK vs Philipines development stats
Indicator | Philippines | UK |
Population | 108 million | 64 million |
GDP per capita PPP | $4700 | $37,700 |
People Living in Poverty (less than $2 per day) | 27% of the population | 16.2% |
Access to Clean Water | 95.4% of the population | 100% |
Life Expectancy | 72 years | 80.4 years |
Literacy Rate | 48.7% | 99% |
People Per Doctor | 1.15 doctors per 1000 people | 2.81 doctors per 1000 people |
The primary effects of Typhoon Haiyan were
strong winds battered homes
people were made homeless, particularly around Western and Eastern Visayas
600,000 people displaced
electric was interrupted
airport badly damaged
roads were blocked by fallen trees and other debris
Leyte and Tacloban experienced a 5-metre storm surge, and 400mm of rainfall flooded an area of up to 1km inland
90% of Tacloban was destroyed
6190 people died
29,000 people were injured
4.1 million people were made homeless
14.1 million people affected
The overall cost of damage was around $12 billion
1.1 million tonnes of crops destroyed
1.1 million houses damaged
1 million farmers and 600,000 hectares of farmland affected
The secondary effects of Typhoon Haiyan were
Social effects
Infection and diseases spread, mainly due to contaminated surface and ground water.
Survivors fought for food and supplies. Eight people died in a stampede for food supplies.
Power supplies were cut off for months in some areas.
Education was disrupted as many schools were destroyed.
Seawater, chemicals and sewerage contaminated surface and groundwater.
Economic effects
An oil tanker ran aground, causing an 800,000-litre oil leak that contaminated fishing waters.
The airport was badly damaged and roads were blocked by debris and trees.
Looting was rife, due to the lack of food and supplies.
Rice prices had risen by nearly 12% by 2014.
Environmental effects
The leak from the oil barge led to ten hectares of mangroves being contaminated.
Flooding caused landslides.
Immediate responses of Typhoon Haiyan
The government issued a televised warning to people to prepare and evacuate.
Eight hundred thousand people were evacuated following a televised warning by the president. Many people found refuge in a stadium in Tacloban. However, many people died when it was flooded. The government provided essential equipment and medical supplies. A curfew was introduced two days after the typhoon to reduce looting.
Over 1,200 evacuation centres were set up to help the homeless.
Three days after the storm, the main airport was reopened, and emergency aid arrived. Power was restored in some regions after a week. One million food packs and 250,000 litres of water were distributed within two weeks.
Over $1.5 billion of foreign aid was pledged. Thirty-three countries and international organisations promised help, with rescue operations and an estimated US $ 88.871 million.
Long term responses of Typhoon Haiyan
A cash for work programme paid people to clear debris and rebuild Tacloban.
The international charity organisation Oxfam replaced fishing boats.
Build Back Better is the government’s response to the typhoon. Launched in 2014, it intended to upgrade damaged buildings to protect them from future disasters. They have also set up a no-build zone along the coast in Eastern Visayas, a new storm surge warning system has been developed, and mangroves replanted to absorb future storm surges.
By December, water tanks had been installed by charities like Oxfam but not in all areas.
6 Months later, many people still had limited access to shelter and water. NGOs like the International Red cross were trying to provide adequate settlements, fresh water access and access to jobs/livelihood.
The Philippines authorities have invested in disaster risk reduction (DRR) and climate change adaptation (CCA). They spent $624m on this in 2011 – two per cent of the national budget and 0.28 per cent of GDP – while at least five per cent of a local authority's revenue is set aside for its Local Disaster Risk Reduction Management Fund
In the immediate days how big was the Tacloban Government workforce compared to normal?
Tacloban was left with just 70 workers compared to 2500 normally. Many were killed, injured, lost family or were simply too traumatised to work.
Planning for tropical storms: Monitoring and prediction
Satellite and radar technology are used to track the development and approach of a tropical storm. These, combined with weather charts and computer software, are used to predict the path a tropical storm could take.
High-income countries (HICs), such as the USA, have an effective hurricane monitoring and prediction system. This is because they have the finances available to invest in these systems. All tropical storm activity over the Atlantic and Eastern Pacific are tracked by the National Hurricane Centre, located in Florida. As a result of this, a hurricane watch is issued when hurricane-strength winds are detected to alert people and give them time to prepare. The National Weather Service publicises this information.
Low-income countries are often less prepared for tropical storms. This is because monitoring equipment is expensive, and they may not have the ability to communicate information to people likely to be affected.
Planning for tropical storms: Protection
One of the most reliable methods of reducing life loss during a tropical storm is storm shelters. They are strong enough to withstand hurricane-force winds because they:
have windows covered with metal shutters;
are often built off the ground with deep-pile concrete pillars that dissipate energy;
are made from reinforced concrete.
High sea walls are also constructed along the coast to protect communities from storm surges.
Planning for tropical storms: Planning
Preparation is essential in reducing the impacts of tropical storms. People who live in areas prone to tropical storms are advised to stock up on food and water as they may be housebound for several days following a storm. Governments and NGOs, such as the Red Cross, advise people on preparing for and responding to tropical storms. Early warning systems are installed in countries such as Bangladesh, helping to reduce the number of deaths.
The most common natural hazards in the UK include
Floods, which seem to be increasing in intensity and frequency
Cold weather - the winter of 2010-11 being a great example
Heat waves that are increasing in frequency and intensity caused by anticyclones. These can bring drought to the UK
Storms with high winds and extreme rainfall, brought to us by mid latitude depressions from the Atlantic.
We also get less obvious hazards, for example, Britain gets over 30 Tornadoes a year.
How are natural hazards typically distributed in the UK?
These hazards have a DISTINCT GEOGRAPHIC PATTERN of distribution. The storms or depressions that bring windy and wet weather to Britain occur mainly in the WEST and the North, and the North West of Scotland gets these storms most often and at the greatest intensity. Flooding occurs in low lying areas around rives and at the coast, and more people than ever are living in flood risk areas. Extreme cold weather can affect all areas of the British Isles but is most likely in the North and at altitude, whereas heat waves are most likely in the South East. Tornadoes are most likely in the south in inland areas.
What is a depression?
A depression is an area of low atmospheric pressure and the British Isles experience them throughout the year but the most severe and frequent occur in autumn & winter. They bring strong winds and lots of rainfall.