MBF Final Unit 1 and 2
1/79
There's no tags or description
Looks like no tags are added yet.
Name | Mastery | Learn | Test | Matching | Spaced |
|---|
No study sessions yet.
80 Terms
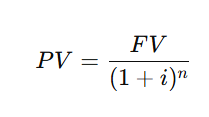
Present value formula- Simple
Where:
𝐹𝑉 = future value
𝑖 = interest rate
𝑛 = number of periods
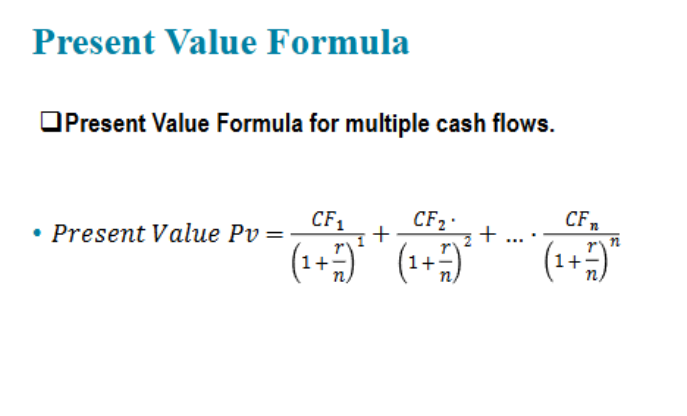
Present value for multiple cash flows
Where:
PV = present value (value today of all future cash flows)
CF of t= cash flow received in period t)
r = annual interest rate/ discount rate (interest rate per period)
t = time period when the cash flow is received
n = total number of periods
This includes any repeated cash flow stream
Present Value definition
Today’s value of a payment to be received in the future, when the interest rate is i.
Equation to find value today of future money
Key ideas:
Higher interest rate → lower present value
Longer time → lower present value
What happens to PV when the interest rate increases?
PV decreases- the higher the discount rate, the lower the present value
fixed-payment loan
A credit market instrument that provides the borrower with an amount of money that is repaid through fixed periodic (usually monthly) payments made over a set number of years
Discount bond
A credit market instrument that is bought at a price below its face value and whose face value is repaid at the maturity date; it does not make any interest payments. Also called a zero-coupon bond.
A discount bound is a bond that:
Short-term
Has no coupon payments
Is sold below par (below $1,000)
Pays one lump sum payment at maturity (the face value)
Difference between coupon and discount bond
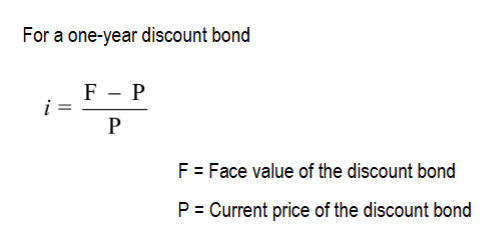
Unlike a coupon bond, a discount bond does not make any interest payments; it just pays off the face value.
For example, a one-year discount bond with a face value of $1,000 might be bought for $900; in a years time, the owner would be repaid the face value of $1,000.
Coupon Bond
A credit market instrument that pays the owner a fixed interest payment every year until the maturity date, at which time a specified final amount is repaid.
Face value:
A specified final amount paid to the owner of a coupon bond at the maturity date. Also called par value.
A coupon bond is a bond that:
Pays annual (or semiannual) coupon payments
Returns the face value at maturity
Has price that depends on the market interest rate
Ex: most treasury notes, corporate bonds
Coupon rate
The dollar amount of the yearly coupon payment expressed as the percentage of the face value of a coupon bond.
Coupon rate never changes (Coupon Rate = Coupon Payment/ Face Value).
Yield to maturity
The interest rate that equates the present value of payments received from a credit market instrument with its value today.
Alt: The discount rate that makes the present value of all a bond’s future cash flows equate its current price; essentially the bond’s internal rate of return if held to maturity.
Yield to maturity on discount bond
The yield to maturity equals the increase in price over the year divided by the initial price.
As with a coupon bond, the yield to maturity is negatively related to the current bond price.
Simple Loan
Refers to a credit market instrument giving the borrower an amount of funds that must be repaid to the lender at the date of maturity along with an extra payment (interest)
Yield to maturity on a simple loan
To calculate yield to maturity on a simple loan, use present value equation, and solve for i.
Example: If Pete borrows $100 from his sister and next year she wants $110 back from him, what is the yield to maturity on this loan?
Solution:
100 = 110/ (1+i) = 10%

Coupon bond formula
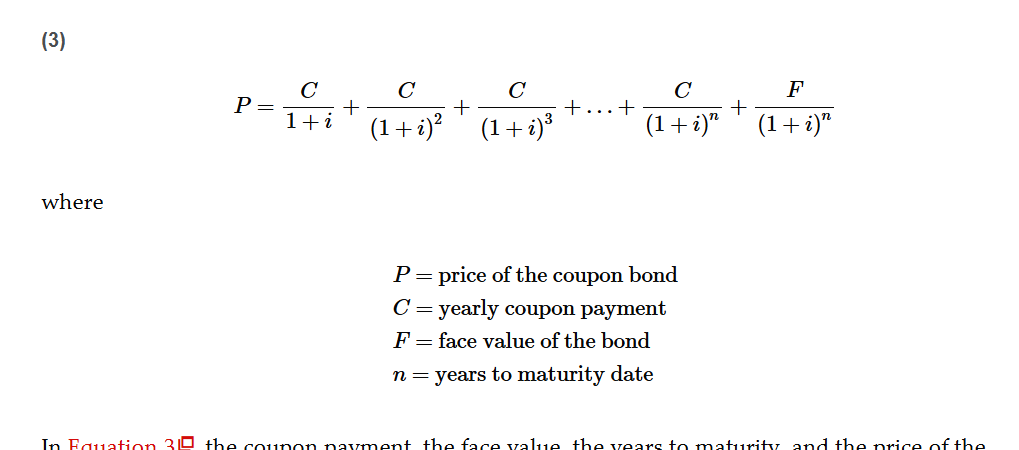
Coupon Bond Important Facts
When the coupon bond is priced at its face value, the yield to maturity equals the coupon rate
The price of a coupon bond and the yield to maturity are negatively related
Bond Pricing
When price is above par (face) value
YTM or Current Yield < Coupon Rate
When price is equal to par (face) value
YTM or Current Yield = Coupon rate
When price is below par (face) value
YTM or Current Yield > Coupon Rate
Bond Price vs. Yield
Key Concept: There is an inverse relationship between bond prices and yields.
Price ↑ → Yield ↓
Price ↓ → Yield ↑
This is because:
If a bond pays a fixed amount in the future, paying more today reduces your return
Paying less today increases your return
Why does a discount bond always sell below par?
Because it pays no coupon; investors only get the face value at maturity
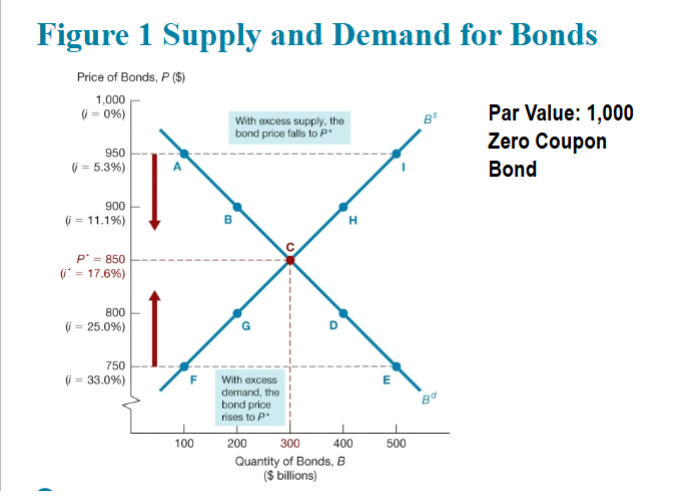
Figure 1 Supply and Demand for Bonds
Equilibrium in the bond market occurs at point C, the intersection of the demand curve Bd and the bond supply curve Bs. The equilibrium price is P* = $850, and the equilibrium interest rate is i* = 17.6%.
Theory of Portfolio choice
A theory that outlines how much of an asset people will want to hold in their portfolios, as determined by wealth, expected returns, risk, and liquidity.
The theory of portfolio choice provides a framework for deciding which factors will cause the demand curve for bonds to shift.
Theory of Portfolio Choice- What determines demand for an asset?
The quantity demanded of an asset is:
↑ Wealth → ↑ quantity demanded (positively related)
↑ Expected return (relative to alternatives) → ↑ quantity demanded (positively related)
↑ Risk (relative to alternatives) → ↓ quantity demanded (negatively related)
↑ Liquidity (relative to alternatives) → ↑ quantity demanded (positively related)
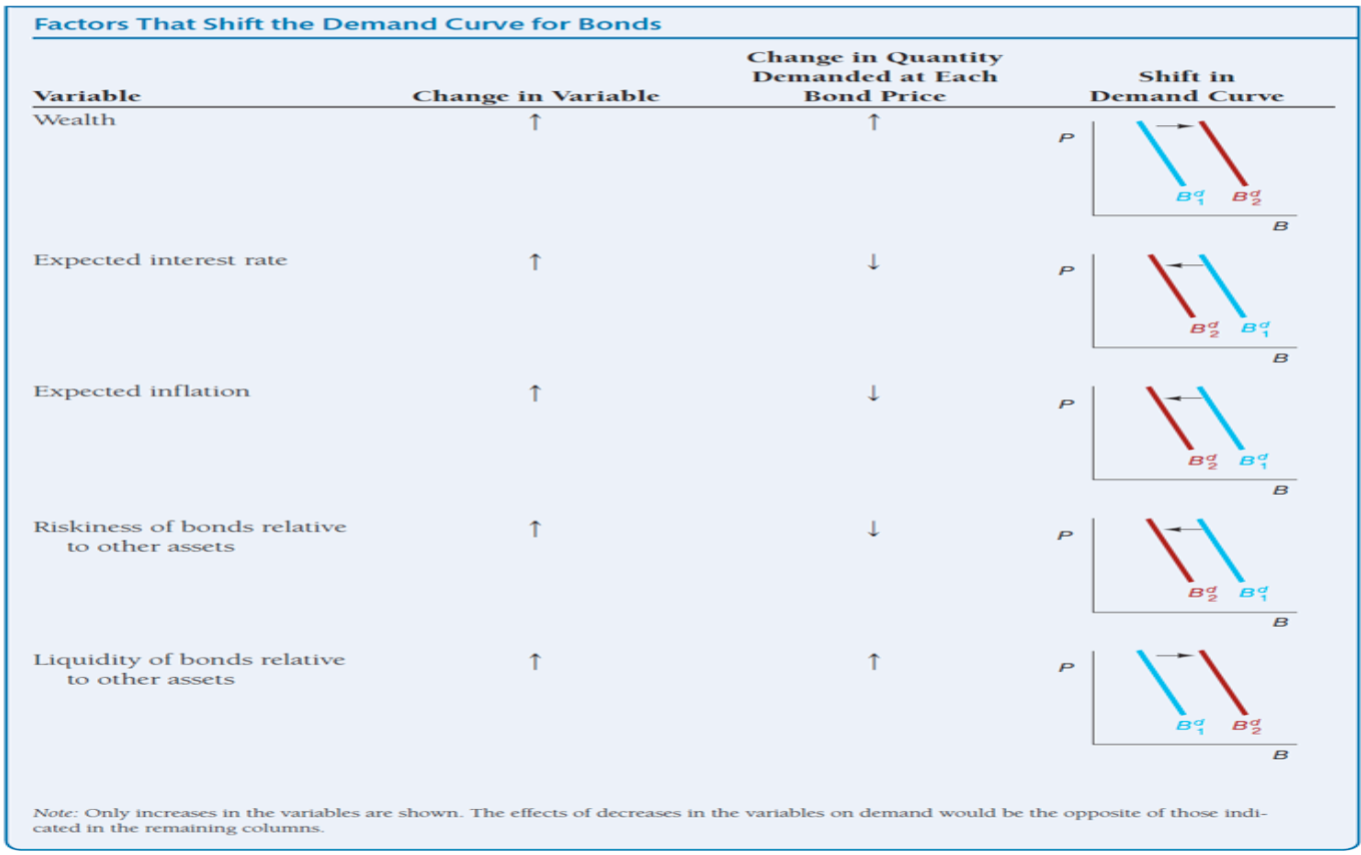
Shifts for the Demand of Bonds (Slide 15)
Interpretation:
Wealth ↑ → More funds available → Bond demand shifts right.
Expected interest rates ↑ → Future bonds become more attractive → Current bond demand shifts left.
Expected inflation ↑ → Bonds’ fixed future payments lose value → Demand shifts left.
Riskiness of bonds ↑ → Bonds become less attractive → Demand shifts left.
Liquidity of bonds ↑ → Bonds become easier to sell → Demand shifts right.
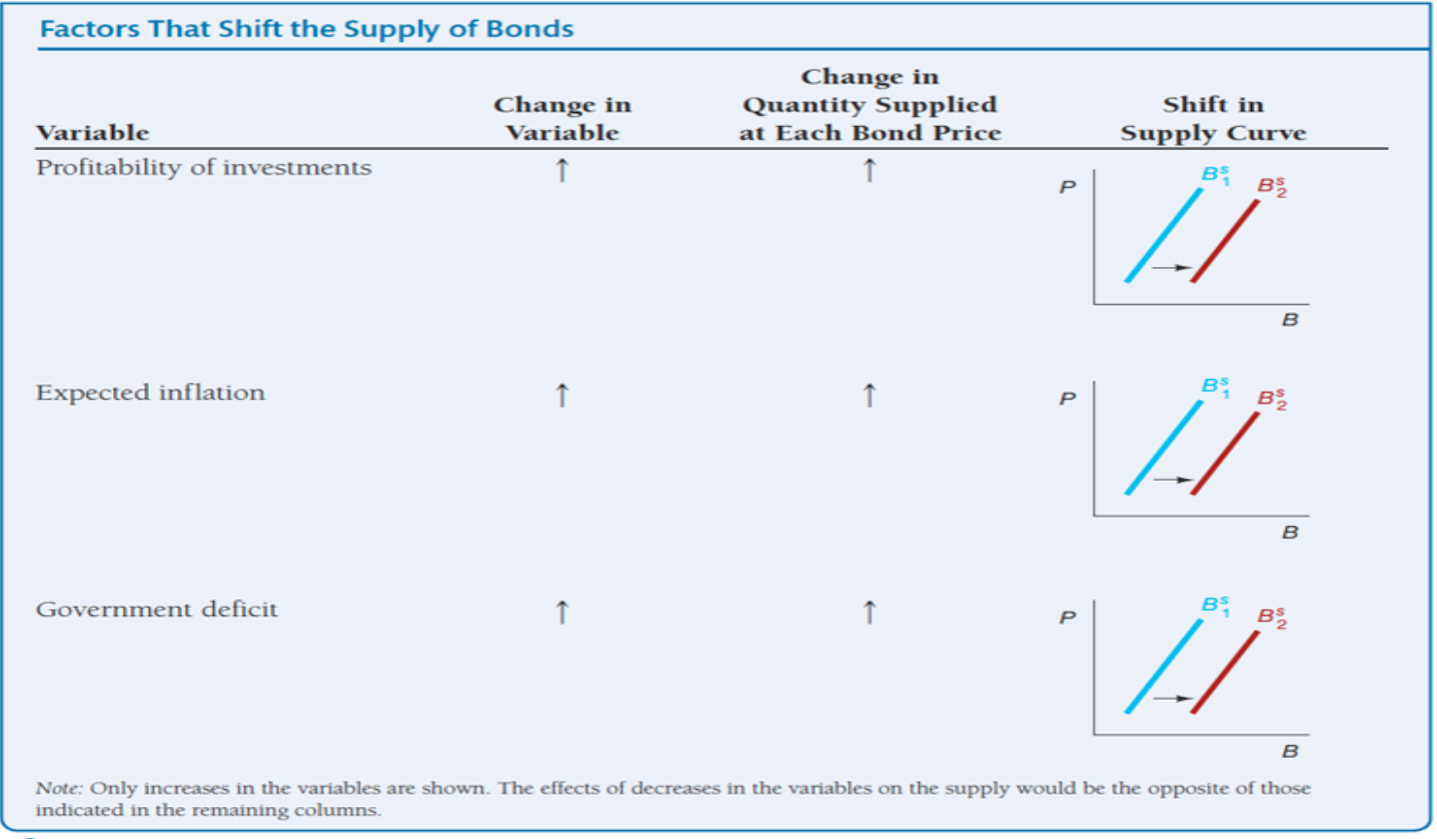
Shifts in the Supply for Bonds
Interpretation:
Profitability of investments ↑ → More borrowing to fund projects → Bond supply shifts right.
Expected inflation ↑ → Real cost of repaying loans falls → Incentive to borrow increases → Bond supply shifts right.
Government deficit ↑ → More government borrowing to cover the deficit → Bond supply shifts right.
YTM Recap
YTM is the rate of return that makes PV = Price
It’s just the discount rate that equalizes the bond price and the future payments
All YTM formulas come from the present value formula- nothing new to memorize
Why YTM Changes when Price Changes
Bond Price ↑ → YTM ↓
Bond Price ↓ → YTM ↑
Why? Because the future cash flows are fixed.
Example: If FV = $1,000 and you pay:
$900 → you earn more than the bond’s coupon → YTM ↑
$1,100 → you earn less → YTM ↓
Default
A situation in which the party issuing a debt instrument is unable to make interest payments or pay off the amount owed when the interest matures
default-free bonds
Bonds with no default risk, such as U.S. government bonds
Risk premium
The spread between the interest rate on bonds with default risk and the interest rate on default-free bonds
The risk premium indicates how much additional interest people must earn to be willing to hold the risky bond.
A bond with default risk will always have a positive risk premium, and an increase in its default risk will raise the risk premium.
Risk Premium Formula
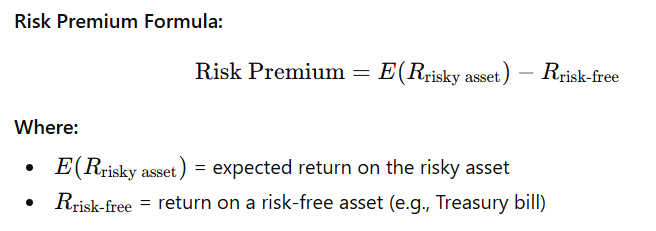
There are two determinants of the risk premium:
Default Risk
Higher default risk → higher risk premium
Liquidity
The less liquid a bond is, the higher the risk premium
Ex:
Bond A (Easily Traded)
Bond B (Hard to sell quickly)
→ Investors demand a premium for holding B
Expectations Theory
Core Idea: The interest rate on a long-term bond will equal an average of the expected future short-term interest rates.
“Long-term interest rates reflect the market’s expectations of future short-term interest rates”
What this theory assumes:
Bonds of different maturities are perfect substitutes (Investors don’t care about maturity- all that matters is expected return).
No maturity preference — only expected return matters
Why does Expectations theory matter?
It explains the shape of the yield curve (normal, flat, inverted).
If future short-term rates are expected to rise → yield curve slopes upward
If future short-term rates are expected to fall → yield curve slopes downward
If short-term rates are expected to stay constant → yield curve is flat
Segmented Markets Theory Formal Definition
Formal Definition: A theory of term-structure that sees the markets for different maturity bonds as completely separated and segmented, so that the interest rate on bonds of a given maturity is determined solely by supply of and demand for bonds of that maturity.
“Interest rates for bonds of different maturities are determined independently; bonds of different maturities are not substitutes.”
Segmented Markets Theory Core Idea
Core Idea:
Bonds of different maturities are not substitutes
Each maturity is its own isolated market
Why?
Investors have strong maturity preferences- usually:
Banks prefer short-term
Pension funds prefer long-term
Insurance Companies prefer long-term
Money market funds prefer very short-term
Segmented Markets Theory on Interest Rates and Yield Curve
What this theory says causes different interest rates:
Interest rates for each maturity depend on supply and demand in that specific segment, NOT on expectations of future rates.
What it implies about the yield curve:
Typically upward sloping, because investors prefer short-term bonds, so long-term bonds must pay higher rates to attract buyers
Preferred Habitat Theory Formal Definition
Formal Definition: A theory that holds that the interest rates on a long-term bond is equal to an average of the short-term interest rates expected to occur over the life of the long-term bond, plus a positive term premium.
This is basically a mix between Expectations Theory and Segmented Theory
“Investors prefer bonds of specific maturities (habitats) but will hold others if compensated with a term premium.”
Preferred Habitat Theory Core Idea
The Core Idea:
Investors prefer certain maturities (habitats) but they are willing to move to other maturities if they are paid a risk premium.
Long-term bonds typically must offers:
Higher yields
A term premium
Because investors prefer short-term bonds
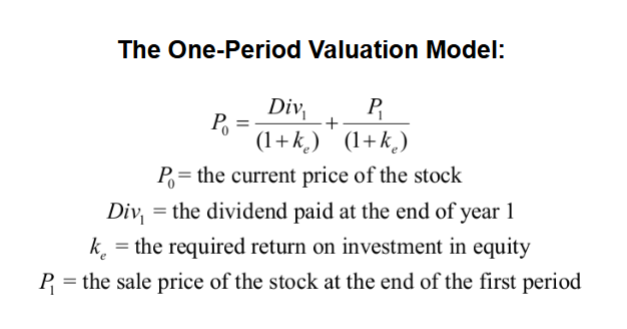
The One-Period Valuation Model
Idea: Price today = discounted value of what you get next period: the dividend you receive plus the price you can sell for next period.
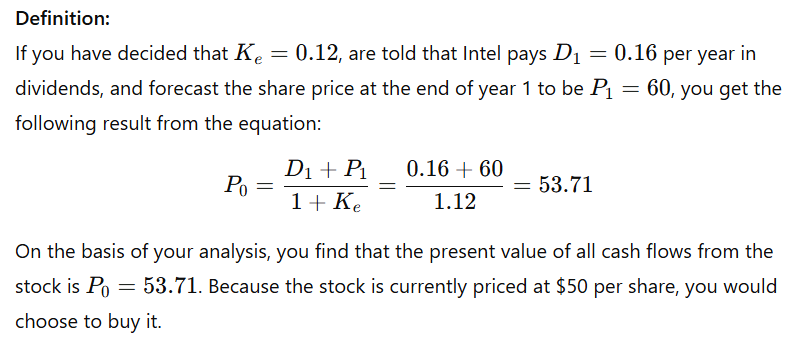
One-Period Valuation Model — Example
Gordon Growth Model
Idea: The firm pays dividends forever and those dividends grow at a constant rate g. Value = present value of infinite growing stream of dividends.
D1- Dividend next year (NOT this year, that’s D0)
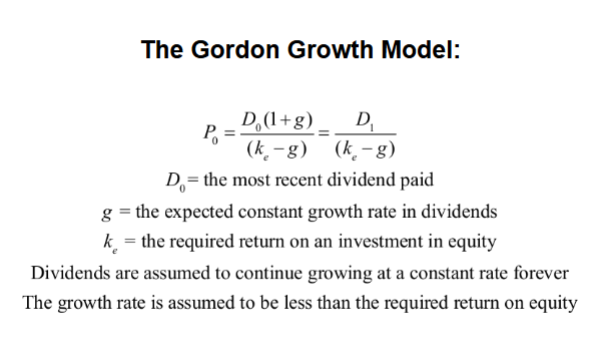
The Gordon Growth Model Assumes:
Dividends grow at a constant rate forever
The growth rate is assumed to be less than the required return on equity, Ke
If g is bigger than Ke, the model breaks — so the model only works when: r > g
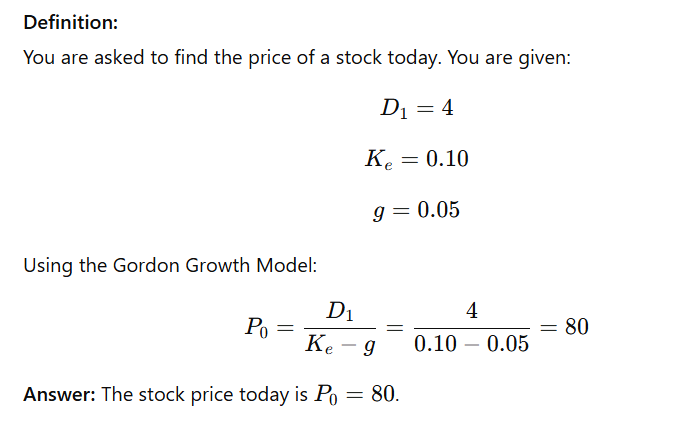
Gordon Growth Model — Example
Key Points about Financial Structure Throughout the World- Chapter 8, Slide 7
Stocks are not the main source of funding — most businesses in these economies rely on debt, not issuing equity.
Direct finance is rare — few firms issue marketable debt or equity; indirect finance dominates
Banks and financial intermediaries are crucial — they channel savings into business investment
Financial regulation is heavy — even in developing countries, the financial sector is highly controlled
Access is unequal — only large, well-established corporations can easily access securities markets
Collateral is very important — lenders require collateral to reduce risk
Debt contracts are complex — restrictive covenants are included to limit risky behavior by borrowers
Key Points about Financial Structure Throughout the World- Chapter 8, Slide 7
Why it matters:
In countries with weaker institutions, poor property rights, or weak legal enforcement:
Collateralized debt is more common because lenders need security
Intellectual property and enforcement contracts are less reliable, so direct investment is riskier
Indirect finance (banks) is more reliable than trying to sell stocks or bonds in an underdeveloped market.
Collateralized (Secured) Debt
A loan backed by collateral. If the borrower defaults, the lender has a legal claim to the asset used as collateral.
Lower risk for lender
Lower interest rate
Examples: mortgages, auto loans
Uncollateralized (Unsecured) Debt
A loan not backed by collateral. If the borrower defaults, the lender has no specific asset claim.
Higher risk for lender
Higher interest rate
Examples: credit cards, student loans
Asymmetric Information
A situation in which one party in a financial transaction has more or better information than the other.
Effect: Can lead to inefficient outcomes, such as higher-risk taking or the wrong allocation of resources.
Example: Borrowers know more about their ability to repay a loan than the lender does.
Adverse Selection
Occurs before a financial transaction, when the party with more information (usually the borrower) is likely to engage in riskier behavior than the lender expects.
Example: High-risk borrowers are more likely to seek loans, but the lender cannot tell the difference upfront.
Tools to mitigate adverse selection:
Private production of information — credit checks, background reports, due diligence
Government regulation — disclosure requirements, reporting standards
Financial intermediation — banks can screen borrowers better than individual investors
Collateral and net worth- borrowers with more to lose (net worth or collateral) are less likely to default.
Moral hazard
Occurs after a financial transaction when the borrower might engage in riskier behavior because the lender bears part of the cost.
Example: A company borrows money and then invests in high-risk projects because the lenders loss is limited to the loan.
Mitigation: Monitoring, restrictive covenants, collateral, financial intermediated, regulatory oversight.
Principal-Agent Problem
A type of moral hazard that occurs in equity contracts.
Key Idea: The agent (e.g., company management) may act in their own interest rather than the principal’s (e.g., shareholders) interest.
Mitigation: Monitoring, incentives tied to performance, regulation, financial intermediation.
Total Reserves
The deposits that a bank has at the Federal Reserve Bank plus its cash on hand (cash in the vault)
Formula:
Total Reserves = Deposits at Federal Reserve + Cash on Hand
Required Reserves
The minimum amount of reserves a bank must hold.
Formula:
Required Reserves = Required Reserve Ratio X Checkable Deposits
Required Reserve Ratio
The percentage of its total deposits that a bank must keep as reserves at the Federal Reserve
Required Reserve Ratio = Required Reserves / Checkable Deposits
Excess Reserves
Reserves above what is legally required. Banks lend only from excess reserves.
Formula:
Excess Reserves = Total Reserves - Required Reserves
Gap Analysis
Purpose: Measures how bank profits change when interest rates change
Formula:
GAP = RSA - RSL
Δ Profit = (Rate Sensitive Assets - Rate Sensitive Liabilities) X Δ Interest Rates
Where:
RSA: Assets whose interest can change within the time period
RSL: Liabilities whose interest can change within the time period
Δ Interest Rates: Change in interest rates (expressed as a decimal)
Gap analysis interpretation
If GAP > 0 (RSA > RSL): Bank profits increase when interest rates rise
If GAP < 0 (RSA < RSL): Bank profits decrease when interest rates rise
Gap Analysis Example (Slide 38):
Suppose that you are the manager of a bank that has $15 million of fixed-rate assets, $30 million of rate-sensitive assets, $25 million of fixed-rate liabilities, and $20 million of rate-sensitive liabilities. Conduct a gap analysis...
For the bank and show what will happen to bank profits if interest rates rise by 5 percentage points.
Step 1: Calculate GAP
GAP = RSA - RSL
30 - 20 = + 10 million
Step 2: Apply Formula
Δ Profit = 10 m X 0.05 = .5 million
Final Answer:
GAP = +$10 million
Because GAP > 0, the bank benefits when interest rates rise
Profits increase by 500,000 when interest rates rise by 5%.
Duration Analysis
Goal: To measure how a bank’s net worth changes when interest rates change
Duration = how sensitive the value of an asset or liability is to interest rate changes
A longer duration = more interest rate risk
A shorter duration = less interest rate risk
Duration Analysis Formula
Formula:
%Δ in market value of the securities = (percentage point Δ in interest rates) X (duration in years)
Simplified Formula:
%Δ MV = Δ i X Duration
Where:
%Δ MV = Percentage change in market value of the asset or portfolio
Δ i = Change in interest rate (in percentage points)
Duration = duration of the asset or portfolio (in years)
Key note:
When interest rates rise, bond prices fall
When interest rates fall, bond prices rise
Duration Analysis
Example 1: Interest rates rise (negative effect on bond price)
Example 1: Interest rates rise (negative effect on bond price)
Bond value: $1,000
Duration: 5 years
Interest rate change: +2% (0.02)
%Δ Price = 5 X 0.02 = 0.10
Since rates rise, it is -10%
New bond price = $1,000 X (1 - 0.10) = $900
When interest rates rise, bond prices fall
Duration Analysis
Example 2: Interest rates fall (positive effect on bond price)
Example 2: Interest rates fall (positive effect on bond price)
Bond value: $1,000
Duration: 5 years
Interest rate change: -2% (-0.02)
%Δ Price = 5 X (-0.02) = -0.10
Since rates fall, it is 10%
New bond price = $1,000 X (1 + 0.10) = $1,100
When interest rates fall, bond prices rise
Federal Deposit Insurance Corporation (FDIC)
Government agency that insures bank deposits.
Why it was created:
To prevent bank panics and contagion effects — where the failure of one bank causes people to rush and withdraw from other banks.
Ensures stability in the banking system
Currently insures deposits up to $250,000 per depositor per bank.
Payoff Method
FDIC closes the bank and pays depositors directly up to the insurance limit.
Quick, but can be costly for depositors with uninsured deposits.
Purchase and Assumption Method
Another bank buys the bank’s assets and assumes its deposits.
Usually more costly for the FDIC but keeps the bank running and avoids panic.
Chartering
The process of approving a proposal to open a new bank.
Types:
State-chartered banks: regulated primarily by the state
Federal-chartered banks: regulated by Federal authorities (OCC)
Significance:
Prevents adverse selection — only financially sound institutions are allowed to operate
Banks are regularly examined to prevent moral hazard (taking on too much risk because they know they have government support).
Examination Process for Banks - CAMELS
Capital Adequacy — enough equity to cover risks
Asset Quality — how risky are loans/investments
Management — competent leadership
Earnings — profitability
Liquidity — ability to meet withdrawals
Sensitivity to market risk — e.g., interest rate change
Periodic “call reports” are submitted to monitor these factors.
Restricted Covenants
Clauses in bank contracts that restrict certain actions by the bank or borrowers to reduce risk.
Example: limiting the types of loans a bank can make or the size of investments.
Purpose: Reduce moral hazard by making sure the bank doesn’t take excessive risks.
Glass-Steagall Act
1933 law that separated commercial banking (taking deposits, making loans) from investment banking (underwriting, trading securities).
Repealed in 1999, which allowed universal banking. Restrictions on branching and competition were also lifted in 1994.
Purpose of act:
Reduce moral hazard and risk-taking by commercial banks.
Disadvantages of act:
Reduced competition can mean higher consumer charges and less efficiency
Financial Innovation
Definition:
Creation of new financial products or practices that bypass regulations or improve efficiency
Significance:
Can improve access to funds, increase liquidity, or spread risk.
But it can also increase systemic risk, as seen in the 2007-2008 financial crisis.
Examples: mortgage-backed securities, derivatives, credit default swaps.
End of Unit 1 and 2
Good Job
Permanent Life Insurance
Key Features:
Covers you for your entire life (as long as premiums are paid).
Has a savings/investment component called cash value.
Premiums are higher because you’re building savings + insurance
Types:
Whole life — fixed premiums, guaranteed cash value
Universal life — flexible premiums
Variable life — cash value invested in risky assets (stocks)
Why someone buys it: long-term protection + investment savings
Term Life Insurance
Key Features:
Covers you for a specified period only (ex: 10, 20, 30 years)
No savings or cash value
Much cheaper than permanent life insurance
Pays out only if you die during the term
Why someone buys it: inexpensive, straightforward protection
Property and Casualty Insurance
Covers cars, homes, businesses, liabilities, etc.
Must hold more liquid assets than life insurers.
Why? — People file claims frequently and unpredictably (car accidents, fires, etc.).
Reinsurance
Insurance for insurance companies
They buy this to protect themselves from large unexpected losses
Adverse Selection Problem in Insurance
People with the highest risk are the most likely to buy insurance
Examples:
Unhealthy people try harder to buy health insurance
Bad drivers want more auto coverage
Older or sick people want life insurance more
Insurance companies fight this by:
Medical exams
Driving record checks
Charging risk-based premiums
Deductibles
Exclusions (ex: no coverage for pre-existing damages)
Slide 14 Application:
Paul’s car slid off the road, causing $3,000 in damage to his car. He was also treated for minor injuries, costing $1,400. His car insurance has a $300 deductible, after which the full loss is paid. His health insurance has a $100 deductible and covers 75% of medical cost. What were Paul’s out of pocket costs for the accident?
Step 1: Deductible paid by Paul
$1,400 - $100 = $1,300 left
Step 2: Paul’s portion of the remaining 25%:
25% of $1,300 = $325
Out of pocket medical cost = $100 + $325 = $425
Total Out-of-Pocket
Car: $300
Medical: $425
Total Paul Pays: $725
Monoline Insurance
Insurance company that only sells one type of i