Population Ecology Final Exam
0.0(0)
Card Sorting
1/114
There's no tags or description
Looks like no tags are added yet.
Last updated 3:06 AM on 5/4/23
Name | Mastery | Learn | Test | Matching | Spaced | Call with Kai |
|---|
No analytics yet
Send a link to your students to track their progress
115 Terms
1
New cards
Population
a group of organisms of the same species coexisting at the same time and place
2
New cards
Population Ecology
the scientific study of the dynamics, regulation, persistence and evolution of biological populations
3
New cards
Why study population eco?
1. populations are the basic unit of ecological organization
2. evolution occurs at the population level
3. dynamics of infectious diseases can be thought of as population dynamics
4
New cards
Why is population ecology important in wildlife management/conservation biology?
populations are the units of conservation and management
5
New cards
What are the measurable characteristics of populations (or population parameters)?
1. Abundance
2. rate of birth
3. rate of death
4. emigration/immigration
5. rate of increase
6. sex ratio
7. age or stage structure
1. spatial distribution
6
New cards
Steps of the scientific method.
1. collect data
2. observe the pattern
3. develop a hypothesis
4. predict
5. collect more data
6. evaluate
7
New cards
scientific vs non scientific hypothesis
scientific: a theory intended for experimental test
non scientific: cannot be proven correct or incorrect by an experiment
non scientific: cannot be proven correct or incorrect by an experiment
8
New cards
statistical vs biological hypothesis
Statistical: conjectures about the predicted for the process (Ho vs Ha)
biological: posses a tentative explanation about a process observed in the natural world
biological: posses a tentative explanation about a process observed in the natural world
9
New cards
mensurative (or comparative) vs. experimental approach
mensurative: observing/measuring a system at different locations/times in a systematic way NO MANIPULATION
experimental: study designs where you randomly apply a treatment. you are manipulating a situation
experimental: study designs where you randomly apply a treatment. you are manipulating a situation
10
New cards
control vs treatment
control: not manipulated
treatment: manipulated experimentally
treatment: manipulated experimentally
11
New cards
randomization vs replication
randomization: applying treatment randomly
replication: repeating trials/experiment to ensure its validity
replication: repeating trials/experiment to ensure its validity
12
New cards
Induction
reasoning from specific to general (first three steps)
13
New cards
deduction
reasoning from general to specific (last four steps of sci method)
14
New cards
hypothetico-deduction
induction + deduction = hypothetico-deduction = scientific method
15
New cards
what are population growth models?
simplified, mathematical or computer representations of population growth processes
attempt to mimic the dynamics or biological populations
attempt to mimic the dynamics or biological populations
16
New cards
why are models useful in ecology?
1. models are learning tools
2. suggest hypotheses and experiments
3. help identify key components of the system
4. models make predictions
5. data analysis and synthesis
6. models can be used for management purposes
7. disease control or containment strategies
8. frequently, we have no alternative
17
New cards
Define population growth variables
B: birth
D: death
E: emigration
I: immigration
b: birth rate
d: death rate
D: death
E: emigration
I: immigration
b: birth rate
d: death rate
18
New cards
Lambda calculation
experimental: Nt = lambda^t(N0)
logistical: Nt+1 = Nt + Nt(rd) \[1-Nt/K\]
logistical: Nt+1 = Nt + Nt(rd) \[1-Nt/K\]
19
New cards
r calculation
exponential: dN/dt = rN
logistical: dN/dt = Nrmax(1-N/K)
logistical: dN/dt = Nrmax(1-N/K)
20
New cards
Exponential growth assumptions
1. unlimited homogeneous environment
2. no immigration or emigration
3. constant birth and death rates
4. no age/stage structure
21
New cards
logistical growth assumptions
1. no immigration or emigration
2. no age/stage structure
3. no stochasticity
4. linear decline in r as N increases (linear density dependence)
5. carrying capacity, K, is constant
22
New cards
Demographic stochasticity
unpredictable variability in population growth due to random differences among individuals in survival and reproduction
small populations are affected more severely
small populations are affected more severely
23
New cards
environmental stochasticity
unpredictable variation in demographic characteristics
due to stochastic variation in the extrinsic environmental factors
due to stochastic variation in the extrinsic environmental factors
24
New cards
steps to incorporate stochasticity
1. assume: r \~ normal
2. for each time t, sample r from the distribution and parameters from step 1
3. project population size from time t to
4. repeat this process from t = 1 to T
5. repeat the process hundreds of times as needed
6. plot the results
7. calculate the mean and variance of the pop size
8. calculate the probability of extinction
25
New cards
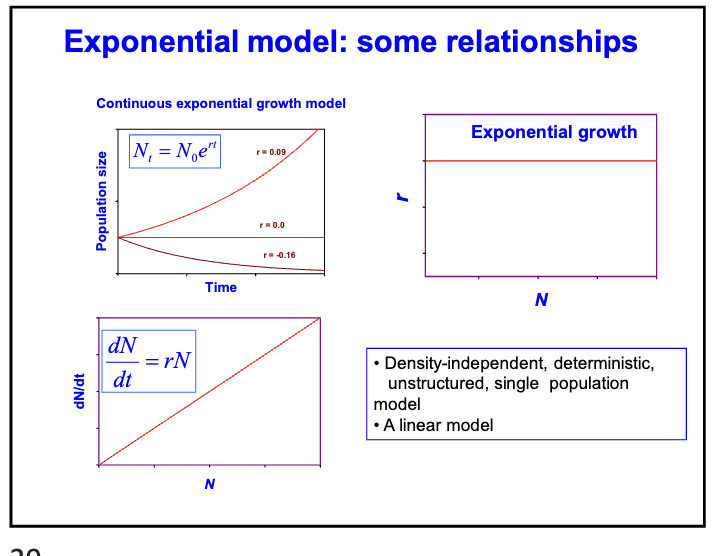
Relationship between
t and N
N and r
N and dN/dt
t and N
N and r
N and dN/dt
26
New cards
doubling, tripling, quadrupling time
t double = ln(2)/r
t triple = ln (3)/r
t quadruple = ln(4)/r
t triple = ln (3)/r
t quadruple = ln(4)/r
27
New cards
The exponential model makes several unrealistic assumptions. Given this, why do we need to learn about this rather unrealistic model?
This model is the stepping stone for other, more realistic, growth models
28
New cards
density dependence
dependence of per capita population growth rate on present or past population density
* delayed DD: dependence of r on past density
* direct DD: dependence of r on current density
important for models because it makes them more realistic
* delayed DD: dependence of r on past density
* direct DD: dependence of r on current density
important for models because it makes them more realistic
29
New cards
carrying capacity
the maximum number of individuals an environment can support
30
New cards
allee effect
positive relationship between population density and per capita population growth rate
(DD is normally a negative relationship)
Examples: mate-finding allee effect, predation dilution effect
(DD is normally a negative relationship)
Examples: mate-finding allee effect, predation dilution effect
31
New cards
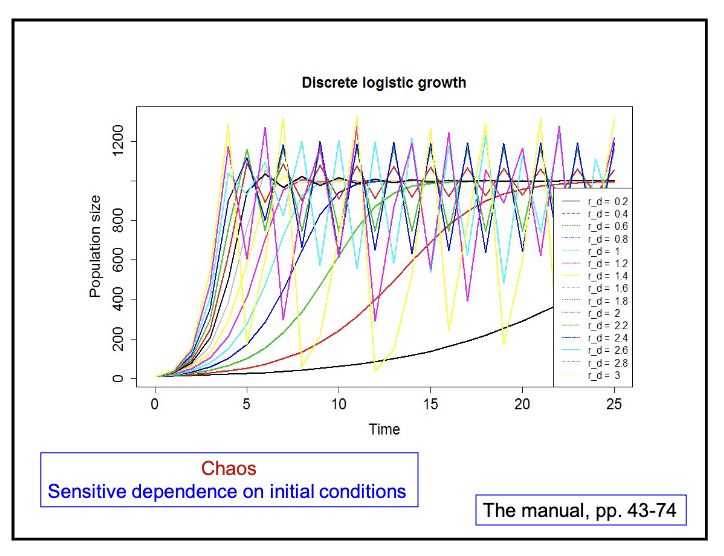
discrete-time logistic model
32
New cards
What is age distribution (or age structure) and why is it important in population ecology?
Age: important variable as it can influence survival and reproduction
1. birth and death rates differ among age classes
2. age structure can be used for structured demographic projections
3. age structure provides useful information regarding the past history, present or future population growth
1. birth and death rates differ among age classes
2. age structure can be used for structured demographic projections
3. age structure provides useful information regarding the past history, present or future population growth
33
New cards
standing age distribution
observed proportion
34
New cards
stable age distribution
theoretical age distribution when b and d are constant
the proportion of individuals in different age class will remain constant over time
the proportion of individuals in different age class will remain constant over time
35
New cards
stationary age distirubtion
SAD nad r = 0
number and proportion are constant over time
number and proportion are constant over time
36
New cards
What are (ecological) life tables, and why are they useful in ecology and wildlife management? What are their assumptions?
age specific summary of survival and reproduction
they help predict future population growth rates
Assumptions:
1. no I or E
2. Unlimited, homogeneous environment
3. constant age-specific survival and fecundity rates
4. stable age distribution
5. animals of a given age are identical with respect to birth and death rates
they help predict future population growth rates
Assumptions:
1. no I or E
2. Unlimited, homogeneous environment
3. constant age-specific survival and fecundity rates
4. stable age distribution
5. animals of a given age are identical with respect to birth and death rates
37
New cards
Life table variables and their calculations
nx: # of animals of age x that are alive (cohort size)
lx: age specific survivorship (nx/n0)
dx: # of animals that die between age class x and x+1 (nx- nx+1)
qx: age specific mortality (dx/nx)
Px: age specific survival rate (1-qx)
lx: age specific survivorship (nx/n0)
dx: # of animals that die between age class x and x+1 (nx- nx+1)
qx: age specific mortality (dx/nx)
Px: age specific survival rate (1-qx)
38
New cards
Cohort and static life tables
Cohort life table: based on real cohorts
Static life table: based on the snap-shot of the population (not useful)
Static life table: based on the snap-shot of the population (not useful)
39
New cards
Methods of compiling life tables
1. follow real cohorts
2. mark-recapture studies
3. age at death recorded for a population with SAD, and known r
4. Age distribution is recorded at birth pulse for a population with SAD and known r
40
New cards
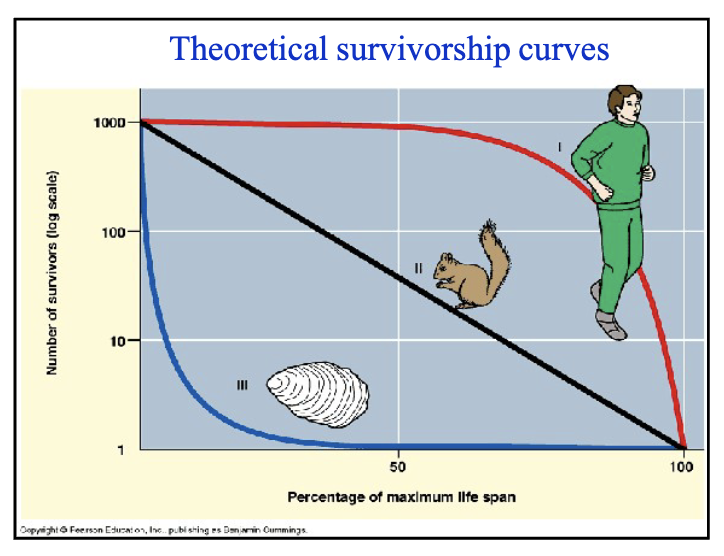
Survivorship curves
41
New cards
net reproductive rate (*R0*), generation time (*G*), and approximate *r* using age-specific survivorship and fecundity data (i.e., *lx* and *mx*)
R0: sum(lx\*mx)
G: sum(lx\**mx**x)/R0
r = lnR0/G
G: sum(lx\**mx**x)/R0
r = lnR0/G
42
New cards
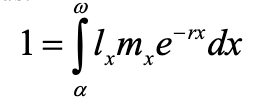
Know what the Lotka-Euler equation is, what it means, and how one can use it to calculate the exact value of *r*. Why is Lotka-Euler equation important in population ecology, wildlife management, and evolutionary biology?
Foundation of stable age theory
life history evolution and evolutionary studies rely on this theory
r is possibly the single most important quantity in ecology, evolutionary biology, and wildlife management
life history evolution and evolutionary studies rely on this theory
r is possibly the single most important quantity in ecology, evolutionary biology, and wildlife management
43
New cards
What are the advantages of using matrix models over life table analyses?
more organized
44
New cards
Assumptions of age- (and stage-) structured population models.
1. no I or E
2. unlimited, homogeneous environment
3. constant Pi and Fi
4. stable age distribution
5. non-overlapping generations
6. individuals within an age class are identical with respect to survival and reproduction
45
New cards
age vs age class
age: specific number
age class: range of ages in one group
age class: range of ages in one group
46
New cards
pre-breeding vs post-breeding census
pre-breeding: data collected just before the birth-pulse
post-breeding: data collected just after the birth-pulse
post-breeding: data collected just after the birth-pulse
47
New cards
What are the parameters of age-structured (Leslie) matrix models? How do they differ from the life-table parameters using post-breeding census method?
Parameters:
population projection matrix for AGE-STRUCTURED populations
Parameters post-breeding:
1. Pi = li/li-1
2. Fi = mi\*Pi
population projection matrix for AGE-STRUCTURED populations
Parameters post-breeding:
1. Pi = li/li-1
2. Fi = mi\*Pi
48
New cards
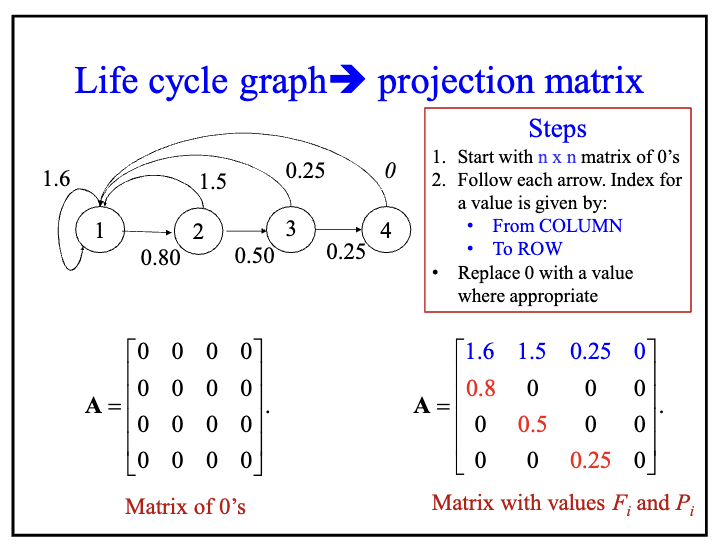
Know how to draw life cycle graphs for age- and stage-structured populations, and derive population projection matrices from the life cycle graphs! Also, know how to draw a life cycle graph from population projection matrices.
49
New cards
Stable age/stage distribution, reproductive values and λ; how are these calculated from the population projection matrices.
Lambda: largest eigenvalue of A
SAD: right eigenvector
Reproductive values: left eigenvector
SAD: right eigenvector
Reproductive values: left eigenvector
50
New cards
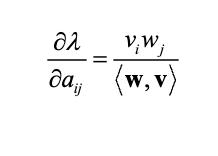
What are sensitivities and how are they calculated? Know the formula and the symbols.
Sensitivity: how would lambda change in response to small, absolute changes in a vital rate?
\
\
51
New cards
What do they tell you regarding the population dynamics? What do they quantify?
1. predict response to lambda to perturbations in vital rates
2. conservation and management
3. decompose observed changes in lambda
4. research
5. evolutionary studies
52
New cards
How do you interpret sensitivities and are they used in ecological and evolutionary studies?
The new matrix provides the sensitivity values which are a prediction of changes to whatever value used to be in that spot in the matrix
53
New cards
What are the problems associated with sensitivities?
1. deterministic, asymptotic analysis
2. deals with hypothetical situations
3. some demographic parameters may be less variable, resistant to change or may not change at all
4. management options can be limited to impact the most influential vital rates
5. interpret results with caution
54
New cards
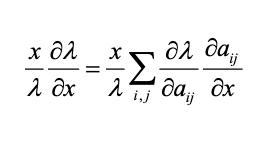
What are elasticities, what do they tell you? How are they calculated? How do they differ from sensitivities?
how would lambda change in response to small, proportional changes in a vital rate
elasticities are the lower-level sensitivities multiplied by x/lambda
elasticities are the lower-level sensitivities multiplied by x/lambda
55
New cards
Interpretation of sensitivities and elasticities: How can they be used in the management of an endangered species or a pest?
We can predict how to growth rate would respond to various conservation methods
56
New cards
Stage-structured matrix models: What are they? How do they differ from age-structured models?
Instead of being separated by age, they are separated by parts of their life
Differences: use stage structured when…
1. organisms with complex life-cycles
2. when something other than chronological age affects birth and death rates more strongly
3. when age is difficult to estimate
Differences: use stage structured when…
1. organisms with complex life-cycles
2. when something other than chronological age affects birth and death rates more strongly
3. when age is difficult to estimate
57
New cards
Parameters of stage-structured matrix models
1. regardless of the stage structure, underlying vital rates are essentially the same
2. from these, one can calculate matrix entries
3. parameter estimation:
1. similar to age-structured models
2. stage-specific survival
58
New cards
Given an age- or stage-structured projection matrix **A** and population vector at time *t* (**n**t), know how to project population size with age/stage structure to time *t* + 1. Know the population projection equation.
n(t+1)= An(t)
59
New cards
Interpretation of results of stage-structured matrix models
1. other analyses will also proceed as in the age-structured models
1. population growth rate
2. SAD
3. stage-specific reproductive values
2. sensitivity analysis
60
New cards
Why are matrix population models so popular? How can they be used in wildlife conservation and management?
They help us determine what age or stage class needs the most help and if they need help with their reproductive or survivorship rates
61
New cards
What are metapopulations? Why is the metapopulation concept relevant in wildlife conservation/management?
Metapopulation: a set of local populations that are connected by migration
Tells us about local extinction and recolonization of patches
Tells us about local extinction and recolonization of patches
62
New cards
How do simple models of metapopulation dynamics differ from standard models of single population dynamics?
metapopulation models have several patches separated by a given distance
63
New cards
Why are metapopulation extinction probabilities generally lower than single population extinction probabilities (assuming independence of local population dynamics)? Be able to show this using example calculations.
Because it can be recolonized by members of another patch
a single population will go extinct if lambda < 1
p(regional) = p(local)^x
a single population will go extinct if lambda < 1
p(regional) = p(local)^x
64
New cards
Why are isolated populations more likely to go extinct than a network of connected populations?
they will not have recolonization
65
New cards
Levins model: What are the parameters/variables, and what is being modeled?
Parameters
1. considers a population of large number of homogeneous local populations
2. population dynamics within a patch are simplified to occupied or unoccupied
3. focuses on the balance between local extinction and recolonization
4. models the rate of change in metapopulation size, measured by the fraction of patches occupied
66
New cards
Levins model: Model assumptions
1. large number of homogeneous patches
2. constant pc and pe over time
3. asynchronous local population dynamics
4. size, quality, and spatial configuration of patches are not important
5. local population dynamics are not important
6. empty patches can be colonized by propagules from outside of the metapop system
7. an increase in F reduces metapopulation extinction rate through rescue effecr
67
New cards
Levins model: Equilibrium solution
1-(pe/pc)
68
New cards
Propagule rain and how it can influence metapopulation dynamics
* propagules: individuals that colonize an empty patch
* colonization of empty patches by propagules from elsewhere
* assume propagules are raining from outside the system
* empty patches can be colonized by propagules from elsewhere
* colonization of empty patches by propagules from elsewhere
* assume propagules are raining from outside the system
* empty patches can be colonized by propagules from elsewhere
69
New cards
The rescue effect and how it can influence metapopulation dynamics
rescue effect: the reduction in metapopulation extinction rate that occurs when more sites are occupied
1. dispersers from occupied sites will rescue smaller sites which may otherwise go extinct
2. thus, an increase in F will reduce metapop extinction risk, and increase equilibrium F
1. dispersers from occupied sites will rescue smaller sites which may otherwise go extinct
2. thus, an increase in F will reduce metapop extinction risk, and increase equilibrium F
70
New cards
How patch size, patch quality, spatial structure, and connectivity/isolation can influence metapopulation colonization, extinction, and occupancy rates (i.e., the fraction of habitat patches occupied)
patch size decreases extinction
patch quality decreases extinction
connectivity increases colonization
patch quality decreases extinction
connectivity increases colonization
71
New cards
Incidence Function Model (IFM)
1. allows patch size and quality to vary
2. does not assume infinite number of patches
3. explicitly considers size and spatial structure of patches
4. permits parameter estimation using real data
72
New cards
Source-sink dynamics including definitions of sources, sinks and pseudo-sinks
based on the balance between B and D and E and I
when B is density-dependent, a source population may look like a sink at high density → Pseudosink
when B is density-dependent, a source population may look like a sink at high density → Pseudosink
73
New cards
Various types of “metapopulation structures”
Classic, Mainland- Island, Patchy Population, mixture, Source-Sink, and Relict metapop
74
New cards
What is PVA? Why use it?
an analysis that uses data in an analytical or simulation model to measure the risk of extinction or a closely related measure of population viability, such as the proportion of simulated populations that end above some size after some specified period of time
why use it
* ranking management options
* estimating harvest quote
* reserve design
* analyzing and synthesizing field data
why use it
* ranking management options
* estimating harvest quote
* reserve design
* analyzing and synthesizing field data
75
New cards
Risk
probability of an adverse event
76
New cards
Risk assessment
the process of obtaining quantitative measures of risk levels
77
New cards
Absolute risk
risk faced by a population/species regardless of other populations/species
78
New cards
Relative risk
risk faced by a population/species relative to other populations/species
79
New cards
background risk
risk of extinction of a population under natural conditions
80
New cards
added risk
an increase in risk that results from unnatural forces
81
New cards
probability of extinction
probability that a population declines to 0
82
New cards
probability of quasi-extinction
probability that a population falls below some specified threshold
83
New cards
probability of persistence
1 - (prob of extinction)
84
New cards
time to extinction
an estimate of time for extinction to occur
85
New cards
monte carlo simulation
simulation of a probability model, or a random process
86
New cards
inbreeding/inbreeding depression
reduction in fitness due to inbreeding
87
New cards
outbreeding depression
loss of fitness due to outbreeding
88
New cards
genetic introgression
movement of genes from outside of a pop
89
New cards
genetic restoration or rescue
improvements in fitness of inbred pops from immigration of genetically divergent individuals
90
New cards
What are the main factors (deterministic, stochastic and management, etc.) to consider in PVA, and why?
1. Stochastic factors
1. environmental. catastrophes, demographic, genetic
2. deterministic
1. DD, allee effect
3. Genetic
1. inbreeding depression
4. management
91
New cards
Know the PVA components and steps
1. identification of objectives/questions
2. collation and analysis of data
3. selection of models
4. estimating model parameters
5. running the model
6. sensitivity analysis
7. evaluation of results and assumptions
92
New cards
criteria for evaluating PVAs
1. objectives/questions
2. model and model structure
3. data
4. analysis/implementation of the model
5. handling the unknown factors
6. presentation and interpretation of results
7. peer review
93
New cards
Why are some PVAs (or the PVA process itself) have been criticized?
1. single species focus
2. data needs
3. predictive accuracy issues
4. risk criteria
5. identification of the causes of decline
6. inappropriate use or abuse of PVA methodologies
94
New cards
Know various types of PVA models and their data requirements and limitations
1. SPOM
1. simplest data requirements
2. Count based
1. based on estimates of abundance over time
2. No DD, age- or stage- structured
3. structured
1. age or stage structured stochastic matrix models
4. Individual-based metapopulation models
1. amount of data required is often limiting factor
5. Integrated population models
1. utilize multiple data types (abundance, CMR)
95
New cards
Why is host-parasite interaction considered to be a (+, -) interaction?
Predation and Parasitism
96
New cards
Why do wildlife managers and conservation biologists need to worry about diseases? Why model disease dynamics?
1. wildlife are intermediate hosts or vectors for many human and livestock diseases
2. cause of decline or local extinction of many species
3. an important cause of amphibian population declines and biodiversity loss
97
New cards
Microparasites vs. macroparasites
Macroparasites: multi-cellular and long-lived
Microparasites: rapid reproduction, fast population increase within the host
Microparasites: rapid reproduction, fast population increase within the host
98
New cards
vertical vs horizontal transmission
Vertical: transmission from parents to offspring
horizontal: direct or indirect contact
horizontal: direct or indirect contact
99
New cards
Box model
Open: Susceptible, Infectious, Recovered
Closed: Susceptible (Infection) → Infectious (Recovery or death) → Recovered
Closed: Susceptible (Infection) → Infectious (Recovery or death) → Recovered
100
New cards
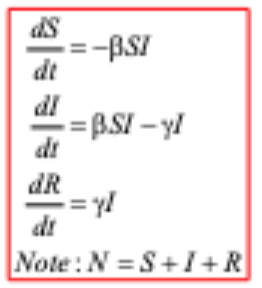
SIR differential equations