Math Vocab for Midterm Exam 2023 (copy)
1/58
There's no tags or description
Looks like no tags are added yet.
Name | Mastery | Learn | Test | Matching | Spaced |
|---|
No study sessions yet.
59 Terms
Standard form
ax +by = c
Slope
m= (y2-y1)/(x2-x1)
Y-intercept
where a line crosses the y axis
X-intercept
where a line crosses the x axis
Slope-intercept form
y=mx+b
Slope-point form
y=m(x-x0) + y0
Augmented Matrix
ex
0 -9 7 5
1 7 0 1
1 0 -3 8
rows
left - right
columns
up - down
dimension
form or shape of something
Reduced Row Echelon Form
ex - simplified matrix
1 0 0 4
0 1 0 2
0 0 1 6
Mean
aka average (add, divide)
Median
in the middle
Maximum
most/highest value
Minimun
least/lowest value
Range
the difference between the max and min of a data set
Standard Deviation
a quantity calculated to indicate the extent of deviation for a group as a whole
Q1
lower 25th percentile of data
Q3
upper 75th percentile of data
Histogram
Dot Plot
Box Plot
Line Plot
Uniform
all the same
Symmetric
same on both sides
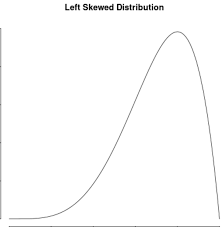
Left-skewed
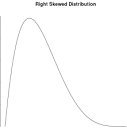
Right-skewed
Unimodal
has one mode
Bimodal
has two modes
Scatter Plot
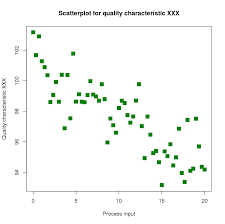
Form
idk
Direction
right or left?
Strength
where are there the most data points of a set
Correlation coefficient
a number between -1 and 1 that tells you the strength and direction of a relationship between variables
Line of Best Fit
a best guess of a rate of change for a data set
Normal Distribution
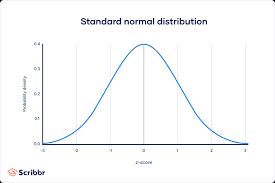
Z-score
total of normal distribution
Independent events
one event does not affect the other
Disjoint events
they do not overlap
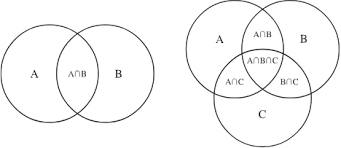
Venn Diagram
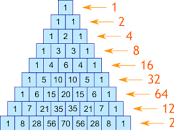
Pascal’s Triangle
Combination
(n over k) = n!/k!(n-k)!
Permutation
(n over k)
Degree
the exponent x^1 x², x³, etc.
Linear, quadratic, cubic
Linear (x), quadratic (x²), cubic (x³)
Leading term
ex. 5x^7 - 4x³ + x² - 7x + 3
ans: 5x^7 → has highest degree in function
Leading coefficient
ex. 5x^7 - 4x³ + x² - 7x + 3
ans: 5
Constant
ex. 5x^7 - 4x³ + x² - 7x + 3
ans: 3 → does not have an x next to it
Roots
where a line crosses or touches the x axis; zeros
Multiplicity
the number of times a given factor appears in the factored form of the equation of a polynomial
Standard form
f(x)=ax²+bx+c
Root form
y=a(x-r1)(x-r2)
End behavior
this describes what the graph of a function looks like as approaches positive or negative infinity
Index
a small number that tells us how many times a term has been multiplied by itself
Holes
missing points (cancel out)
roots (rat. function)
left over factors in the numerator
Vertical asymptotes
remaining factors in the denominator
Horizontal asymptote
3 cases
x²/x³ → y=0
2x²/x² → y=2
need long division
Domain
the set of values that we are allowed to plug into our function